The diversity of Type Ia Supernovae: evidence for systematics?
Abstract
The photometric and spectroscopic properties of 26 well observed Type Ia Supernovae (SNe Ia) were analyzed with the aim to explore SN Ia diversity. The sample includes (Branch-)normal SNe as well as extreme events like SNe 1991T and 1991bg, while the truly peculiar SN Ia, SN 2000cx (Li et al., 2001) and SN 2002cx (Li et al., 2003) are not included in our sample. A statistical treatment reveals the existence of three different groups. The first group (FAINT) consists of faint SNe Ia similar to SN 1991bg, with low expansion velocities and rapid evolution of SiII velocity. A second group consists of “normal” SNe Ia, also with high temporal velocity gradient (HVG), but with brighter mean absolute magnitude and higher expansion velocities than the FAINT SNe. The third group includes both “normal” and SN 1991T-like SNe Ia: these SNe populate a narrow strip in the SiII velocity evolution plot, with a low velocity gradient (LVG), but have absolute magnitudes similar to HVGs. While the FAINT and HVG SNe Ia together seem to define a relation between (SiII) and (B), the LVG ones either do not conform with that relation or define a new, looser one. The (SiII) pre-maximum evolution of HVGs is strikingly different from that of LVGs. The impact of this evidence on the understanding of SN Ia diversity, in terms of explosion mechanisms, degree of ejecta mixing, and ejecta-CSM interaction, is discussed.
1 Introduction
Given the role of Type Ia Supernovae as distance indicators for cosmology and main producers of heavy elements in the Universe, understanding the physics of their explosions and how it influences observables is one of the most fundamental issues in modern Astrophysics. One of the keys to penetrate into the secrets of SN Ia physics is to explore the origin of their diversity.
During the last decade a new paradigm for SNe Ia was developed. In
particular, a correlation between the peak luminosity and the shape of
the early light curve was found, with brighter objects having a slower
rate of decline than dimmer ones (Phillips 1993; Phillips et al. 1999,
hereinafter P99). This is matched by a spectroscopic sequence, defined
by the ratio of the depth of two absorption features of SiII at 5972 and 6355
Å (typically observed at 5800 and 6150 Å, respectively)
(Nugent et al., 1995). This ratio, (SiII), also correlates with the
absolute magnitude of SNe Ia and, in turn, with the rate of
decline. Spectral modeling indicates that most of the spectral
differences are caused by variations in the effective temperatures
which, in the context of Chandrasekhar-mass explosions, can be
interpreted in terms of a variation in the mass of 56Ni produced
in the explosions.
Alternatively, Garnavich et al. (2004), using synthetic spectra,
tentatively suggest that in SN 1999by and, in general,
in SNe Ia with (B) the 5800 Å feature is
mostly due to TiII transitions rather than to SiII.
Although a one-parameter description of SNe Ia has proved to be very useful, it does not completely account for the observed diversity of SNe Ia, (e.g. (Benetti et al., 2004; Pignata et al., 2004)). Hatano et al. (2000) showed that, contrary to expectations, (SiII) correlates poorly with the photospheric velocity deduced from the Si II absorption. To account for this, they suggested that two or more explosion mechanisms are required to explain SN Ia variety. Furthermore, some SNe Ia with normal spectra (i.e. showing only lines of typical ions) were noticed to show exceptionally high absorption line blueshifts (Branch, 1987). Finally, no correlation was found between the blueshift of the Si II 6355 absorption at the time of maximum brightness and the decline rate parameter, (B), in a small sample of well-observed SNe Ia (see also Patat et al. 1996).
In this paper we further explore this issue, using detailed observations of a large sample of SNe Ia.
2 Analysis
The sample used in this work consists of 26 well-studied SNe Ia. It includes (Branch-)normal SNe (Branch & van den Bergh, 1993) as well as extreme events like SNe 1991T and 1991bg. Photometric parameters such as (B), extinction and apparent magnitude at maximum are from P99 or alternatively from Altavilla et al. (2004). The spectral parameters have been (re-)measured homogeneously on the available spectra, most of which are published although unpublished material collected in the Asiago Supernova Archive (ASA) by the Padua-Asiago SN group and the European Supernova Collaboration was also used. In Table 1 we summarize the main photometric and spectroscopic parameters of the SN Ia sample, together with the morphological type (T) of the host galaxy as given in RC3. The SNe are divided into three groups according to the criteria discussed in Sect. 2.1. In each group the SNe are arranged by decreasing (see Sect. 2.1).
2.1 Expansion velocities from SiII
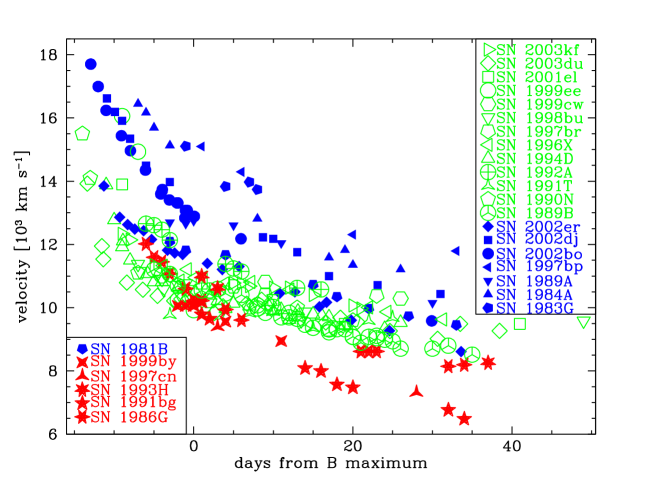
The expansion velocity of the ejecta gives a direct indication of the kinetic energy of the explosion. The blue-shift of the SiII absorption, the most prominent line in the photospheric phase spectrum, traces the evolution of the expansion velocity of the ejecta over the first 4-5 weeks past explosion. A plot of the time evolution of the expansion velocity, v(Si) for the SNe Ia of our sample (Figure 1) confirms the results of Branch (1987). At any given phase, expansion velocities span a wide range of km s-1, from the very rapidly expanding ejecta of SNe 1983G and 1997bp to the low velocity, SN 1991bg-like events. Between these limits both the “Branch normal” SNe Ia and the luminous SN 1991T-like events are found. A convenient parameter to distinguish different SNe Ia is the expansion velocity measured 10 days past maximum, (SiII). As we mentioned earlier, this parameter correlates poorly with (SiII) (Hatano et al., 2000) or with (B) (Patat et al., 1996), hence it may give interesting clues for origin of SN Ia diversity.
Upon a more careful scrutiny, and thanks to the excellent coverage offered by the new data, it can be noticed that the velocities show not only a spread in value, but also significant differences in velocity evolution. In particular, a sub-group of very homogeneous SNe Ia, characterized by a shallow evolution of the expansion velocity (open symbols in Fig. 1), populates a narrow strip in the post-maximum velocity evolution diagram. For a quantitative analysis we introduce a new parameter, v/t, which is the average daily rate of decrease of the expansion velocity (Tab. 1, col. 4). This is derived from least squares fits of the measurements taken between maximum and either the time the SiII feature disappears or the last available spectrum, whichever is earlier.
On average, the low (temporal) velocity gradient (LVG) SNe Ia have a velocity gradient km s-1 d-1. The SNe Ia shown as filled symbols have a larger km s-1 d-1, reaching 110-125 km s-1 d-1 for SNe 2002bo, 1991bg, and 1983G (although the value for SN 1983G is quite uncertain).
A similar dichotomy in velocity slopes between SNe Ia can be found in the velocities deduced from the SII line, this time at pre-maximum phases (see Figure 11 of Benetti et al. (2004)).
For an objective identification of possibly homogeneous groups, we
performed a hierarchical cluster analysis for the SN Ia sample of
Table 1, considering both photometric and spectroscopic
parameters, but neglecting the dependence on galaxy morphological
type. Hierarchical Cluster Analysis (Anderberg, 1973) is an
exploratory data analysis tool which aims to identify relatively
homogeneous groups of events based on selected characteristics, using
an algorithm that starts with each case in a separate cluster and
combines clusters until only one is left. Cluster analysis simply
discovers structures in data without explaining why they exist. The
choice of the number of clusters to be considered is somewhat
arbitrary although a criterion is the distance of the groups in the
parameter space.
Indeed, in the five dimensions space we found three well separated
clusters:
- a)
-
A first cluster (FAINT) consists of faint SNe Ia, with (), similar to SN 1991bg. All these SNe have a high post-maximum luminosity decline rate, (B) (), and SiII line ratio, (SiII)=0.58 (). They have small expansion velocities, (SiII)=9.2 (), and a large velocity gradient, ().
- b)
-
A second group consists of “normal” SNe Ia with high velocity gradient (HVG), (). These SNe have average absolute magnitude , (B)= (), and (SiII)=0.20 (). They typically have high expansion velocities, (SiII)=12.2 ().
- c)
-
A third group consists of SNe with a low velocity gradient (LVG): (), but it includes both “normal” SNe Ia and all the brightest SNe. Although its post-maximum decline rate is somewhat slower than that of the HVG SNe, (B)=1.1 (), its average luminosity is similar: , and so is their (SiII)=0.25 (). On average, the LVG SNe have lower and more homogeneous expansion velocities than the HVG SNe, (SiII)=10.3 ().
For a few events, in particular SNe 1989B and 1992A, cluster membership is uncertain. A small variation of the parameters, still within the errors, could shift them from the LVG to the HVG group.
It is also interesting that on average the host galaxy morphological type is
progressively later as one moves from FAINT to HVG and to LVG. The average
values are , 0.6, and 2.5, respectively. The dispersion within each group
is however very large (). This is consistent with the finding that
bright SNe Ia occur preferentially in late type galaxies, while faint SNe Ia
are more often found in early type galaxies (Altavilla et al., 2004).
| SN | (B)∗ | M | (SiII)∗∗∗ | (SiII) | T(RC3) | References | |
| [kms-1d | [kms-11000-1] | ||||||
| LVG | |||||||
| 92A | -18.81 | -1.9 | P99; ASA; K93 | ||||
| 89B | -18.87 | 3.0 | P99; B90; W94 | ||||
| 03kf | -19.37 | 3.0 | a | ||||
| 96X | -19.24 | -5.0 | P99; S01 | ||||
| 99ee | -19.46 | 4.0 | S02; H02 | ||||
| 90N | -19.23 | 3.8 | P99; ASA; L91 | ||||
| 94D | -19.06 | -2.0 | P99; P96 | ||||
| 03du | -18.93 | 8.0 | b | ||||
| 01el | -18.71 | 5.9 | K03; W03; c | ||||
| 97br | -19.62 | 7.0 | ASA; L99 | ||||
| 99cw | -19.24 | 1.5 | d | ||||
| 91T | -19.62 | 3.8 | P99; P92; M95 | ||||
| 98bu | -19.12 | 2.0 | P99; ASA; H00 | ||||
| HVG | |||||||
| 83G | -18.62 | -2.2 | H83; B85; T85; B91; B89; e | ||||
| 02bo | -19.42 | 1.0 | B04 | ||||
| 97bp | -19.69 | # | A04; ASA | ||||
| 02er | -19.45 | 1.0 | P04; f | ||||
| 84A | -19.46 | 1.0 | B89; Ba89; W87; e | ||||
| 89A | -19.21 | 4.1 | B91; e | ||||
| 02dj | -19.05 | -5.0 | g | ||||
| 81B | -19.21 | 4.5 | P99; B83 | ||||
| FAINT | |||||||
| 99by | -16.64 | 3.0 | B99; V02; H01 | ||||
| 91bg | -16.81 | -4.7 | P99; T96 | ||||
| 97cn | -16.95 | -5.0 | T98 | ||||
| 93H | -18.20 | 1.9 | P99; ASA; h | ||||
| 86G | -17.48 | -2.2 | P99; P87; C92 | ||||
* reddening corrected according to P99
** Cepheids distances taken from Altavilla et al. 2004
(Hkm s-1 Mpc-1) when available,
otherwise relative distances to Virgo taken from Kraan-Korteweg (1982) and a Virgo
distance of 15.3 Mpc (Freedman et al., 2001) or from Hubble flow
*** in units of 1000 km s-1
**** measured at maximum light
†SiII not visible on the -3d spectrum; spectra close to maximum not available.
††measured on the earliest available spectrum()
# Irregular galaxy
a) Salvo et al. 2004, in preparation
b) Stanishev et al. 2004, in preparation
c) Mattila et al. 2004, in preparation
d) Bufano et al. 2004, in preparation
e) McDonald archive; 89A, 84A and 83G: determination of (B) from published data
f) Kotak et al. 2004, in preparation
g) Pignata et al. 2004, in preparation
h) CTIO Archive
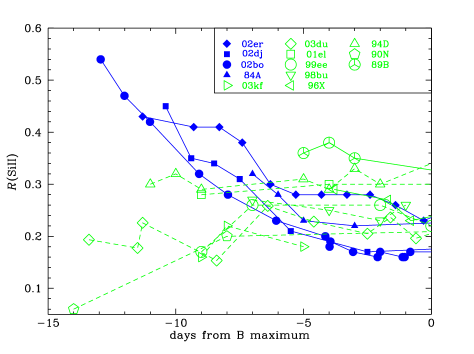
2.2 Pre-maximum evolution of (SiII)
Figure 2 shows the pre-maximum evolution of (SiII) for our sample of SNe Ia. Interestingly, the HVG SNe Ia for which very early observations are available show a dramatic temporal evolution of (SiII), starting from a high value well before maximum and leveling-out just before maximum, as was the case for SN 2002bo (Benetti et al., 2004). On the other hand, the LVG SNe show on average either no evolution in (SiII) before maximum or an evolution in the opposite sense in the case of SN 1990N. Clearly, the number of SNe Ia for which very early spectra are available is still too small to draw definite conclusions, but it is worth speculating on a possible interpretation.
Since (SiII) is related to the photospheric temperature of the ejecta (Nugent et al., 1995), the curves in Fig. 2 should trace the temperature evolution in the line forming regions before maximum light. HVG SNe seem to start at cooler temperatures, which then increase approaching maximum. LVG SNe, on the other hand, have high temperatures already well before maximum. This may be related to the fact that LVG SNe have lower expansion velocities, especially before maximum, and are also hotter.
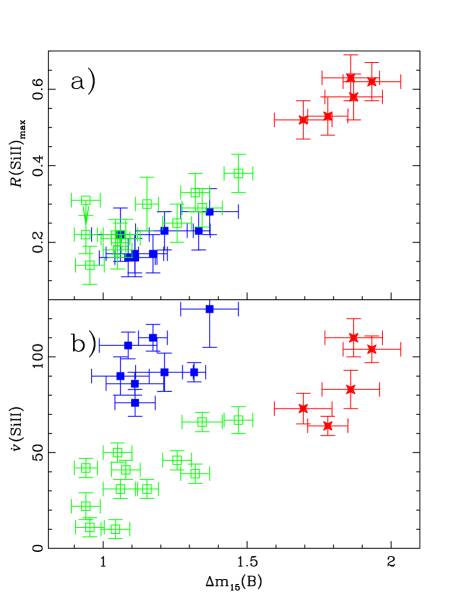
2.3 (SiII)max vs. (B)
In Figure 3a, the value of (SiII)max measured for each SN Ia at maximum light is plotted against (B). SNe in both the FAINT and HVG groups seem to follow the relation between (SiII)max and (B) established by Nugent et al. (1995). LVG SNe, on the other hand, are more scattered in this plot, especially at the bright, slow end. Either they do not conform with the (SiII)max – (B) relation or they define a new, looser one.
The scatter of LVG SNe in Figure 3a, especially at low (B), suggests
that another physical parameter besides the temperature is needed to
describe their behavior. Garnavich et al. (2004), using SYNOW synthetic
spectra, tentatively suggest that in SN 1999by and, in general, in
SNe Ia with (B) the 5800 Å feature is mostly due to TiII
transitions rather than to SiII, and claim that only with this
interpretation can the (SiII)max – (B) relation be understood.
However, neither our synthetic spectral analysis of SN 1991bg
(Mazzali et al., 1997), nor the spectral tomography analysis of the normal
SN Ia, SN 2002bo exploring a wide range of photospheric temperatures
and chemical compositions (Stehle et al., 2004), requires a relevant contribution
from the TiII transitions to fit the 5800 Å feature. Indeed, in the
above mentioned models, the 5800 Å feature is always well fitted by
the SiII 5972 Å transition.
As for the SNe Ia with (B), Garnavich et al. (2004) confirm that the 5800
Å feature is indeed SiII.
2.4 vs. (B)
The (B) parameter is plotted versus in Figure 3b. The expansion velocity evolution gradient, , seems to be weakly correlated with (B): while SNe with a large (B) (the FAINT group) have a large , normal SNe can have both a large or a small . Cluster analysis however suggests that we are dealing with three distinct families of SNe Ia: FAINT, LVG, and HVG. These three groups may be characterized by different physical parameters governing the same explosion mechanism (possibly distinguishing LVG and HVG) or by a totally different kind of explosion, which may be the case especially for the FAINT group.
3 DISCUSSION
Based on the evidence presented above, we can make a preliminary attempt to explain the causes of the spectroscopic diversity among SNe Ia.
As Figures 1,2 and 3 show, SNe Ia can be divided into three groups. Each group has distinct physical properties, different from those of other groups. In particular, the FAINT group (essentially the SN 1991bg-like objects, plus SNe 1986G and 1993H according to this method - but see Meikle (2000) for an infrared view) clearly differs from the other two: these SNe are fast decliners in both luminosity and velocity, they have typically low velocities and occur in earlier-type galaxies. This may be not surprising, since in many ways SN 1991bg–like objects stand out as odd.
For the other two groups, the situation is more complicated: both HVG and LVG include normal SNe, but the LVG include also all the brightest, slowest declining SNe. Our analysis suggests that LVG and HVG are two distinct groups, but they may possibly represent a continuum of properties.
Interestingly, although it is common to refer to two main groups of peculiar SNe Ia, SN 1991bg– and SN 1991T–like, the latter SNe fall in the same class as normal SNe, while the former do not. There appears to be a discontinuity of properties between SN 1991bg-like objects and all other SNe Ia, which is not seen for SN 1991T–like SNe. This is not what we might expect if SNe Ia behaved as a simple one-parameter family of events.
Based on a qualitative analysis Benetti et al. (2004) suggested that the large blueshift of the SiII line in SN 2002bo (a HVG SN) maybe the result of a delayed detonation explosion. Moreover, Lentz et al. (2000) find, from detailed non-LTE calculations, that some delayed-detonation models can account for the very high SiII blueshift of another HVG, SN 1984A. It may be that the HVG SNe are delayed-detonations, their internal dispersion arising from a range of transition densities, while the LVG SNe are deflagrations. This would be an extension of the results of Hatano et al. (2000) (see their Figure 1). The only difference with their conclusions would be that SNe 1981B and 1992A would become a delayed-detonation and a deflagration event, respectively. From spectropolarimetric studies Wang et al. (2004) also reached the conclusion that the explosion mechanism of SNe 1984A, 1997bp, 2002bo (all HVG SNe) and of SN 2004dt, which is most probably also a HVG SN, may be markedly different from that of lower velocity objects such as SN 1994D.
The LVG include all three SNe in our sample with (B): SNe 1991T, 1999cw and 1999ee. SN 1991T has also often been discussed as the result of a delayed detonation, especially in order to explain the high abundance of 56Ni and its decay products at the highest velocities (Mazzali, Danziger, & Turatto, 1995), so its inclusion in the LVG does not support the hypothesis that all LVG are deflagrations. Very early measurements of (Si) are not possible for SN 1991T, since the SiII line was almost absent in the earliest spectra owing to the high degree of ionization. The photospheric velocities inferred from spectral models were however very high (Mazzali, Danziger, & Turatto, 1995). This might support the suggestion made by Wang et al. (2004) that SN 1991T-like events could be 1984A-like events viewed at different angles (and thus HVGs).
Differences in the properties of the outer ejecta, such as a different degrees of mixing, or of circum-stellar interaction, may also be at the origin of the difference between LVG and HVG.
More efficient mixing out of heavy elements might result in an initially higher photospheric velocity. At the earliest times the photosphere should in fact tend to trace the heavier elements, since they have much larger line opacity and this is the major contributor to the optical depth (Pauldrach et al., 1996). The initial rate of decrease of the velocity with time would consequently be larger, as the photosphere moves inward to layers that are not so different from those of less mixed SNe. This would also mean an initially lower temperature (resulting from the large photosphere) but increasing with time. This would be the HVG group.
On the other hand, less efficient mixing could lead to initially smaller photospheric velocities: light elements contribute much less to the opacity and thus the photosphere would be deeper and the pre-maximum temperature higher. The decline rate of the velocity would then be smaller, and the temperature would either stay constant or decline, depending on the exact combination of increasing luminosity and decreasing photospheric velocity. These are the properties of the LVG.
Very high-velocity features have been observed in all SNe with sufficiently early spectra (Mazzali et al., in preparation). Maybe in the LVG the interaction affects the spectra only very early, as in SN 1999ee (Mazzali et al., 2005) or SN 1990N (Fisher et al., 1997; Mazzali, 2001), and there is a sudden drop to lower velocities when the interaction ends, resulting in a lower post-maximum , while it continues for a longer time in the HVG, so that (SiII) spans a broader range of values.
In both of these last scenarios, LVG and HVG SNe would not necessarily be differentiated by the nature of the explosion, and they may even represent a continuum of properties.
References
- Altavilla et al. (2004) Altavilla, G., et al. 2004, MNRAS, 349, 1344 (A04)
- Anderberg (1973) Anderberg, M.R., 1973, Cluster Analysis for Applications. Academic Press, New York
- Barbon, Rosino, & Iijima (1989) Barbon, R., Rosino, L., & Iijima, T. 1989, A&A, 220, 83 (Ba89)
- Barbon et al. (1990) Barbon, R., Benetti, S., Rosino, L., Cappellaro, E., & Turatto, M. 1990, A&A, 237, 79 (B90)
- Benetti (1989) Benetti, S. 1989, Degree Thesis, Universitá di Padova (B89)
- Benetti, Cappellaro, & Turatto (1991) Benetti, S., Cappellaro, E., & Turatto, M. 1991, A&A, 247, 410 (B91)
- Benetti et al. (2004) Benetti, S., et al. 2004a, MNRAS, 348, 261 (B04)
- Bonanos et al. (1999) Bonanos, A., Garnavich, P., Schlegel, E., Jha, S., Challis, P., Kirshner, R., Hatano, K., & Branch, D. 1999, Bull. Am. Astron. Soc., 31, 1424 (B99)
- Branch et al. (1983) Branch, D., Lacy, C. H., McCall, M. L., Sutherland, P. G., Uomoto, A., Wheeler, J. C., & Wills, B. J. 1983, ApJ, 270, 123 (B83)
- Branch (1987) Branch, D. 1987, ApJ, 316, L81
- Branch & van den Bergh (1993) Branch, D. & van den Bergh, S. 1993, AJ, 105, 2231
- Branch, Fisher, & Nugent (1993) Branch, D., Fisher, A., & Nugent, P. 1993, AJ, 106, 2383
- Buta, Corwin, & Opal (1985) Buta, R.J., Corwin, H.G., & Opal, C.B. 1985, PASP, 97, 229
- Cristiani et al. (1992) Cristiani, S., et al. 1992, A&A, 259, 63 (C92)
- Fisher et al. (1997) Fisher, A., Branch, D., Nugent, P., Baron, E. 1997, ApJ, 481, L89
- Freedman et al. (2001) Freedman, W. L., et al. 2001, ApJ, 553, 47
- Garnavich et al. (2004) Garnavich, P.M., et al. 2004, ApJ, in press (astro-ph/0105490)
- Hamuy et al. (2002) Hamuy, M., et al. 2002, AJ, 124, 2339 (H02)
- Harris et al. (1983) Harris, G.L., Hesser, J.E., Massey, P., Peterson, C.J., & Yamanaka, J.M. 1983, PASP, 95, 607
- Hatano et al. (2000) Hatano, K., Branch, D., Lentz, E.J., Baron, E., Filippenko, A.V., & Garnavich, P.M. 2000, ApJ, 543, L49
- Hernandez et al. (2000) Hernandez, M., et al. 2000, MNRAS, 319, 223 (H00)
- Howell, Höflich, Wang, & Wheeler (2001) Howell, D.A., Höflich, P., Wang, L., & Wheeler, J.C. 2001, ApJ, 556, 302 (H01)
- Kirshner et al. (1993) Kirshner, R.P., et al. 1993, ApJ, 415, 589 (K93)
- Kraan-Korteweg (1982) Kraan-Korteweg, R.C. 1986, A&AS, 66, 255
- Krisciunas et al. (2003) Krisciunas, K., et al. 2003, AJ, 125, 166 (K03)
- Leibundgut et al. (1991) Leibundgut, B., Kirshner, R.P., Filippenko, A.V., Shields, J.C., Foltz, C.B., Phillips, M.M., & Sonneborn, G. 1991, ApJ, 371, L23 (L91)
- Lentz et al. (2000) Lentz, E.J., Baron, E., Branch, D., Hauschildt, P.H., & Nugent, P.E. 2000, ApJ, 530, 966
- Li et al. (1999) Li, W. D., et al. 1999, AJ, 117, 2709 (L99)
- Li et al. (2001) Li, W., et al. 2001, PASP, 113, 1178
- Li et al. (2003) Li, W., et al. 2003, PASP, 115, 453
- Mazzali et al. (1997) Mazzali, P. A., Chugai, N., Turatto, M., Lucy, L. B., Danziger, I. J., Cappellaro, E., della Valle, M., & Benetti, S. 1997, MNRAS, 284, 151
- Mazzali (2001) Mazzali, P. A. 2001, MNRAS, 321, 341
- Mazzali, Danziger, & Turatto (1995) Mazzali, P.A., Danziger, I.J., & Turatto, M. 1995, A&A, 297, 509 (M95)
- Mazzali et al. (2005) Mazzali, P. A., Benetti, S., Stehle, M., Branch, D., Deng, J., Maeda, K., Nomoto, K., & Hamuy, M. 2005, MNRAS, submitted
- Meikle (2000) Meikle, W.P.S. 2000, MNRAS, 314, 782
- Nugent et al. (1995) Nugent, P., Phillips, M., Baron, E., Branch, D., & Hauschildt, P. 1995, ApJ, 455, L147
- Patat et al. (1996) Patat, F., Benetti, S., Cappellaro, E., Danziger, I.J., della Valle, M., Mazzali, P.A., & Turatto, M. 1996, MNRAS, 278, 111 (P96)
- Pauldrach et al. (1996) Pauldrach, A.W.A., Duschinger, M., Mazzali, P.A., Puls, J., Lennon, M., Miller, D.L. 1996 A&A, 312, 525
- Phillips et al. (1987) Phillips, M.M., et al. 1987, PASP, 99, 592 (P87)
- Phillips et al. (1992) Phillips, M.M., Wells, L.A., Suntzeff, N.B., Hamuy, M., Leibundgut, B., Kirshner, R.P., & Foltz, C.B. 1992, AJ, 103, 1632 (P92)
- Phillips (1993) Phillips, M. M. 1993, ApJ, 413, L105
- Phillips et al. (1999) Phillips, M.M., Lira, P., Suntzeff, N.B., Schommer, R.A., Hamuy, M., & Maza, J. 1999, AJ, 118, 1766 (P99)
- Pignata et al. (2004) Pignata, S., et al. 2004, MNRAS, in press (P04)
- Salvo et al. (2001) Salvo, M.E., Cappellaro, E., Mazzali, P.A., Benetti, S., Danziger, I.J., Patat, F., & Turatto, M. 2001, MNRAS, 321, 254 (S01)
- Stehle et al. (2004) Stehle, M., Mazzali, P.A., Benetti, S., Hillebrandt, W. 2004, MNRAS, submited (astro-ph/0409342)
- Stritzinger et al. (2002) Stritzinger, M., et al. 2002, AJ, 124, 2100 (S02)
- Tsvetkov (1985) Tsvetkov, D.Y. 1985, Soviet Astronomy, 29, 211
- Turatto et al. (1998) Turatto, M., Piemonte, A., Benetti, S., Cappellaro, E., Mazzali, P.A., Danziger, I.J., & Patat, F. 1998, AJ, 116, 2431 (T98)
- Vinkó et al. (2001) Vinkó, J., Kiss, L.L., Csák, B., Fűrész, G., Szabó, R., Thomson, J.R., & Mochnacki, S.W. 2001, AJ, 121, 3127 (V01)
- Wang et al. (2003) Wang, L., et al. 2003, ApJ, 591, 1110 (W03)
- Wang et al. (2004) Wang, L, Baade, D., Hoeflich, P., Wheeler, J.C., Kawabata, K., Khokhlov, A., Nomoto, K., Patat, F., 2004, ApJ, submitted, astro-ph/0409593.
- Wegner & McMahan (1987) Wegner, G. & McMahan, R. K. 1987, AJ, 93, 287 (W87)
- Wells et al. (1994) Wells, L. A., et al. 1994, AJ, 108, 2233 (W94)