Nature of a Strongly-Lensed Submillimeter Galaxy SMM J14011+02521
Abstract
We have carried out near-infrared spectroscopy of a gravitationally lensed submillimeter galaxy SMM J14011+0252 at , using OHS and CISCO on the Subaru telescope. This object consists of two optical components, J1 and J2, which are lensed by the cluster Abell 1835. J1 suffers additional strong lensing by a foreground galaxy at in the cluster. The rest-frame optical H, H, and [O ii]3727 lines are detected in both J1 and J2, and [N ii] lines are also detected in J1. A diagnosis of emission-line ratios shows that the excitation source of J1 is stellar origin, consistent with previous X-ray observations. The continua of J1 and J2 show breaks at rest-frame 4000Å, indicating relatively young age. Combined with optical photometry, we have carried out model spectrum fitting of J2 and find that it is a very young (50 Myr) galaxy of rather small mass () which suffers some amount of dust extinction. A new gravitational lensing model is constructed to assess both magnification factor and contamination from the lensing galaxy of the component J1, using - image. We have found that J1 suffers strong lensing with magnification of , and its stellar mass is estimated to be . These results suggest that SMM J14011+0252 is a major merger system at high redshift that undergoes intense star formation, but not a formation site of a giant elliptical. Still having plenty of gas, it will transform most of the gas into stars and will evolve into a galaxy of . Therefore, this system is possibly an ancestor of a less massive galaxy such as a mid-sized elliptical or a spiral at the present.
1 Introduction
Since the discovery of a large population of Lyman break galaxies (hereafter LBGs; Steidel et al. , 2003), a question whether we are seeing the majority of high- stellar population or more stars are hidden in dusty star-forming galaxies has been raised. It is expected that massive galaxy formation at high- may cause rapid chemical evolution and dust enrichment, leading them to a dusty phase like ultra-luminous infrared galaxies (hereafter ULIRGs) emitting most of their energy in the far-IR. Such objects are supposed to suffer from severe dust extinction, be unable to be picked up as LBGs defined by a spectral break in the rest-frame UV and only be detected in the far-infrared to submillimeter wavelength.
Deep submillimeter surveys by SCUBA on JCMT have revealed a large population of dusty galaxies at high-, whose far-IR luminosity exceeds satisfying the criterion of ULIRGs (see Blain et al. , 2002, and references therein). Their optical to near-IR (NIR) color is often red, and some of them display no optical/NIR counterpart even using 8-10m telescopes (Ivison et al. , 2002; Fox et al. , 2002; Frayer et al. , 2004). X-ray observations reveal that some of them contain type-2 AGNs, but contribution to the total luminosity is not clear (Alexander et al. , 2003). Submillimeter to radio flux ratios indicate that these objects lie at (Lilly et al. , 1999; Gear et al. , 2000; Hall et al. , 2001; Smail et al. , 2002; Ivison et al. , 2002; Fox et al. , 2002), and spectroscopic follow-ups of radio-selected sources reveal their median redshift to be around 2.4 (Chapman et al. , 2003). These objects are therefore thought to be an important population to probe the star-formation history of the universe. Due to their red color and faintness, their spectroscopic observations are time-consuming, so there is only a small sample of spectroscopically observed objects in the NIR (Ivison et al. , 2000; Frayer et al. , 2003; Smail et al. , 2003a, b; Tecza et al. , 2004; Simpson et al. , 2004). However, spectroscopy in the NIR is important because they cover the rest-frame optical wavelength, which provides us important information of their physical status, ionizing photons and stellar population. We therefore carried out low-resolution NIR spectroscopic observations of SMM J14011+0252, one of the brightest submillimeter galaxies at high-.
SMM J14011+0252 is discovered behind the cluster Abell 1835 () as a weakly lensed object (Smail et al. , 1998; Barger et al. , 1999; Frayer et al. , 1999). Intrinsic far-IR luminosity of indicates that this is an ULIRG, and inferred star formation rate (hereafter SFR) is few yr-1 (Ivison et al. , 2000, hereafter I00). It consists of two optical/NIR components; J1 and J2. They both lie at the same redshift of , and the separation is 21. Both are red in the rest-frame optical ( for J1 and 3.2 for J2) and J1 is also red in the rest-frame UV () while J2 is bluer (). Both show only weak Ly emission (I00). No other emission line is detected in the rest-frame UV, but strong H+[N ii] lines exist in the NIR spectra (I00; Tecza et al. , 2004). - image reveals a more complex structure of J1; it consists of several bright knots surrounded by an extended diffuse component with an ERO component (J1n) elongated toward north (Ivison et al. , 2001). Integral field spectroscopy in the -bands discovers an extended H emission cloud toward J1n (Tecza et al. , 2004). A continuum break at rest-frame 4000Å is found in J1, which indicates recent (Myr) massive star-formation activities.
Radio observations detect CO() (Frayer et al. , 1999; Ivison et al. , 2001; Downes & Solomon , 2003) and CO() (Downes & Solomon , 2003) lines at , which imply strong star-formation activity. The detection of CO() indicates that temperature of the gas cloud is K and its density is cm-3 (Downes & Solomon , 2003). The CO emission is extended over 2205 and centered at J1 (Downes & Solomon , 2003). A deep X-ray observation by Chandra shows no sign of X-ray emission (Fabian et al. , 2000), suggesting that this object doesn’t harbor a luminous AGN.
In addition to above, a detailed re-analysis of the optical spectrum reveals several absorption features at including Ca H+K (Smail et al, private communication (2003); Downes & Solomon , 2003). This suggests that the main component of J1 is a foreground evolved galaxy, possibly an elliptical galaxy in Abell 1835, and that the other knots of J1 are strongly-lensed images of the submillimeter galaxy at . Downes & Solomon (2003) estimated the magnification factor to be from their CO observation.
Here, we report results of low-resolution NIR spectroscopy of J1 and J2, using OH-airglow suppressor (OHS; Iwamuro et al. , 2001) and Cooled Infrared Camera and Spectrograph for OHS (CISCO; Motohara et al. , 2002) installed at the 8.2m Subaru telescope (Iye et al. , 2004). Thanks to the high sensitivity of OH-airglow suppression technique combined with the 8m aperture, high-S/N continuum spectra from rest-frame 3000 to 6500Å with several strong emission-lines are obtained.
We describe our observations and data reductions in section 2, display results in section 3, construct a new gravitational lensing model and discuss implication to the nature of this object in section 4, and summarize them in section 5. , , and are assumed throughout this paper.
2 Observations and Data Reductions
2.1 -Band Imaging and Spectroscopy
-band imaging and -band spectroscopy were carried out on 2002 February 28, with CISCO mounted at the IR-Nasmyth focus of the Subaru telescope. The optical-Nasmyth secondary mirror was used, and the pixel scale was 0111 pix-1.
-band images were taken with single exposure time of 20s and the telescope was nodded after every 3 frames by 10″ in a 4-point dither pattern. A total of 12 frames was acquired, for a total exposure time of 240s. The seeing size was 045. Before the -band imaging, a faint standard star FS 27 (Hawarden et al. , 2001) was observed for flux calibration.
The -band spectra were acquired with 065 slit, providing wavelength resolution of 400 at 2.15µm. The position angle of the slit was set at ∘ to introduce both J1 and J2 on the slit. Single exposure time was 200s, and the telescope was nodded 4″6″ after every 3 frames for sky subtraction. A total of 24 frames was taken for a total exposure time of 4800s. Then, A0 star SAO 120250 was observed for correction of the atmospheric and instrumental transmission curve.
2.2 -Band Imaging and -Band Spectroscopy
-band imaging and -band spectroscopy were carried out on 2002 March 1, 2, and May 18, with OHS and CISCO mounted at the IR-Nasmyth focus of the Subaru telescope. The opt-Nasmyth secondary mirror was used, and the pixel scale was 0111 pix-1.
-band images were taken with OHS in the imaging mode (see Iwamuro et al. , 2001) before the spectroscopic observations. Single exposure time was 50s and the telescope was nodded after every 3 frames by 10″ in the direction of the dark lane of OHS, which is the region where the OH airglow is suppressed. A total of 6 frames was acquired each day. FS 135 was observed after the observations on March 1 and 2, and FS 141 on May 18 for flux calibration. The seeing size was 0708.
-band spectra were acquired using a 095 slit, providing resolution of 210 at 1.65µm. Single exposure time was 1000s and the telescope was nodded after each exposure by 10″ along the slit. The position angle of the slit was again set at ∘ on March 1 and 2 to observe J1 and J2 simultaneously. On May 18, the position angle was set at 24∘ to observe J1 and J1n. Total exposure time was 6000s on March 1, 4000s on March 2, and 8000s on May 18. F0 star SAO 120154, A0 star SAO 120250, and F5 star SAO 120186 were observed after the target on March 1, 2, and May 18 respectively, for correcting atmospheric and instrumental transmission curve.
The log of the spectroscopic observations are summarized in Table 1.
2.3 Data Reductions
The imaging data are reduced in a standard procedure of flat-fielding, sky subtraction, bad-pixel correction, residual sky subtraction, and shift-and-add. Photometry is performed in an aperture of same size as the slit width and length used in the -band spectroscopy. The position angle of the aperture is set at ∘. Measured flux is summarized in Table 2.
The spectroscopic data are reduced in a standard procedure of flat-fielding, sky subtraction, bad-pixel correction, and residual sky subtraction. They are then corrected for the atmospheric and instrumental transmission curve, and are coadded to create final frames. Spatial widths of the aperture to extract 1-D spectra are 22 for J1 and 17 for J2. In the -band, wavelength calibration is carried out using the airglow lines in the raw frames. In the -band, because almost all the airglow lines are eliminated significantly by OHS, wavelength calibration is done using a pixel-wavelength relation obtained by previous observations of CISCO without OHS where the airglow lines are available. Systematic error of this pixel-wavelength relation is estimated to be less than 0.5 pixel (Å). Flux of the spectra is calibrated by the photometry of the - and -band imaging in Table 2.
2.4 WFPC2 Imaging
We also obtain archived WFPC2 data of Abell 1835 field (PI: Kneib, J.-P; PID: 8249), to investigate morphology and optical magnitude. All the frames with 2500s exposure each are combined into a single frame after cosmic-ray rejection. Total exposure time is 7500s.
3 Results
The final spectra of J1 and J2 extracted from the February and March data are shown in Figure 1. Although the wavelength resolution is lower () than that of Tecza et al. (2004) (), the quality of the continuum spectra is greater in the -band, owe to the high sensitivity of OHS. In J1, we detect strong H+[N ii] and relatively faint [O ii] and H. No [O iii] is found. In J2, H, H, and [O ii] are detected, but all the lines are weaker than those in J1. No line is resolved with the low resolution of OHS/CISCO, which is 750 km s-1 in the -band and 1400 km s-1 in the -band. The -band spectrum of J1 taken in May is identical to that taken in March, with weak H and [O ii] without [O iii] lines. J1n is not detected.
We next carry out line fitting with Gaussian profiles to estimate their redshift, flux and equivalent width. We also deblend H and [N ii], which are merged due to the low resolution, assuming [N ii]6583/[N ii]6548=3.0. Because the S/N of the spectra is low, line widths are fixed to the resolving power determined by the slit width. Results are given in Table 3, and fitted profiles of J1 are shown in Figure 2. We also estimate an 1 upper limit of the line flux of [O iii] in J1 to be W m-2. The lines of J2 are weaker, and the S/N is quite low. However, because the redshifts of all the lines match within 1 errors, we conclude these detection to be real.
4 Discussion
4.1 Emission Line Cloud of J1
A diagram of H/[N ii] and [O iii]/H is shown in Figure 3. The line ratios indicate that the emission line cloud of J1 is ionized/excited by massive stars, not by a strong AGN, which is consistent with the X-ray observations showing no sign of a luminous AGN unless it is Compton thick (Fabian et al. , 2000).
Balmer decrement is measured to be H/H=4.02.2. If we assume the intrinsic line ratio of a star-forming region to be 2.9 (Case B, K; Osterbrock , 1989) and adopt the SMC extinction curve (Pei, 1992), dust extinction is estimated to be . Due to the large errors in the line fluxes, the value is quite insecure. Nevertheless, this indicates that the H ii region suffers extinction of .
Lower limit of the metallicity can be assessed by or estimator. The metallicity derived from is (Pettini & Pagel , 2004), while that from is (Kobulnicky, Kennicutt, & Pizagno , 1999). These results are consistent with that of Tecza et al. (2004), suggesting that this system is well polluted by metals supplied from the starburst activities.
4.2 Gravitational Lensing Model
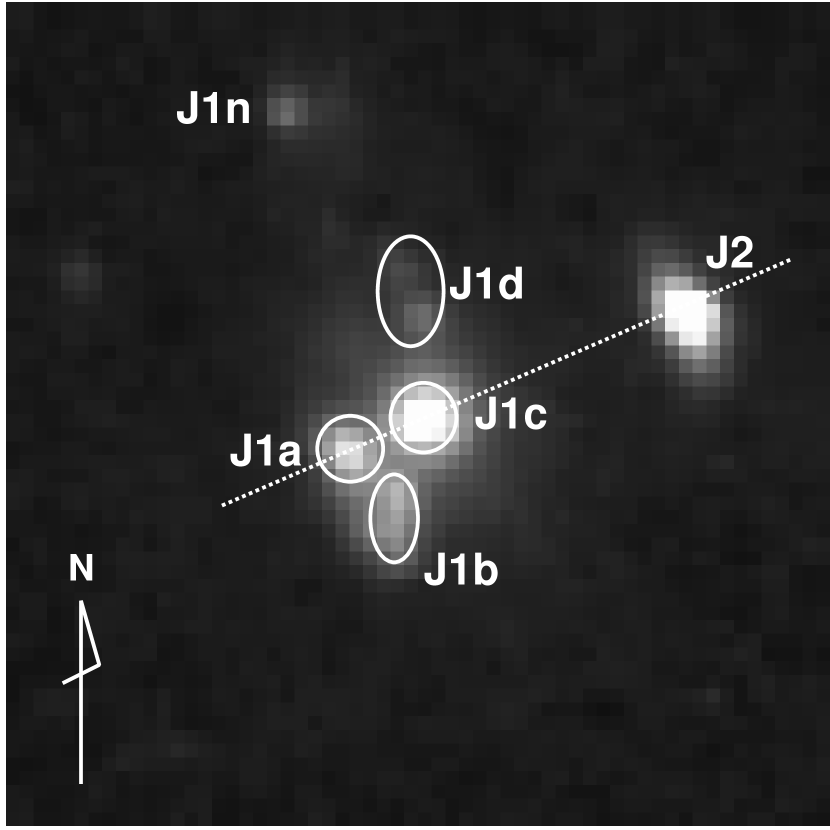
The - image is shown in Figure 4. It can be seen that J1 consists of many sub-components. We name them to be J1a, J1b, J1c, and J1d as labeled in the figure.
Recently, Smail et al. (2003; private communication) found Ca H+K and other absorption lines at in the optical spectrum of J1, which suggests J1 to be contaminated and strongly lensed by a foreground galaxy. Also, as seen in the H image (Figure 1 of Tecza et al. (2004)), the line brightness becomes weak at the position of J1c and a “hole” is seen there. These results indicate that J1c is a member of Abell 1835 at and causing a strong lensing effect on J1 at .
Downes & Solomon (2003) claimed that estimated brightness temperature of CO(32) is much smaller than that expected from the CO line ratio, and argued that this is due to the gravitational lensing effect. They roughly estimate the magnification factor to be 25. They also constructed a simple gravitational lensing model using the - image, assuming that J1a, J1b, J1n and J2 are all the lensed image of a single object. However, this model failed to reproduce the position of the observed components. In addition, it is known that the redshifts of J1 and J2 differ slightly (Ivison et al. , 2000; Tecza et al. , 2004) and they are thought to be different objects. We therefore propose a new gravitational lensing model assuming that J1a, J1b, and J1d are lensed images of a single object by J1c and Abell 1835. Hereafter, we refer to the lensing galaxy at as “J1c” and distinguish it from the lensed galaxy J1 at .
4.2.1 Lensing Model by GRAVLENS
We use gravitational lensing software GRAVLENS (Keeton , 2001). The model potential consists of two components J1c and Abell 1835, both lie at . The potential of J1c is assumed to be an isothermal ellipsoid with core radius , while that of Abell 1835 an NFW model with parameters taken from Schmidt et al. (2001). We then carry out fitting calculation of the positions and aperture fluxes of J1a, J1b, and J1d, by varying velocity dispersion , ellipticity , and position angle of the ellipticity of J1c. All the parameters of the lensing model is shown in Table 4. The uncertainty of each parameter is evaluated as follows: We start at the best fit model, and vary a single parameter at once. For the varied model, fitting is carried out by varying the position of the source to find the best-fit position. The average displacement between the positions of the best-fit spots and the original spots in the image plane is then calculated, and the error for the parameter is defined to be the value where the average displacement becmoes less than 01.
Using this model, we also reconstruct the lensed image of J1n, J2, and the extended H cloud found by Tecza et al. (2004). Positions and magnification factors of these components are listed in Table 5.
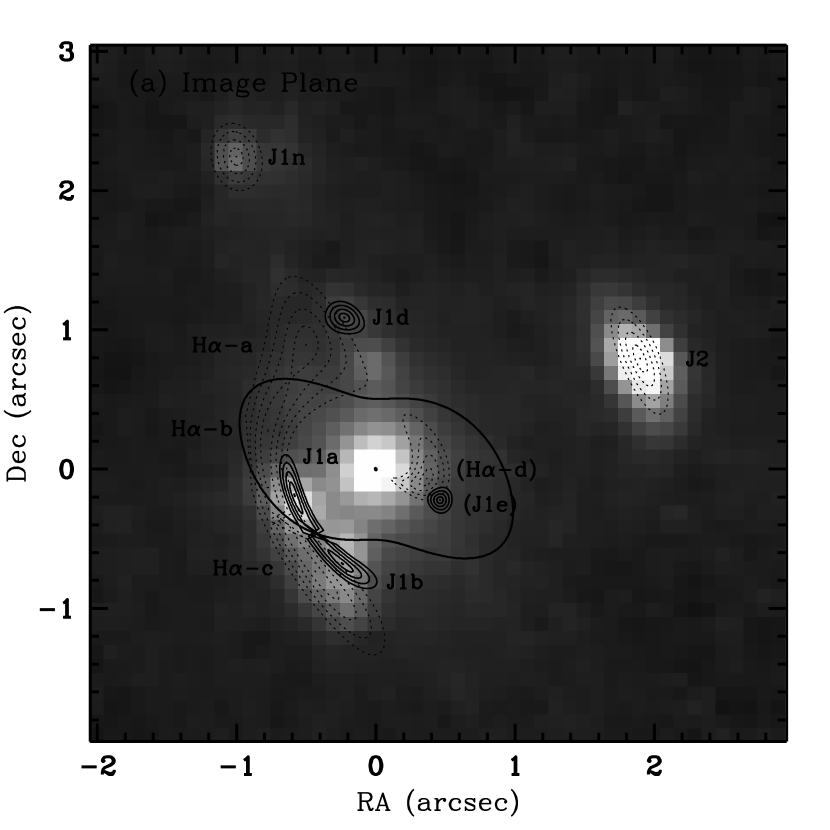
Figure 5 shows the image- and source-plane of the model. The solid contours show the profile of J1 at z=2.565 with an intrinsic diameter of 01 (0.8 kpc). It can be seen that J1a and J1b in the model image are elongated, while that in the - image is not. This suggests that the intrinsic size of J1 is smaller than 01 (0.8 kpc), and that what we are seeing is a kind of a circumnuclear starburst disk like that in a nearby ULIRG. The total magnification factor of J1 is found to be 34. However, we should keep in mind that this magnification factor is that of a point source. If the source is assumed to be extended by 01, the total magnification factor becomes 26.
Model contours of J1n, J2, and the H cloud are plotted with dotted lines. The extended H emission line reported in Tecza et al. (2004) is well reproduced by a cloud with an intrinsic size of 0204 (1.6 kpc 3.3 kpc) located at 01(0.8 kpc) west of J1. Its total magnification factor estimated from our model is 23 assuming that the H emission line region is extended by 03. This value matches that of the CO emission which is estimated to be (Downes & Solomon , 2003).
J1e, a counter image of J1 with half the flux of J1d, as well as H-d should appear in the west side of J1c. However, both are not detected in either the - or the H image. There are several explanations for this that; (1) they are absorbed by dust in the line of sight, presumably in J1c, (2) the real potential of J1c deviates from the model and the flux of J1e and H-d are depressed, and (3) J1a, J1b, and J1d are not a multiple image of a single source, but different components of a merging source structure. In the last case, the mass of J1c should be much smaller to avoid the multiple lensing. However, because the optical properties of J1c well matches our model as discussed in section 4.2.2, it is unlikely that the mass of the J1c is much smaller than our model. We therefore assume that J1e and H-d are depressed either by dust or by shape of the real potential.
4.2.2 Properties of the Lensing Galaxy
To check the feasibility of the gravitational lensing model, we next assess the optical properties of the lensing galaxy J1c and compare them with the model.
The profile of J1c in the - image is fitted with the Sérsic (1968) profile
where (Graham , 2001). Fitted parameters are and 5, and the flux within is estimated to be 3.1 Jy. Using spectra of 2–5 Gyr instantaneous burst model calculated by PEGASE (Fioc & Rocca-Volmerange , 1997), the stellar mass is then estimated to be 1.5–3.8.
On the other hand, the projected mass within of J1c estimated from the gravitational lensing model is 3.8 using the equation of Kochanek (1995), which contains both stellar mass and dark matter halo. Considering the dark matter fraction in early-type galaxies of (Treu & Koopmans , 2004), this is a good agreement with the value obtained above and our gravitational lensing model seems reasonable. In addition, the size (05 2 kpc) and the velocity dispersion (123 km/s) indicate that J1c is a relatively small elliptical in Abell 1835.
4.3 SEDs and Model Fitting
To quantify the stellar contents of J1 and J2 together with their star formation history, we combine the optical photometry of I00 with the current spectra to construct SEDs from the optical to NIR. Because I00 use 3″aperture for the photometry while our slit size is much smaller, we measured the ratio of the flux between the different aperture sizes in the -band, using the - image convolved to the 07 seeing size of the -band spectroscopy. This ratio is used to correct all the fluxes of the optical bands in I00. Also, an additional error of 0.1 mag is added to the optical data considering the systematic uncertainties in the flux calibration of the NIR spectra. The emission lines in the NIR spectra are removed by the Gaussian fitting described in section 3. The obtained SEDs are shown in Figure 6. Continuum breaks at rest-frame 4000Å are seen in both J1 and J2.
4.3.1 Component J2
We fit the SED of J2 by spectrum templates calculated by PEGASE (Fioc & Rocca-Volmerange , 1997) to which an empirical dust extinction law of starburst galaxies by Calzetti et al. (2000) is applied. Free parameters are dust extinction , age, and total mass. The initial mass function of Salpeter is adopted. We consider two extreme cases of star-formation history; one is an instantaneous burst, and the other is a continuous burst with duration of 1 Gyr. The results are summarized in Table 6, and the fitted spectra are shown in Figure 6b. J2 is expected to be dominated by very young population, and have formed of order of stars. We must keep in mind that the SED is extracted from a small aperture (1″2″), and what we see is only the central region of J2. 3″aperture flux in the -band (I00) indicates that the obtained mass may be all underestimated by a factor of .
4.3.2 Component J1
To assess the contamination of J1c to the SED of J1, the spectral shape of J1c is assumed to be that of a 2Gyr instantaneous burst model. It is scaled by the flux obtained from the - image, and plotted in Figure 6a as the dotted line. This model spectrum of J1c is then subtracted from the SED of J1 to obtain the intrinsic SED, which is shown as the dotted plots in Figure 6a.
It can be seen that the -band flux is little contaminated by J1c. This agrees with the result of I00 that the peak of J1 in the -band is slightly offset toward east from that in the -band, indicating that J1 at dominates the - and -band flux.
We next estimate the total intrinsic flux of J1 in the -band to be 25 Jy, by subtracting the model spectrum of J1c obtained above from the -band flux of I00 (3″aperture). Assuming the magnification factor of J1 to be 5 as a lower limit and the shape of the SED to be same as that of J2, the upper limit of the stellar mass in J1 is estimated to be . If more dust exists in this system than in J2, this upper limit of the stellar mass will become larger.
4.3.3 Formation Site of a Normal Galaxy?
The amount of gas reservoir in J1 is few , estimated from the CO observations (Downes & Solomon , 2003). Therefore, if SMM J14011+0252 is a place where a massive galaxy of is being assembled, stellar mass of must have already been assembled and hidden in dust. This is more than 100 times as much as the value calculated above, and extinction of is required among the galaxy. Although such an amount of extinction is broadly observed in the circumnuclear starburst disk in nearby ULIRGs (e.g. Genzel et al. , 1998), their size is smaller (kpc) and their stellar and gas masses are comparable to each other and much smaller () than those required in SMM J14011+0252. Therefore, considering the difficulty to hide a stellar component of in dust, it is more probable that SMM J14011+0252 is a site of less massive () galaxy formation.
If we assume that the submillimeter radiation is emitted from the same region that emits CO or H and its magnification factor is of order of 30, the intrinsic 850 m flux is mJy. This is the flux that most of less massive high- galaxies such as Lyman break galaxies are expected to emit at most (Chapman et al. , 2000) . Also, the luminosity in the far-IR wavelength becomes , which are same as that of local ULIRGs.
However, readers should keep in mind that above discussions are based on the uncertain gravitational lensing model, which does not have redshift information of the observed components to settle the membership. The uncertainty in the model parameters are also large and the calculated total magnification may change by factor of 2. Also, there is a possibility that that the position of the submillimeter source is offset from that of CO or H and it does not suffer a strong lensing effect. In such case, the total magnification is only a factor of 5, and the intrinsic luminosity in far-IR becomes an order of magnitude larger. Then, this object may be interpreted as a massive and dusty starburst forming a larger mass () of stars.
It is likely that the starburst in this system are triggered by an encounter of J1 and J2. If we ignore the radial distance (that is, assuming the distance between J1 and J2 is that observed in the source plane of 12=10 kpc) and assume the encounter to have occurred 50 Myr ago, the projected relative velocity is estimated to be 200 km s-1. Considering the radial distance and motion of J1 and J2, this matches the typical relative velocity of 1000 km s-1 in a cluster of galaxies.
Therefore, J1 may be a high- counterpart of the local ULIRGs such as Arp 220, and its submillimeter flux are magnified above the detection limit of SCUBA by the strong lensing effect of J1c. Its total barionic mass is , and we hypothesize that this object is a less-massive forming galaxy at which will evolve into a mid-sized elliptical or spiral galaxy such as the Milky-Way.
5 Summary
We have conducted spectroscopy of components J1 and J2 of the gravitationally lensed submillimeter galaxy SMM J14011+0252 at using OHS/CISCO at the Subaru telescope.
H, H, [O ii] lines in both J1 and J2 are detected , and [N ii] lines are also detected in J1. No [O iii] lines are found. From the emission line diagnosis, the emission line cloud of J1 is shown to be ionized/excited by stellar UV radiation, not by an AGN. The continuum is detected in both J1 and J2, and the Balmer breaks are clearly seen. The SED of J2 is fitted by a model spectrum of young ( Myr) stellar population with some amount of dust extinction.
The new gravitational lensing model is constructed to reproduce the small knots of J1, which also reproduces the morphology of the extended H cloud well. This model suggests that J1 may be strongly magnified by the elliptical galaxy in Abell 1835 by a factor of 30. Also, using this model together with the profile fitting of the lensing galaxy, the stellar mass of J1 at is estimated to be . This indicates that SMM J14011+0252 is not a formation site of a present-day massive elliptical, but more like a high- version of an ULIRG, and will become a present day spiral or mid-sized elliptical of .
References
- Alexander et al. (2003) Alexander, D. M., et al. 2003, AJ, 125, 383
- Barger et al. (1999) Barger, A. J., Cowie, L. L., Smail, I., Ivison, R. J., Blain, A. W., Kneib, J. -P. 1999, AJ, 117, 2656
- Blain et al. (2002) Blain, A. W., Smail, I., Ivison, R. J., Kneib, J. -P, & Frayer, D. T. 2002, Phys.Rept., 369, 111
- Calzetti et al. (2000) Calzetti, D., Armus, L., Bohlin, R. C., Kinney, A. L., Koornneef, J., & Storchi-Bergmann, T. 2000, ApJ, 533, 682
- Chapman et al. (2000) Chapman, S. C., et al. 2000, MNRAS, 319, 318
- Chapman et al. (2003) Chapman, S. C., Blain, A. W., Ivison, R. J., & Smail, I. 2003, Nature, 422, 695
- Costero & Osterbrock (1977) Costero, R., & Osterbrock, D. E. 1977, ApJ, 211, 675
- Downes & Solomon (2003) Downes, D. & Solomon, P. M. 2003, ApJ, 582, 37
- Fabian et al. (2000) Fabian, A. C., et al. 2000, MNRAS, 315, L8
- Filippenko & Terlevich (1992) Filippenko, A. V. & Terlevich, R. 1992, ApJ, 397, L79
- Fioc & Rocca-Volmerange (1997) Fioc, M., & Rocca-Volmerange, B. 1997, A&A, 326, 950
- Fox et al. (2002) Fox, M. J., et al. 2002, MNRAS, 331, 839
- Frayer et al. (1999) Frayer, D. T., et al. 1999, ApJ, 514, L13
- Frayer et al. (2003) Frayer, D. T., Armus, L., Scoville, N. Z., Blain, A. W., Reddy, N. A., Ivison, R. J., & Smail, I. 2003, AJ, 126, 73
- Frayer et al. (2004) Frayer, D. T., Reddy, N. A., Armus, L., Blain, A. W., Scoville, N. Z., & Smail I. 2004, AJ, 127, 728
- Frayer et al. (2003) Frayer, D. T., Armus, L., Scoville, N. Z., Blain, A. W., Reddy, N. A., Ivison, R. J., & Smail, I. 2003, AJ, 126, 73
- French (1980) French, H. B. 1980, ApJ, 240, 41
- Gear et al. (2000) Gear, W. K., Lilly, S. J., Stevens, J. A., Clemens, D. L., Webb, T. M., Eales, S. A., & Dunne, L. 2000, MNRAS, 316, L51
- Genzel et al. (1998) Genzel, R., et al. 1998, ApJ, 498, 579
- Graham (2001) Graham, A. W. 2001, AJ, 121,820
- Hawarden et al. (2001) Hawarden, T. G., Leggett, S. K., Letawsky, M. B., Ballantyne, D. R., & Casali, M. M. 2001, MNRAS, 325, 563
- Hall et al. (2001) Hall, P. B., et al. 2001, AJ, 121, 1840
- Iwamuro et al. (2001) Iwamuro, F., Motohara, K., Maihara, T., Hata, R., & Harashima, T. 2001, PASJ, 53, 355
- Ivison et al. (2000) Ivison, R. J., Smail, I., Barger, A. J., Kneib, J. -P., Blain, A. W., Owen, F. N., Kerr, T. H., & Cowie, L.L. 2000, MNRAS, 315, 209 (I00)
- Ivison et al. (2001) Ivison, R. J., Smail, I., Frayer, D. T., Kneib, J. -P, Blain, A. W. 2001, ApJ, 561, L45
- Ivison et al. (2002) Ivison, R. J., et al. 2002, MNRAS, 337, 1
- Iye et al. (2004) Iye, M., et al. 2004, PASJ, 56, 381
- Keeton (2001) Keeton, C. R. 2001, ApJ, submitted (astro-ph/0102340)
- Kobulnicky, Kennicutt, & Pizagno (1999) Kobulnicky, H. A., Kennicutt, R. C., & Pizagno, J. L. 1999, ApJ, 514, 544
- Kochanek (1995) Kochanek, C. S. 1995, ApJ, 445, 559
- Koski (1978) Koski, A. T. 1978, ApJ, 223, 56
- Lilly et al. (1999) Lilly, S. J., Eales, S. A., Gear, W. K. P., Hammer, F., Le Fèvre, O., Crampton, D., Bond, J. R., Dunne, L. 1999, ApJ, 518, 641
- Motohara et al. (2002) Motohara, K., et al. 2002, PASJ, 54, 315
- McCall et al. (1985) McCall, M. L., Rybski, P. M., & Shields, G. A. 1985, ApJS, 57, 1
- Osterbrock (1989) Osterbrock, D.E. 1989, Astrophysics of Gaseous Nebulae and Active Galactic Nuclei (Mill Valley: University Science Books)
- Pei (1992) Pei, Y. C. 1992, ApJ, 395, 130
- Pettini & Pagel (2004) Pettini, M., & Pagel, B. E. J. 2004, MNRAS, 348, L59
- Sérsic (1968) Sérsic, J. L. 1968, Atlas de Galaxias Australes (Córdoba: Obs. Astron.)
- Schmidt et al. (2001) Schmidt, R. W., Allen, S. W., & Fabian, A. C. 2001, MNRAS, 327, 1057
- Simpson et al. (2004) Simson, C., Dunlop, J. S., Eales, S. A., Ivison, R. J., Scott, S. E., Lilly, S. J., & Webb, T. M. A. 2004, MNRAS, 353, 179
- Smail et al. (1998) Smail, I., Ivison, R. J., Blain, A. W., & Kneib, J. -P. 1998, ApJ, 507, L21
- Smail et al. (2002) Smail, I., Ivison, R. J., Blain, A. W., & Kneib, J. -P. 2002, MNRAS, 331, 495
- Smail et al. (2003a) Smail, I., Chapman, S. C., Ivison, R. J., Blain, A. W., Takata, T., Heckman, T. M., Dunlop, J. S., & Sekiguchi, K. 2003a, MNRAS, 342, 1185
- Smail et al. (2003b) Smail, I., Ivison, R. J., Gilbank, D. G., Dunlop, J. S., Keel, W. C., Motohara, K., Stevens, J. A. 2003b, ApJ, 583, 551
- Steidel et al. (2003) Steidel, C. C., Adelberger, K. L., Shapley, A. E., Pettini, M., Dickinson, M., & Giavalisco, M. 2003, ApJ, 592, 728
- Tecza et al. (2004) Tecza, M., et al. 2004, ApJ, 605, L109
- Treu & Koopmans (2004) Treu, T. & Koopmans, L. V. E. 2004, ApJ, 611, 739
- Veilleux & Osterbrock (1987) Veilleux, S., & Osterbrock, D.E. 1987, ApJS, 63, 295


| Target | Date | Band | PA | |
|---|---|---|---|---|
| (s) | (∘) | |||
| J1/J2 | 2002 Feb 28 | 4800 | ||
| J1/J2 | 2002 Mar 1 | 6000 | ||
| J1/J2 | 2002 Mar 2 | 4000 | ||
| J1/J1n | 2002 May 18 | 8000 |
| Component | Aperture | ||
|---|---|---|---|
| (W m-2 µm-1) | (W m-2 µm-1) | ||
| J1 | 09522 | 9.20.5 | 12.20.7 |
| J2 | 09517 | 2.40.4 | 3.80.5 |
| Line | Line Flux | Continuum Flux | EWrest | |||
|---|---|---|---|---|---|---|
| (Å) | ( W m-2) | ( W m-2 µm-1) | (Å) | |||
| J1 | H | 6563 | 1.30.4 | 8.91.8 | 42 | 2.5650.001 |
| [N ii] | 6583 | 0.620.39 | 8.91.8 | 20 | 2.5650.001 | |
| H | 4861 | 0.330.12 | 10.90.5 | 8.5 | 2.5620.002 | |
| [O ii] | 3727 | 0.410.13 | 14.00.6 | 8.1 | 2.5630.003 | |
| J2 | H | 6563 | 0.480.34 | 1.91.1 | 72 | 2.5620.003 |
| [N ii] | 6583 | 0.270.33 | 1.91.1 | 40 | 2.5620.003 | |
| H | 4861 | 0.110.09 | 3.50.4 | 9.0 | 2.5610.005 | |
| [O ii] | 3727 | 0.260.09 | 3.60.4 | 20 | 2.5640.003 |
| Component | Parameter | Comment | |
|---|---|---|---|
| J1c | 123 km/s | Velocity dispersion of the potential | |
| 0.67 | Ellipticity of the potential | ||
| 53 ∘ | Position angle of ellipticity | ||
| 0+0.07 ″ | Core radius | ||
| Abell 1835 | 0.64 Mpc | ||
| 0.189 | |||
| 44 ″ | Distance from J1c in R.A. | ||
| 20 ″ | Distance from J1c in Dec. | ||
| Source Name | PositionaaPosition on the source plane in arcsec, relative to J1c. | Image Name | Magnification | PositionbbPosition on the image plane in arcsec, relative to J1c. |
|---|---|---|---|---|
| J1 | J1a | 11 | ||
| J1b | 13 | |||
| J1d | 6.3 | |||
| (J1e) | 3.1 | |||
| J1n | J1n | 4.4 | ||
| J2 | J2 | 5.7 | ||
| H | H-a | 12 | ||
| H-b | 10 | |||
| H-c | 9.5 | |||
| (H-d) | 2.0 |
| Model | Age | Stellar Mass | Total Mass | SFR | ||
|---|---|---|---|---|---|---|
| (Myr) | () | () | ( yr-1) | |||
| Instantaneous | 8 | 0.33 | 6.1 | 6.2 | 0.0 | 16.85 |
| 1Gyr Continuous | 70 | 0.40 | 1.7 | 2.4 | 4.4 | 22.83 |