Accurate Determination of the Mass Distribution in Spiral Galaxies:
High resolution Fabry–Perot data of six spiral galaxies are presented. Those data extend the previous sample of spiral galaxies studied with high resolution 3–D spectroscopy to earlier morphological types. All the galaxies in the sample have available H I data at 21 cm from the VLA or Westerbork. Velocity fields are analyzed and H rotation curves are computed and compared to H I curves. The kinematics of NGC 5055 central regions are looked at more closely. Its peculiar kinematics can be interpreted either as a bipolar outflow or as a counter-rotating disk, possibly hosting a ⊙ compact object.
Most of the H rotation curves present a significantly steeper inner slope than their H I counterparts. The 21 cm data thus seems affected by moderate to strong beam smearing. The beam smearing has an effect at higher scale-length/beam-width than previously thought (up to 20 km/s at a ratio of 8.5).
Key Words.:
galaxies: fundamental parameters (masses) – galaxies: individual: IC 2574, NGC 3109, UGC 2259, NGC 5585, NGC 6503, NGC 2403, NGC 6946, NGC 3198, NGC 5055, NGC 2841, NGC 5985 – galaxies: kinematics and dynamics – cosmology: dark matter – techniques: radial velocities1 Introduction
CDM N-body numerical simulations, predict that the innermost parts of density profiles are cuspy: e.g. Navarro et al. (1996) predict an inner slope while Moore et al. (1999) finds an inner slope . On the other hand, the observational results do not confirm these cosmological predictions but strongly suggest that dark halos have a constant central density (inner slope closer to than to ; e.g. de Blok et al., 2003; Swaters et al., 2003; Blais-Ouellette et al., 1999, 2001). Despite the observational evidences that the central density profiles of dark matter halos are better represented by a flat core than by a cusp, Navarro et al. (2003), using high resolution N-body simulations (down to 0.5 per cent of r200), continue to defend that the fitting formula proposed by NFW provides a reasonably good approximation to the density and circular velocity profiles of individual halos. Futhermore, they introduce a new fitting formula with a steeper slope to alleviate some of the differences with Moore et al. (1999). This seems at odds with observations, especially of dwarf and LSB galaxies.
This is the third paper in a series on high resolution Fabry-Perot spectroscopy of spiral galaxies. The first paper (Blais-Ouellette et al., 1999, hereafter paper I) showed the necessity of optical integral field spectroscopy to accurately determine the rotation curves in the inner parts of spiral and dwarf galaxies. The main reason being that H I rotation curves are affected by beam smearing, a natural consequence of their low spatial resolution (Begeman, 1987; Swaters, 1999b; van den Bosch et al., 2000). In combination with paper II (Blais-Ouellette et al., 2001), paper I also brought to light the great sensitivity of the mass distribution parameters to the inner rotation curve. The ideal rotation curve is therefore a combination of high resolution optical integral field spectroscopy and sensitive H I radio observations extending well beyond the luminous disk (see also Sofue et al., 1999, for high resolution CO data). Paper II has also shown the difficulties in reconciling dwarf and late type galaxies rotation curves with standard CDM N-body simulations (e.g. Navarro et al., 1996, 1997; Moore et al., 1998, 1999). While those simulations do not have the resolution to make definite predictions at small radii, an extrapolation of the functional form derived at larger radii predicts cuspy density profiles, implying much steeper inner slopes than observed in these galaxies. Rotation curves of all galaxy types were also shown to be more compatible with flat core density profiles.
| Name | Type | Dist. | D25 | RHO | ip3 | PAp3 | Vsysp3 | MB | LB | Ref. | |
| Mpc | ′ | ′ | ″ | ° | ° | km s-1 | Ł⊙ | ||||
| UGC 2259 | SBcd | 9.6∗ | 2.6 | 1.9 | 28.2 | 41 | 165 | 581 | -17.03 | 9.7 | C88 |
| NGC 2403 | SABcd | 3.2Fr | 21.9 | 13.0 | 134 | 61 | 126 | 137 | -19.50 | 93.6 | C90 |
| NGC 6946 | SABcd | 6.2Sh | 11.5 | 7.8 | 115.2 | 38 | 60 | 47 | -21.38 | 530 | Be |
| NGC 5055 | SAbc | 9.2∗ | 12.6 | 9.8 | 108.9 | 64 | 101 | 501 | -21.13 | 422 | Th |
| NGC 2841 | SAb | 14.1Ma | 11.3 | 6.2 | 52 | 66 | 150 | 633 | -21.93 | 880 | Be |
| NGC 5985 | SABb | 33.5∗ | 5.5 | 2.7 | 29.9 | 58 | 15 | 2515 | -21.74 | 738 | p3 |
| p3This study | Col 4: Diameter at the 25 B-mag/arcsec2 isophote | ||||||||||
| BeBegeman (1987) | Col 5: Holmberg radius | ||||||||||
| C88Carignan et al. (1988) | Col 6: Scale length | ||||||||||
| C90Carignan et al. (1990) | Col 7: Inclination | ||||||||||
| FrFreedman (1990) | Col 8: Position angle of the major axis | ||||||||||
| MaMacri et al. (2001) | Col 9: Systemic heliocentric velocity | ||||||||||
| ShSharina et al. (1997) | Col 10: Absolute B magnitude | ||||||||||
| ThThornley and Mundy (1997) | Col 11: Total B luminosity | ||||||||||
| ∗H0 = 75 km s-1 /Mpc | |||||||||||
The first step in showing the reality of this discrepancy is to eliminate the known possibilities of systematic observational biases. Two classes of error can contribute to the underestimation of the velocities, hence of the computed halo density, in the inner parts of spiral galaxies. The prime culprit in radio observations is the “beam smearing” effect due to the relatively low angular resolution of 21 cm data. Typically the radio beam is too large to resolve the inner disk velocity gradient. Combining the H I density gradient with the true velocity gradient inside a beam width will most likely lead to underestimate the velocity at a given radius.
H observations always easily reach an angular resolution where any spatial resolution effect can be neglected. A less often commented source of uncertainties though is found in long slit observations, where most of the H data come from. Schommer et al. (1993) was the first large scale publication of rotation curves derived from Fabry-Perot data. They clearly state the inherent advantages of 2D spectroscopy over long slit observations. Beauvais and Bothun (1999, 2001) were among the first to do Fabry-Perot imaging spectroscopy of nearby, large angular size late type spirals for the express purpose of performing precision mass modeling. They detailed the advantages that 2D velocity fields have over 1D slits. Beauvais and Bothun (2001) discussed precision quality rotation curves and optimal rotation curve fitting One can point to the lack of 2D coverage that makes the alignment of the slit crucial to retrieve the real kinematics of a galaxy. First, a photometrically determined inclination can be a major source of uncertainty. Second, missing the kinematical center, which is not always the photometric center (paper II) can lead to an underestimation of the rotational velocities. Also, just a degree or two between the slit and the galaxy position angle for highly inclined galaxies can cause the highest velocity regions along the line of nodes to be missed. This in turn leads to underestimate the rotational velocities. In a series of papers started in 1992 (referenced in Amram et al., 1996), a large sample of rotation curves of nearby galaxies in clusters, derived from Fabry-Perot, have also shown the observational biases avoided when using 3D data cubes instead of long slits data. In addition, the presence of a bar would hardly be noticed in long slit data and its effect would most probably be confounded with the rotational kinematics, while 2D velocity fields allow to disentangle circular from radial motions.
This paper extends our sample of multi-wavelength velocity fields to earlier morphological types by adding six spiral galaxies to the optical rotation curves sample with available 21 cm data. Contrary to dark matter dominated dwarf spirals and to luminous matter dominated early type spirals, the stellar disk and dark halo of intermediate type have comparable contributions to the mass inside the Holmberg radius. Therefore, a slight change of the inner slope of the rotation curve can significantly reduce or increase the disk contribution, whether it is maximal or best–fitted. This change can induce a dramatic difference in the dark matter distribution by increasing or limiting its inner density, as seen in the case of NGC 5585 in Blais-Ouellette et al. (1999). The halo core radius and central density are indeed very sensitive to the exact baryonic contribution at low radii. This is true for halos of all shapes, but more critical for cuspy halos, which often have problem to accommodate for the presence of even a small disk in later type spirals (Blais-Ouellette et al., 2001).
Section 2 briefly describes the sample while section 3 explains the Fabry–Perot observations and data reduction, and presents the main features of each galaxy. Computed H velocity fields and rotation curves are also described therein, and compared to H I rotation curves. Dynamical analysis and mass models will be given in a forthcoming paper (paper IV). Section 4 presents a discussion of the main results and the main conclusions.
2 The sample
Table 1 summarizes the optical parameters of each galaxy in the sample. Neutral hydrogen kinematics and mass models of UGC 2259 and NGC 6946 have been studied by Carignan et al. (1988, 1990) while NGC 2403 and NGC 2841 are part of Begeman’s thesis (1987). All these studies present rotation curves based on 21 cm observations from the Westerbork Synthesis Radio Telescope (WSRT). NGC 5985 is part of the Westerbork H I survey of spiral and irregular galaxiesaaawww.astro.rug.nl/whisp (WHISP, see Swaters et al., 2000). An H I rotation curve derived from these data is presented in this paper, but the details on the H I observations for this galaxy will be published elsewhere. An H I rotation curve of NGC 5055, based on VLA observations, has been published by Thornley and Mundy (1997).
This sample expands the range of morphological types from the very late types of paper II to earlier (Sc to Sb) types. The GHASP surveybbbhttp://www-obs.cnrs-mrs.fr/interferometrie/ghasp.html Garrido et al. (2002), an ongoing Fabry-Perot survey will expand this sample to about 200 spiral galaxies.
3 Fabry–Perot observations: data acquisition and reduction
| Date of observations | September 97, March 98 |
|---|---|
| Telescope | 3.6 m CFHT111NGC 2841 was reobserved at the Observatoire de Haute Provence. See text. |
| Instrumentation: | |
| Instrument | MOSFP |
| CCD detector | 2048 2048, = 8 e-1 |
| Filters: | |
| UGC 2259: | = 6575 Å, = 13 Å |
| NGC 2403: | = 6568 Å, = 12 Å |
| NGC 6946: | = 6566 Å, = 12 Å |
| NGC 5055 blue: | = 6575 Å, = 13 Å |
| red: | = 6586 Å, = 12 Å |
| NGC 2841 blue: | = 6577 Å, = 10 Å |
| red | = 6587 Å, = 11 Å |
| NGC 5985: | = 6621 Å, = 26 Å |
| Fabry–Perot unit | Scanning QW1162 (CFHT1) |
| Calibration lamp | Neon ( = 6598.95 Å) |
| Interference order | 1155 @ |
| Mean Finesse | 12 |
| Duration: | |
| UGC 2259: | 8 min/channel (3.6 h) |
| NGC 2403: | 7.34 min/channel (2.9 h) |
| NGC 6946: | 7.5 min/channel (3.4 h) |
| NGC 5055 blue: | 9.42 min/channel (3.8 h) |
| red: | 6 min /channel (2.7 h) |
| NGC 2841111NGC 2841 was reobserved at the Observatoire de Haute Provence. See text.: | 5 min/channel (2 h) |
| NGC 5985: | 7.7 min/channel (3.1 h) |
| Spatial Parameters | |
| Field size | 8.5′ 8.5′ |
| Pixel scale | 0.44″ pix-1 |
| Spectral parameters | |
| Free spectral range at H | 5.66 Å (258 km s-1) |
| NGC 2403, 5055, 5985: | |
| Number of channels | 24 |
| Sampling | 0.24 Å (10.8 km s-1)/channel |
| UGC 2259 and NGC 6946: | |
| Number of channels | 27 |
| Sampling | 0.21 Å (9.6 km s-1)/channel |
| NGC 2841111NGC 2841 was reobserved at the Observatoire de Haute Provence. See text.: | |
| Free spectral range at H | 8.30 Å (378 km s-1) |
| Number of channels | 24 |
| Sampling | 0.35 Å (15.8 km s-1)/channel |
All the Fabry-Perot observations have been initially made at the Canada–France–Hawaii Telescope (CFHT) in September 97 and March 98 using the CFHT1 high resolution Fabry-Perot etalon installed in the Multi–Object Spectrograph (MOS) focal reducer. A narrow–band filter ( 12 Å), centered around the systemic velocity of the observed object, was placed in front of the etalon. The available field with negligible vignetting was 8.5′ 8.5′ , with 0.44″ pix-1. The free spectral range of 5.66 Å (258 km s-1 ) was scanned in 27 (+1 overlapping) channels for UGC 2259, NGC 6946 and the blue side of NGC 5055 (see section 3.4), giving a sampling of 0.21 Å (9.6 km s-1 ) per channel. For the rest of the sample, the objects were scanned in 24 channels, for a sampling of 0.24 Å (10.8 km s-1 ). Due to the use of an aging filter which has apparently blueshifted from its quoted central wavelength, the fluxes from the receding half of NGC 2841 and NGC 5055 were almost totally blocked, and these galaxies had to be re-observed. The details are given in the relevant sections.
Following normal de–biasing and flat–fielding with standard IRAF procedures, a robust 3-D cosmic–ray removal routine, that tracks cosmic rays by spatial (pixel–to–pixel) and spectral (frame–to–frame) analysis, was applied to every data cube. When necessary, ghost reflections were then removed using the technique described in Paper I. A neon line (6598.95 Å) was used for absolute wavelength calibration at each pixel.
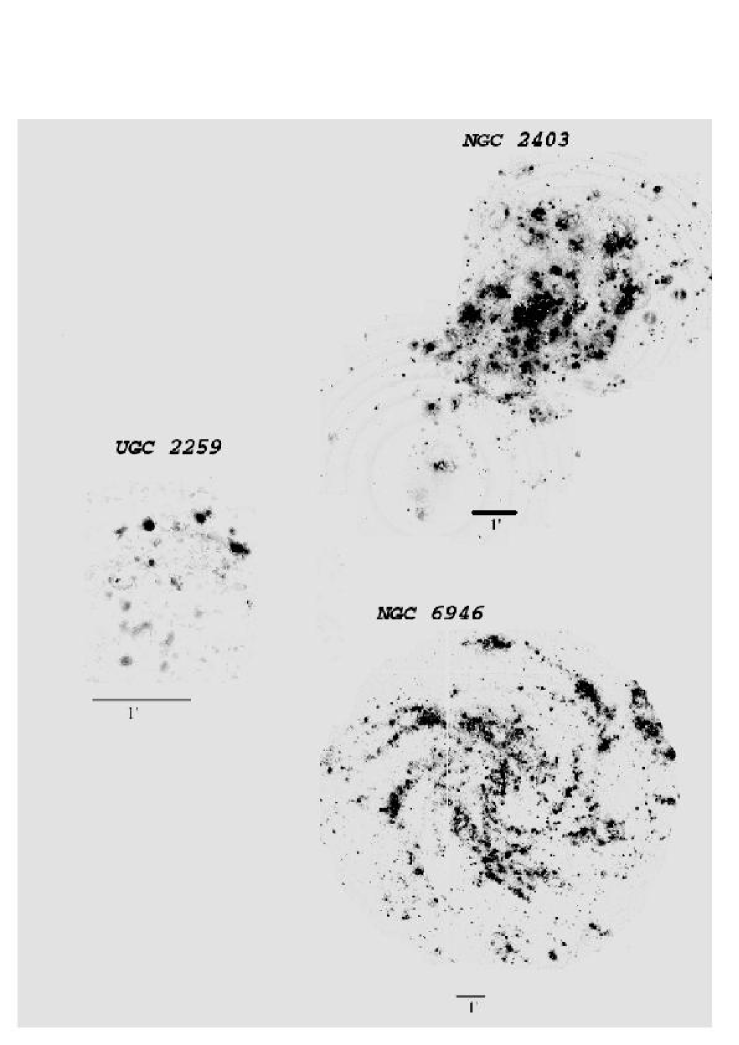
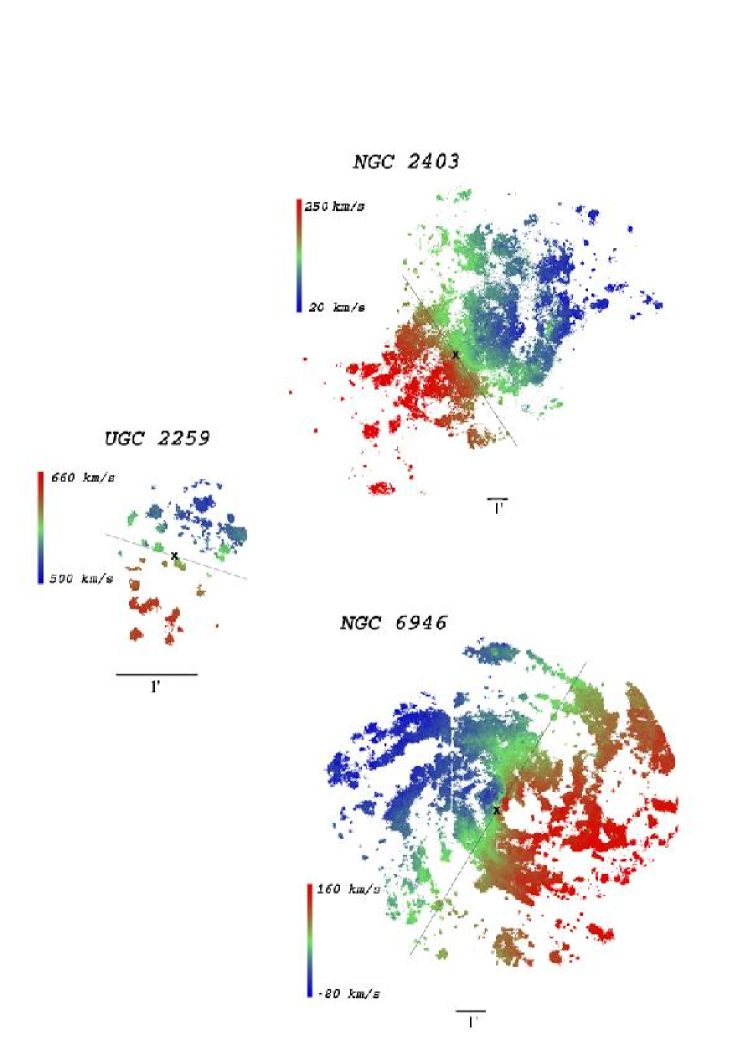
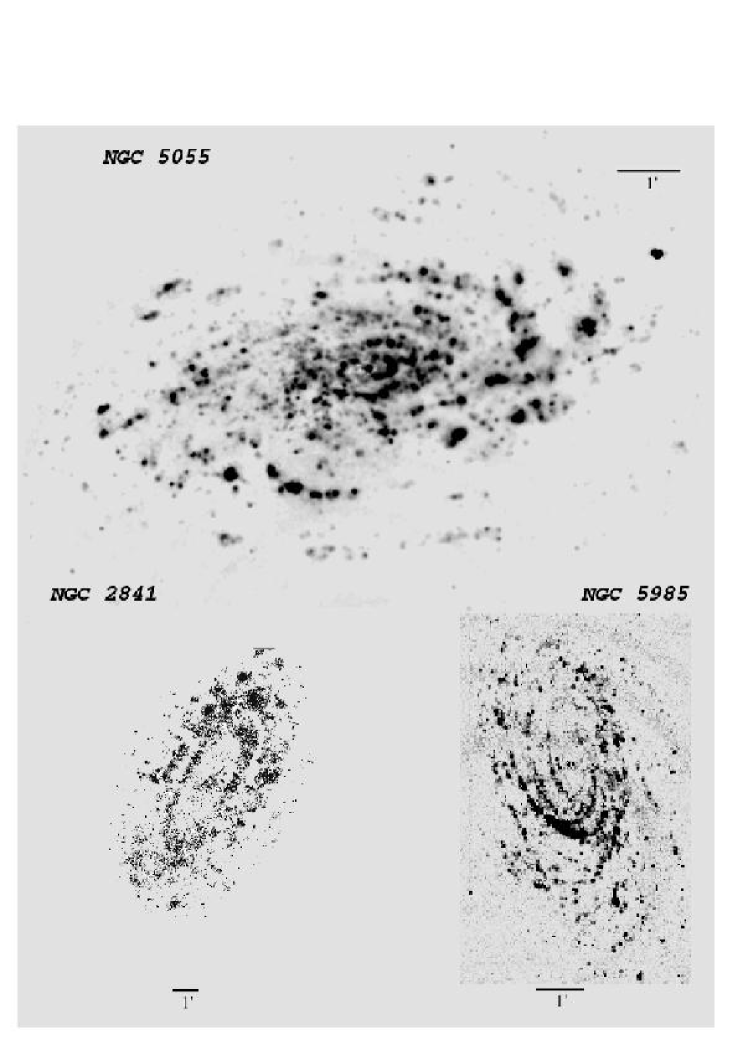
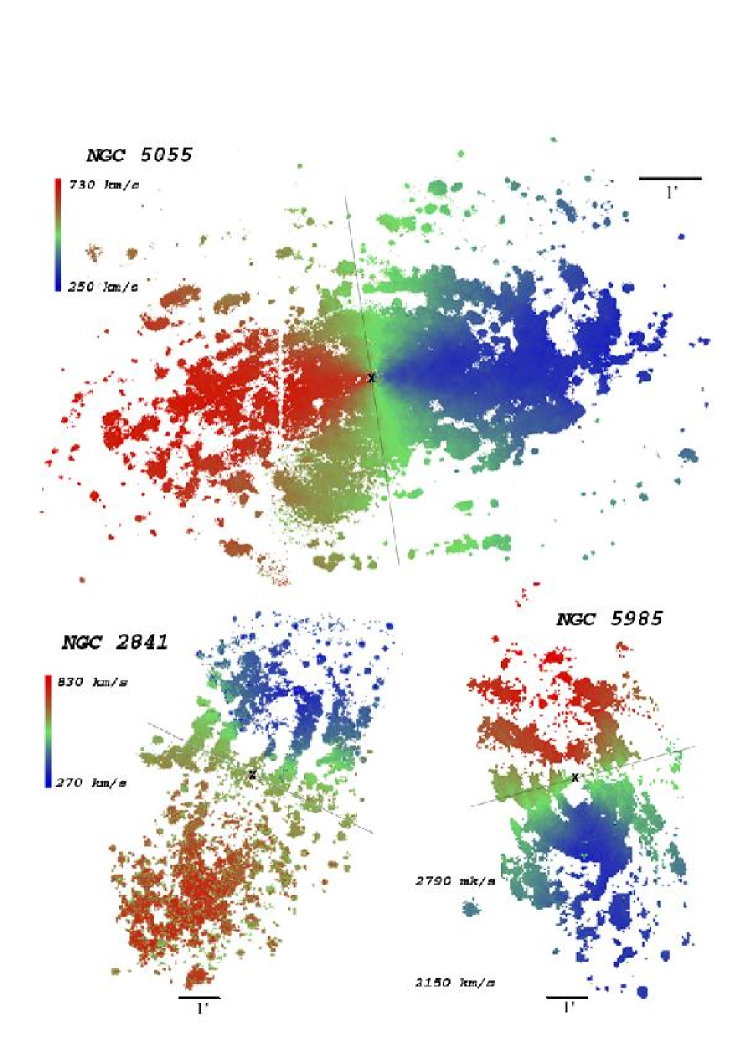
The signal measured along the scanning sequence was split into two parts: (1) an almost constant level produced by the continuum light in a narrow passband around H (hereafter referred to as continuum map) and (2) a varying part produced by the H line (hereafter referred to as H emission line map or monochromatic map). The continuum level was taken to be the mean of the channel which do not contain the line. The H integrated flux map was obtained by integrating the monochromatic profile in each pixel above the threshold defined by the continuum level. The scanning of the interferometer sufficiently samples the PSF of the instrument (the Airy function convolved by the surface and transmission defects) and covers the free spectral range through 24 to 27 scanning steps. When the profiles are structureless and the S/N high, the lines could be successfully fitted by the convolution of the observed PSF (given by the narrow Neon-6598.95nm emission line) and a single Gaussian function. When the profile is more complex, multiple Gaussian components are needed. Nevertheless, since the number of scanning steps and the baseline of the continuum emission are relatively low, and the structure of the profile is often complex (asymmetries, multiple components, low S/N), we do not fit a function to the profile to extract the first order momentum. Instead, the heliocentric radial velocity for a given pixel is directly given by the position of the barycentre of the line. Furthermore, we do not have to make assumptions on the fit used when the data are dominated by Poisson’ or receptor’ noise at low S/N levels. However, at high S/N, since we have a good knowledge of the PSF, the barycentre of the emission line profile may be measured with an accuracy much better than the sampling step, hence giving a precision of about 3 km/s for a S/N=5. For each pixel, the S/N level is given by the y-axis of the barycentre of the line normalized by the r.m.s of the continuum. When the S/N of each individual pixel was not high enough to derive a radial velocity, two different Gaussian smoothings were performed on the cubes ( and 4″) in order to get sufficient signal–to–noise throughout the images. Three velocity maps (one for each smoothed cube and for the original) were then obtained from the intensity weighted means of the H peaks at each pixel. A final variable resolution velocity map was constructed keeping higher resolution where the signal-to-noise makes it possible. Figs. 1 and 3 show the monochromatic images of the galaxies while Figs. 2 and 4 display their velocity fieldscccAll the velocity maps are available at www.astro.caltech.edu/∼sbo/vf.html. Table 2 lists the main observing parameters.
Rotation curves were derived using two different methods: velocity dispersion minimization (tilted-ring model: Begeman, 1987; Côté et al., 1991) and rotation curve symmetry optimization by comparing the approaching and receding sides. The first method is more precise and allow to model a warp disk, while the second is more robust and is useful for galaxies with low S/N and patchy velocity coverage. In all cases all the parameters (systemic velocity, kinematical center, inclination, and position angle) were initially free to vary.
To date, no convention on the way to represent the errors on rotation curves exists in the literature. Error bars are often simply given as the velocity dispersion in the ring used at each radius. However, the warm gas tends to be found in more disturbed environments than the cold gas. Turbulence, local density variations (like spiral arms) and winds from stars and supernovae of the young stellar forming regions in which the gas is ionized, increase its dispersion. This can lead to the paradox where fewer points (as in long–slit observations)lead to lower dispersion and to smaller error bars. As a more direct probe of the uncertainties on the measured potential, the difference between the two sides of the galaxy is instead sometimes used. Some authors add the error due to uncertainties on inclination and/or position angles.

Since the purpose of this study is to present the data in an unbiased way, the sources of errors are given separately. The error bar itself gives the error on the mean in each ring () while the solutions for each side of the galaxy are represented by continuous lines for the receding side and dashed lines for the approaching. Errors due to inclination uncertainties are given by where is around 2 for all the galaxies. Other parameters (Table 1) have low uncertainties and contribute marginally to the velocity error budget.

3.1 UGC 2259
This small galaxy was observed in September 97 by a fairly photometric night. Eight minutes integration were spent at each channel position and no photometric corrections were needed.
Like in the case of IC 2574 (paper II), dispersion minimizing methods as in ROCUR are hardly applicable to determine the rotation curve because of the incomplete coverage of the velocity field. The rotation curve was thus found by comparison of the two sides of the galaxy and analysis of the residual velocity field using the ADHOC packagedddhttp://www.oamp.fr/adhoc/adhoc.html. The inclination, position angle and systemic velocity were fixed at 41°, 158° and 581 km s-1 , in fairly good agreement with Carignan et al. (1988). The H coverage of the field is patchy and mainly concentrated in the center and in the two spiral arms. The net effect is to have only the receding side covering the innermost part of the rotation curve. However, because the two sides cover the outer parts and agree fairly well, this lack of coverage should only affect the determination of the kinematical center, adding some uncertainty to the rotation curve. The resulting optical rotation curve at 2.6″ resolution is given in Table 4 while Fig. 5 presents it in combination with the H I rotation curve.
As one can see in Fig.2, only a few clumps of ionized gas reveal the very inner kinematics of the galaxy. The solid body rise can now be observed within a few hundreds of parsecs on the receding side. The H curve is higher than the H I by 5 to 10 km s-1 up to a radius of 50″. Even if this is an indication of the presence of beam smearing in the uncorrected H I observations, we cannot exclude non-circular motions due to the lack of coverage.
The most prominent feature of the H rotation curve is the big dip around 60″. This is not observed in the H I curve. It can be seen in the velocity field that the location of this feature corresponds to the two great spiral arms, clearly identified in the optical image (see e.g. Carignan et al., 1988). Spiral arms are known to create such effect, especially on the ionized gas (e.g. Thornley and Mundy, 1997).
Fabry-Perot observations of UGC 2259 by Gonzalez-Serrano and Valentijn (1991) using the brightest H II regions and the new data are consistent within the error bars.
In conclusion, even if the kinematical parameters derived for UGC 2259 reach a reasonable level of confidence, the asymmetric distribution of H emission and the relatively low covering factor weaken this galaxy contribution as a test case.
3.2 NGC 2403
The object being larger than the available field, two data cubes were acquired during the run of March 98. The same parameters were used for both fields and 440 seconds were spent on each of the 24 channels of each data cube. After the standard data reduction, the final maps (velocity, continuum and monochromatic) were joined using stars in the overlapping region. The coverage of the field was this time complete enough to use ROCUR with bins of 20 arcsec. However, since no significant variations of inclination or position angle were found, ADHOC was used to get a higher sampling. The inclination was found to be 61°, the position angle 126°and the systemic velocity 137 km s-1 , at 3 km s-1 of Begeman’s value. The shape of the rotation curve is independent of the resolution used and bins of 5 pixels (6.6 ″) offer the clearest picture. Fig. 6 shows the final rotation curve. The H I curve is also plotted for comparison. The Fabry–Perot data show a remarkable agreement between the approaching and receding sides up to 200″. At a greater radius, the number of points on the receding side drops sharply (see Table 5) and the curve then relies mainly on the approaching side.

The inner limit of the big external arm is located around 200″ and the effect of the arm can clearly be seen on both sides of the rotation curve. The full resolution velocity map gives an even clearer picture as it shows the effect of the arm at different galactic longitudes. The south–eastern arm is less obvious on the monochromatic image and seems dominated by a few giant H II regions. This explains the bumpy appearance of the receding curve above 200″ where each H II region produces a bump and increase the dispersion. Only the approaching side is seen above 470″ and relies only on a few H II regions.
3.3 NGC 6946
The central part of this bright Scd galaxy suffers from a lack of H emission. Despite the 3.5 hours of observation that otherwise gave the sensitivity to reach down to the smaller H II region and the diffuse ionized gas, few H photons were collected up to 50″ in radius. The velocity dispersion is high in that region and makes the true kinematics hard to retrieve. This appears clearly in the rotation curve presented in Fig. 7 and in Table 6.
Between 70″ and 100″, the rotation curves on both sides are smooth but present a big asymmetry, indicative of non circular motions, most probably gas movement along a central bar (Bonnarel et al., 1988). The presence of dust (Roussel et al., 2001) explains the lack of H emission and is compatible with a mild starburst occurring at the center. This starburst is likely to play a role in the high velocities observed near the center, considering that the relatively low mass of the molecular gas, a few percent of the stellar mass (Israel and Baas, 2001), could not explain such high rotational velocities in the inner part.
The rest of the rotation curve (resolution of 4.4″) matches the H I curve. The systemic velocity is found to be 47 km s-1 in agreement with Carignan et al. (1990) but not consistent with the 38 km s-1 found by Bonnarel et al. (1988). However, the inclination and position angles are less constrained due to the uncertainties caused by the global asymmetry. They are compatible with both Bonnarel (i = 32°and PA = 58°) and Carignan et al. (i = 38°and PA = 60°). They were fixed to the latter for ease of comparison. It has to be noted that the uncertainty on the inclination can affect the velocities dramatically (as ). For example, Sofue (1996) uses an optically determined inclination of 30° in conjunction with his CO data along the major axis and ends up with velocities 20% higher. That recalls the importance of having a complete 2-D coverage to allow an independent determination of optical parameters.
3.4 NGC 5055

This object was first observed in March 98 but the interference filter used had blueshifted as explained in section 3. To complete the data set, it has been observed again in April 99 using a redder filter. Both sets of data were analyzed following the standard procedure and two full resolution data cube were produced. They have then been combined using field stars and their spectral zero point matched with high accuracy in overlapping regions.
For the majority of bright galaxies where the kinematics have been investigated in detail, the optical and dynamical centers do coincide (Begeman, 1987). For some late-type barred galaxies the shifts between both center determinations could be larger than 1 kpc (e.g. (e.g. de Vaucouleurs and Freeman, 1972; Beauvais and Bothun, 2001; Weldrake et al., 2003). For low surface brightness galaxies, due do their faintness, the determination of the morphological center could in itself be a problem, nevertheless de Blok et al. (2003) conclude that the offsets between optical and dynamical centers are small. We have tested for NGC 5055 the influence of a “kinematic sloshing of the center of mass” on the spatial scale of 500 pc and we conclude that whether inclination and position angles were kept fixed at the value derived by Thornley and Mundy (1997) or let free to vary (in which case the averages are 64° and 99°), the H rotation curve (Fig. 8 and 7) ranges systematically from 2 to 11 km s-1 above the H I curve. This fact is hard to understand especially in view of the otherwise general good agreement between the two curves. Pismis et al. (1995) published a long–slit based rotation curve that tends to be slightly lower than the present Fabry-Perot curve. However, because of its limit in radius (70″), it is hardly reliable to solve the discrepancy. In an early paper, van der Kruit and Bosma (1978) derived an optical rotation curve from the inner 60 arcsec regions of NGC 5055. Taking into account the difference of inclination the agreement with our rotation curve is reasonable.
Two important differences exist between the H I and H curves. First, the central H points are up to 30 km s-1 higher than their H I counterparts. Second, it can be noticed that the amplitude of the velocity variations due to the passage of the spiral arms (at radii around 60 ″ and 120″) are much more pronounced in the H data than in H I . The velocity difference can be in part naturally associated with beam smearing in the 21 cm observations. However, its amplitude, the strength of the response to arm, and especially the difference between approaching and receding sides show an important component of streaming motion, in agreement with the finding of Thornley and Mundy (1997). Averaging velocities from both sides helps removing the effect of this non-circular motion and retrieving the equivalent rotational kinematics. Nonetheless, this galaxy is a good illustration of the ionized gas sensitivity to its environment, due to the short time scale of kinematic feedback from star formation processes.
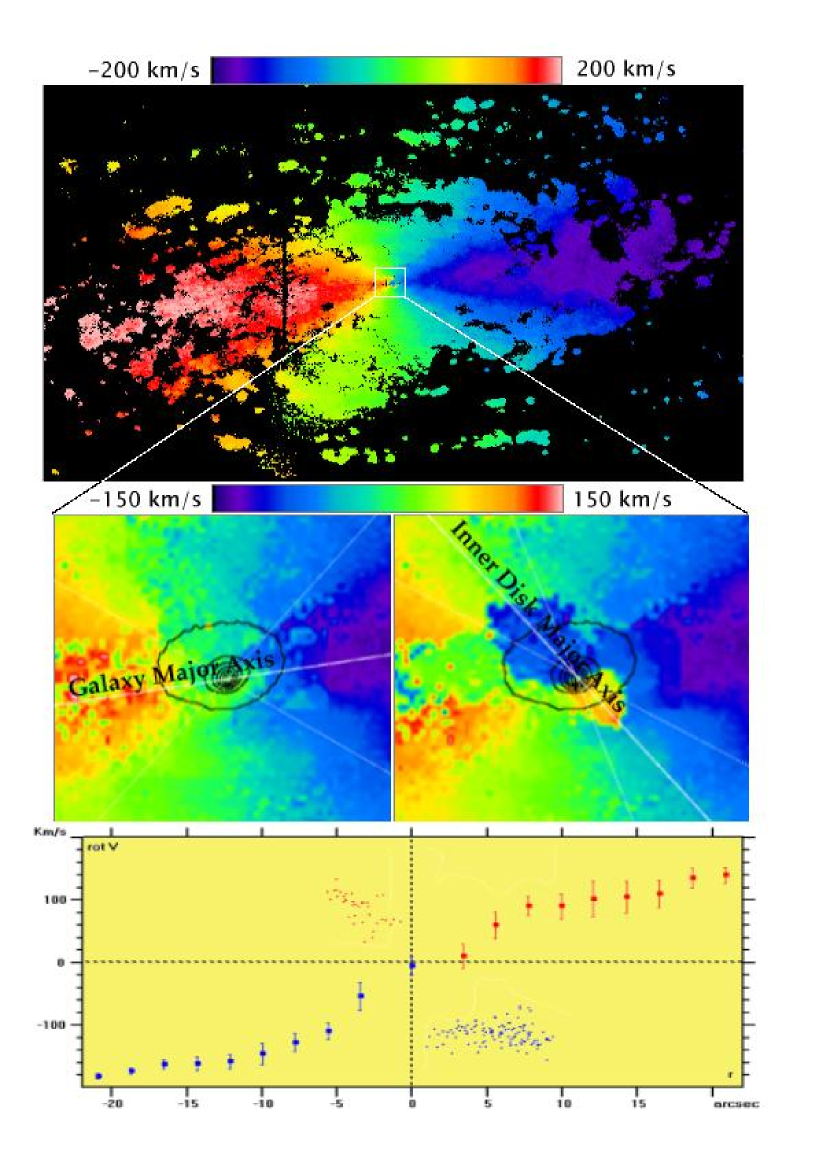
The arcsec region around the center of this galaxy is very peculiar and will be termed ”the central region”. At the adopted distance of 9.2 Mpc, the linear extension is pc. This dense central region is roughly 6 times brighter in the continuum than the nearby surrounding region and about 25 times in the H line. An important fraction of the pixels of this central region shows two emission lines. When separated in two velocity components (fig. 9) two drastically different velocity patterns appear. One pattern shows slightly disturbed kinematics, but still consistent with the global disk kinematics. The second component shows two regions of high peculiar velocities compatible with an almost counter-rotating disk or with a bipolar outflow. In case of a disk, its position angle is 220°, 121° from the galaxy major axis. The disk inclination can hardly be retrieve due to the small region with clear nuclear emission line. Peculiar spectral features seems to affect a region extending to around 18″, but they are mostly buried in the main disk component. Because of this extent, inclination is most probably lower than 70°, and V km s-1 up to 300 pc. The systemic velocity is 10 km s-1 lower than the galaxy systemic velocity, a difference similar to the velocity error bars. These velocities lead to a M ⊙ inside 300 pc.
However, the quasi constant velocities throughout this component, and the much brighter blue side, are more consistent with a bipolar outflow. Pismis et al. (1995) already interpreted a departure from pure rotation on the blue side as such. Their long slit data did not allow the detection of the red component, but they probably detected the bright blue clump north-east of the center. However, Afanasiev and Sil’chenko (2002) note that a south-west anomaly (our red clump) is also present in their stellar velocities, a rather puzzling fact if the outflow interpretation is retained.
3.5 NGC 2841

First observed at CFHT with the same blueshifted filter as NGC 5055, this galaxy was reobserved in December 2001 at the Observatoire de Haute-Provence (France) in the context of the GHASP survey. The instrumentation used at the OHP is very similar to the one used at the CFHT with the exception that the detector was a photon counting system instead of a CCD. Because photon counting cameras have intrinsically no read-out noise, it is possible to rapidly scan through the 24 channels several times, averaging photometric variations of the sky. It is then easier to remove night sky emission lines and background light (Amram et al., 1995). The filter used at the OHP was matched to the receding side of the galaxy. Joining the two velocity fields using stars in the field, a complete coverage was achieved. Despite filters well matched to the galaxy velocities, we confirm the overall low H luminosity already noted by Kennicutt (1988). NGC 2841 is one of the coldest galaxies in the entire IRAS survey having a 60/100 ratio as low as M31, another galaxy greatly deficient in H-alpha. Data from 2MASS show normal effective colors with J-H = 0.71 and H-K = 0.23 implying a normal visible extinction, thus an intrinsic weak H emission.
Using either a tilted ring model or by matching the two sides of the galaxy with radially constant values of inclination and position angle, we found an inclination of 66°, a position angle of 150° , and a systemic velocity of 633 km s-1 , virtually identical to the values found by Begeman inside a radius of 180″. The kinematical center was found to be centered on the bright nucleus. The final H curve (Tab. 10 and Tab. 8) is based on a Gaussian smoothed ( 3″) version of the velocity field.
Despite the very similar orientation parameters, the H velocities stay up to 26 km s-1 below the beam smearing corrected H I data in the inner part of the galaxy. Due to the low radio resolution (32″) and the steepness of the rotation curve, it is conceivable that the first H I points have been over-corrected for beam smearing.
3.6 NGC 5985

This massive galaxy was observed with a wider filter (19Å) but centered 3Å bluer than the galaxy central wavelength. That, in conjunction with the high rotational velocity, prevented the reddest flux to reach the CCD. The velocity field is thus slightly incomplete on the receding side but a complete and reliable rotation curve can be derived using data away from the major axis. There is therefore no cut-off in rotation velocity but instead, an added uncertainty throughout the velocity plateau due to the lack of purely radially moving gas. The H rotation curve was retrieved matching the two sides of the galaxy. The inclination and position angles were found to be respectively 58° and 15°.
For this galaxy an HI rotation curve has been derived from the WHISPeeewww.astro.rug.nl/whisp data. The general procedures for the observations and reduction of the WHISP data are presented in Swaters et al. (2000), but details for this particular galaxy will be published in a future paper. The velocity field for NGC 5985 was derived by fitting Gaussians to the line profiles. Then, from a tilted-ring fit to the velocity field derived from the HI observations we found that the inclination varies little and ranges between 62° and 58°, and that the rotatio angle is nearly constant at 15°. We therefore fixed the inclination at 60° and the position angle at 15°, very close to their H counterparts.
Note that because of the lack of H I in the center, no H I rotation curve can be derived there. This shows the complementarity between H and H I observations. Not only the former have higher resolution, thus reducing the problems associated with beam smearing, but also it may trace the rotation curve in regions where no H I has been detected.
4 Summary and Conclusions
It is well known that H I observations are commonly affected by beam smearing. The present data set is well suited to illustrate this fact. A useful test to estimate the reliability of H I observations is to compare the size of the radio beam width to the size of the galaxy. Bosma (1978) introduced the ratio /S where is the Holmberg radius and S is the radio beam major axis width. A more surface brightness independent ratio was introduced by van den Bosch et al. (2000): /S where is the B–band stellar disk scale length. Table 3 compares those two ratios to the maximum difference between the H and the H I on the rising part of the rotation curves.
NGC 5055, which shows the largest and , also has the largest . Looking at Fig. 8, the effect of beam smearing seems clearly visible in the inner 2 kpc. For the galaxy with the second largest , NGC 2403, the beam smearing corrections of Begeman (1987) seem to work fine since there is a very good agreement ( km s-1 ) between the H I and the H observations. However, for NGC 2841, it appears that the H I velocities were overcorrected for beam smearing by Begeman (1987). The results for those two galaxies show the difficulties related to beam smearing correction, and that high resolution data are still the best way to get the proper kinematics in the inner parts.
Not much can be said on the possible beam smearing effects for the 3 other galaxies since UGC 2259 has no H in the center, NGC 5985 has no H I and NGC 6946 has a too high velocity dispersion which could be due to the presence of a bar. As was pointed out by Swaters (1999a), the magnitude of beam smearing does not only depends on the size of the beam, but also on details of the galaxy, such as its inclination, HI distribution and kinematics.
| Galaxy name | Beam width (S) | |||
| ″ | km s-1 | |||
| UGC 2259 | 13.2 | 5.2 | 1.29 | 7.8 |
| NGC 2403 | 26 | 26 | 4.62 | 6.5 |
| NGC 6946 | 24.5 | 19 | 4.70 | 16.8 |
| NGC 5055 | 12.8 | 46 | 8.51 | 23.9 |
| NGC 2841fffH I corrected for beam smearing | 25 | 15 | 2.08 | -34.0 |
| NGC 5985 | 30 | 5.3 | 1 | 10gggNo H I data for the inner part |
Amid the uncertainties that can affect rotation curves, non-circular motions like bars and local phenomena such as expanding bubbles or spiral arms can be a major source of error. Classical 1-D spectroscopy at any wavelength, while reaching a sufficient resolution, cannot easily deal with these problems. On the other hand, these phenomena can be efficiently tracked by the 2-D spectroscopic coverage from Fabry-Perot data (see also Schommer et al., 1993, for a similar conclusion in the context of distance indicators). Depending on their orientation, bars can change the radial velocities in the inner parts of galaxies. Their signature may however be seen in the velocity field as a regular deviation from the typical projected circular velocities. None of the SB or SAB in our sample shows signs of these deviations though some of them have very low signal to noise in the center (UGC 2259 and NGC 5985) or very high velocity dispersion (NGC 6946). NGC 5055 shows strong activity inside 300 pc which can be interpreted either has an almost counter-rotating disk hosting a ⊙ object, or as a bipolar outflow. Gas kinematics alone tend to favor the bipolar outflow but peculiar stellar velocities in Afanasiev and Sil’chenko (2002) data would be more consistent with a rotating disk.
Complete 2-D velocity fields also allow independent determinations of inclination and position angles, kinematical centers and systemic velocities. This is a major gain over 1-D spectroscopy considering the sensitivity of the rotation curves to these parameters.
Acknowledgements.
We warmly thank Jacques Boulesteix for his software and for fruitful discussions on Fabry-Perot data reduction, and the staff of the CFHT for their support during the Fabry-Perot data acquisition. We are indebted to Stéphanie Côté for the opportunity to re-observe NGC 5055 and to Olivier Hernandez who helped with the reduction of the NGC 2841 data. CC acknowledges grants from NSERC (Canada) and FQRNT (Québec).References
- Afanasiev and Sil’chenko (2002) Afanasiev, V. L. and Sil’chenko, O. K., 2002, A&A 388, 461
- Amram et al. (1996) Amram, P., Balkowski, C., Boulesteix, J., Cayatte, V., Marcelin, M., and Sullivan, III, W., 1996, A&A 310, 737
- Amram et al. (1995) Amram, P., Boulesteix, J., Marcelin, M., Balkowski, C., Cayatte, V., and Sullivan, W., 1995, A&AS 113, 35
- Beauvais and Bothun (2001) Beauvais, C. and Bothun, G., 2001, ApJSS 136, 41
- Begeman (1987) Begeman, K., 1987, Ph.D. thesis, Rijksuniversiteit Groningen
- Blais-Ouellette et al. (2001) Blais-Ouellette, S. ., Amram, P., and Carignan, C., 2001, AJ 121, 1952, (Paper II)
- Blais-Ouellette et al. (1999) Blais-Ouellette, S., Carignan, C., Amram, P., and Côté, S., 1999, AJ 118, 2123, (Paper I)
- Bonnarel et al. (1988) Bonnarel, F., Boulesteix, J., Georgelin, Y. P., Lecoarer, E., Marcelin, M., Bacon, R., and Monnet, G., 1988, A&A 189, 59
- Bosma (1978) Bosma, A., 1978, Ph.D. thesis, Rijksuniversiteit Groningen
- Carignan et al. (1990) Carignan, C., Charbonneau, P., Boulanger, F., and Viallefond, F., 1990, A&A 234, 43
- Carignan et al. (1988) Carignan, C., Sancisi, R., and Van Albada, T. S., 1988, AJ 95, 37
- Côté et al. (1991) Côté, S., Carignan, C., and Sancisi, R., 1991, AJ 102, 904
- de Blok et al. (2003) de Blok, W. J. G., Bosma, A., and McGaugh, S., 2003, MNRAS 340, 657
- de Vaucouleurs and Freeman (1972) de Vaucouleurs, G. and Freeman, K. C., 1972, Vistas in Astronomy 14, 163
- Freedman (1990) Freedman, W. L., 1990, ApJ 355, L35
- Garrido et al. (2002) Garrido, O., Marcelin, M., Amram, P., and Boulesteix, J., 2002, A&A 387, 821
- Gonzalez-Serrano and Valentijn (1991) Gonzalez-Serrano, J. I. and Valentijn, E. A., 1991, A&A 242, 334
- Israel and Baas (2001) Israel, F. P. and Baas, F., 2001, A&A 371, 433
- Kennicutt (1988) Kennicutt, R. C., 1988, ApJ 334, 144
- Macri et al. (2001) Macri, L. M., Stetson, P. B., Bothun, G. D., Freedman, W. L., Garnavich, P. M., Jha, S., Madore, B. F., and Richmond, M. W., 2001, ApJ 559, 243
- Moore et al. (1999) Moore, B., Ghigna, S., Governato, F., Lake, G., Quinn, T., Stadel, J., and Tozzi, P., 1999, ApJ 524, L19
- Moore et al. (1998) Moore, B., Governato, F., Quinn, T., Stadel, J., and Lake, G., 1998, ApJ 499, L5
- Navarro et al. (1996) Navarro, J. F., Frenk, C. S., and White, S. D. M., 1996, ApJ 462, 563
- Navarro et al. (1997) Navarro, J. F., Frenk, C. S., and White, S. D. M., 1997, ApJ 490, 493
- Navarro et al. (2003) Navarro, J. F., Hayashi, E., Power, C., Jenkins, A., Frenk, C., White, S., Springel, V., Stadel, J., and Quinn, T., 2003, The Inner Structure of LambdaCDM Halos III: Universality and Asymptotic Slopes, astro-ph/0311231
- Pismis et al. (1995) Pismis, P., Mampaso, A., Manteiga, M., Recillas, E., and Cruz Gonzalez, G., 1995, AJ 109, 140
- Roussel et al. (2001) Roussel, H., Vigroux, L., Bosma, A., Sauvage, M., Bonoli, C., Gallais, P., Hawarden, T., Lequeux, J., Madden, S., and Mazzei, P., 2001, A&A 369, 473
- Schommer et al. (1993) Schommer, R. A., Bothun, G. D., Williams, T. B., and Mould, J. R., 1993, AJ 105, 97
- Sharina et al. (1997) Sharina, M. E., Karachentsev, I. D., and Tikhonov, N. A., 1997, Pis ma Astronomicheskii Zhurnal 23, 430
- Sofue (1996) Sofue, Y., 1996, ApJ 458, 120
- Sofue et al. (1999) Sofue, Y., Tutui, Y., Honma, M., Tomita, A., Takamiya, T., Koda, J., and Takeda, Y., 1999, ApJ 523, 136
- Swaters (1999a) Swaters, R., 1999a, in ASP Conf. Ser. 182: Galaxy Dynamics - A Rutgers Symposium, p. 369
- Swaters (1999b) Swaters, R., 1999b, Ph.D. thesis, Rijksuniversiteit Groningen
- Swaters et al. (2000) Swaters, R. A., Madore, B. F., and Trewhella, M., 2000, ApJ 531, L107
- Swaters et al. (2003) Swaters, R. A., Madore, B. F., van den Bosch, F. C., and Balcells, M., 2003, ApJ 583, 732
- Thornley and Mundy (1997) Thornley, M. D. and Mundy, L. G., 1997, ApJ 484, 202
- van den Bosch et al. (2000) van den Bosch, F. C., Robertson, B. E., Dalcanton, J. J., and de Blok, W. J. G., 2000, AJ 119, 1579
- van der Kruit and Bosma (1978) van der Kruit, P. C. and Bosma, A., 1978, A&AS 34, 259
- Weldrake et al. (2003) Weldrake, D. T. F., de Blok, W. J. G., and Walter, F., 2003, MNRAS 340, 12
Appendix A Rotation Curves
| R | Napp | Vapp | Nrec | Vrec | V | ||
|---|---|---|---|---|---|---|---|
| arcsec | km s-1 | km s-1 | km s-1 | km s-1 | km s-1 | ||
| 1.4 | 5 | 0 | 28 | 0 12 | |||
| 3.8 | 15 | 16 | 9 | 16 2 | |||
| 6.4 | 17 | 28 | 13 | 28 3 | |||
| 9.3 | 7 | 35 | 9 | 35 3 | |||
| 11.6 | 15 | 45 | 15 | 45 4 | |||
| 13.7 | 2 | 80 | 8 | 80 5 | |||
| 17.4 | 14 | 55 | 5 | 55 1 | |||
| 19.8 | 18 | 63 | 8 | 63 2 | |||
| 22.8 | 16 | 64 | 10 | 64 2 | |||
| 24.9 | 14 | 66 | 10 | 66 3 | |||
| 28.0 | 41 | 68 | 12 | 68 2 | |||
| 30.4 | 79 | 66 | 13 | 66 1 | |||
| 33.2 | 80 | 74 | 14 | 6 | 73 | 10 | 74 2 |
| 35.6 | 51 | 73 | 11 | 23 | 72 | 8 | 72 2 |
| 38.4 | 57 | 78 | 12 | 53 | 72 | 6 | 75 1 |
| 40.9 | 72 | 79 | 14 | 59 | 78 | 8 | 79 1 |
| 43.6 | 92 | 80 | 13 | 74 | 80 | 9 | 80 1 |
| 46.2 | 84 | 82 | 11 | 73 | 82 | 8 | 82 1 |
| 48.9 | 65 | 83 | 9 | 51 | 87 | 5 | 85 1 |
| 51.4 | 46 | 84 | 14 | 38 | 84 | 8 | 84 2 |
| 54.0 | 45 | 86 | 14 | 24 | 79 | 10 | 84 2 |
| 56.7 | 35 | 85 | 10 | 12 | 76 | 9 | 83 2 |
| 59.4 | 25 | 74 | 12 | 13 | 68 | 6 | 72 2 |
| 61.9 | 19 | 71 | 8 | 38 | 69 | 5 | 69 1 |
| 64.3 | 7 | 75 | 5 | 41 | 69 | 6 | 70 1 |
| 67.3 | 28 | 75 | 15 | 75 3 | |||
| 69.4 | 15 | 76 | 16 | 76 4 |
| R | Napp | Vapp | Nrec | Vrec | V | ||
|---|---|---|---|---|---|---|---|
| arcsec | km s-1 | km s-1 | km s-1 | km s-1 | km s-1 | ||
| 10.3 | 49 | 29 | 13 | 48 | 21 | 9 | 25 2 |
| 16.7 | 79 | 41 | 14 | 79 | 32 | 11 | 36 1 |
| 23.2 | 116 | 45 | 15 | 116 | 43 | 15 | 44 1 |
| 29.96 | 148 | 55 | 16 | 148 | 52 | 14 | 53 1 |
| 36.4 | 178 | 67 | 18 | 179 | 56 | 15 | 62 1 |
| 43.0 | 209 | 68 | 22 | 209 | 65 | 15 | 67 1 |
| 49.6 | 251 | 75 | 23 | 251 | 72 | 16 | 73 1 |
| 56.2 | 274 | 78 | 23 | 274 | 73 | 19 | 76 1 |
| 62.8 | 312 | 77 | 21 | 312 | 76 | 20 | 76 1 |
| 69.4 | 342 | 79 | 19 | 342 | 77 | 18 | 78 1 |
| 76.0 | 361 | 83 | 17 | 375 | 78 | 14 | 80 1 |
| 83.0 | 379 | 88 | 20 | 408 | 82 | 15 | 85 1 |
| 89.1 | 425 | 91 | 19 | 441 | 86 | 15 | 88 1 |
| 95.7 | 451 | 91 | 21 | 471 | 87 | 15 | 89 1 |
| 102.3 | 479 | 94 | 15 | 506 | 90 | 18 | 92 1 |
| 108.9 | 538 | 98 | 21 | 540 | 93 | 19 | 95 1 |
| 115.5 | 576 | 97 | 21 | 574 | 93 | 19 | 95 1 |
| 122.1 | 600 | 98 | 22 | 583 | 95 | 21 | 97 1 |
| 128.7 | 629 | 102 | 19 | 598 | 97 | 22 | 99 1 |
| 135.4 | 659 | 104 | 20 | 627 | 97 | 22 | 101 1 |
| 141.9 | 695 | 103 | 19 | 651 | 96 | 19 | 100 1 |
| 148.5 | 728 | 102 | 20 | 634 | 97 | 18 | 100 1 |
| 155.1 | 762 | 100 | 20 | 610 | 100 | 16 | 100 1 |
| 161.8 | 788 | 98 | 21 | 667 | 100 | 18 | 99 1 |
| 168.3 | 806 | 98 | 20 | 711 | 102 | 19 | 100 1 |
| 174.9 | 852 | 99 | 21 | 766 | 101 | 19 | 100 1 |
| 181.5 | 870 | 98 | 20 | 779 | 103 | 18 | 100 1 |
| 188.1 | 926 | 97 | 23 | 753 | 107 | 19 | 101 1 |
| 194.7 | 918 | 98 | 23 | 690 | 108 | 22 | 102 1 |
| 201.3 | 948 | 99 | 28 | 698 | 111 | 22 | 104 1 |
| 207.9 | 949 | 98 | 30 | 661 | 111 | 20 | 103 1 |
| 214.5 | 1010 | 98 | 30 | 656 | 111 | 20 | 103 1 |
| 221.1 | 1069 | 101 | 28 | 644 | 112 | 22 | 105 1 |
| 227.6 | 1084 | 106 | 23 | 600 | 115 | 21 | 109 1 |
| 234.3 | 1076 | 109 | 24 | 510 | 118 | 22 | 112 1 |
| 240.9 | 1150 | 111 | 23 | 462 | 124 | 21 | 114 1 |
| 247.4 | 1204 | 112 | 26 | 321 | 132 | 25 | 116 1 |
| 254.0 | 1133 | 116 | 28 | 304 | 136 | 21 | 120 1 |
| 260.7 | 1089 | 116 | 30 | 291 | 135 | 20 | 120 1 |
| 267.2 | 1058 | 115 | 30 | 236 | 128 | 20 | 118 1 |
| 273.9 | 1127 | 114 | 31 | 163 | 127 | 24 | 115 1 |
| 280.6 | 1130 | 112 | 30 | 158 | 127 | 23 | 114 1 |
| 287.1 | 1032 | 110 | 27 | 202 | 118 | 21 | 112 1 |
| 293.6 | 1009 | 107 | 24 | 182 | 114 | 18 | 108 1 |
| 300.1 | 1085 | 110 | 23 | 208 | 118 | 18 | 111 1 |
| 306.9 | 1043 | 113 | 24 | 264 | 121 | 15 | 115 1 |
| 313.4 | 935 | 115 | 25 | 240 | 119 | 16 | 115 1 |
| 320.1 | 1015 | 118 | 26 | 269 | 118 | 16 | 118 1 |
| 326.7 | 1068 | 118 | 24 | 202 | 117 | 12 | 118 1 |
| 333.3 | 1076 | 121 | 23 | 232 | 121 | 14 | 121 1 |
| 339.8 | 833 | 122 | 25 | 201 | 124 | 12 | 123 1 |
| 346.5 | 776 | 121 | 25 | 176 | 123 | 12 | 122 1 |
| 353.1 | 853 | 120 | 24 | 159 | 124 | 18 | 120 1 |
| 359.7 | 834 | 119 | 20 | 160 | 127 | 11 | 120 1 |
| 366.3 | 789 | 119 | 23 | 148 | 128 | 11 | 121 1 |
| 372.9 | 691 | 122 | 25 | 141 | 129 | 29 | 123 1 |
| 379.5 | 640 | 120 | 25 | 116 | 141 | 10 | 123 1 |
| 386.1 | 748 | 119 | 22 | 105 | 149 | 7 | 123 1 |
| 392.9 | 725 | 118 | 23 | 142 | 153 | 13 | 124 1 |
| 399.4 | 759 | 120 | 21 | 172 | 151 | 12 | 125 1 |
| 405.6 | 620 | 122 | 29 | 166 | 145 | 17 | 126 1 |
| 412.5 | 492 | 123 | 32 | 127 | 145 | 33 | 128 2 |
| 418.9 | 485 | 125 | 29 | 106 | 143 | 33 | 128 2 |
| 425.3 | 453 | 128 | 28 | 39 | 156 | 29 | 130 2 |
| 433.1 | 307 | 128 | 26 | 11 | 115 | 3 | 127 1 |
| 438.8 | 270 | 125 | 40 | 23 | 113 | 5 | 124 2 |
| 443.9 | 281 | 118 | 45 | 2 | 109 | 0 | 118 3 |
| 452.6 | 310 | 121 | 42 | 31 | 129 | 4 | 122 2 |
| 458.5 | 318 | 128 | 29 | 40 | 131 | 4 | 129 2 |
| 462.9 | 5 | 133 | 9 | 133 4 | |||
| 465.3 | 304 | 134 | 29 | 134 2 | |||
| 471.8 | 278 | 142 | 30 | 142 2 | |||
| 478.3 | 220 | 147 | 33 | 147 2 | |||
| 484.4 | 107 | 145 | 32 | 145 3 | |||
| 490.2 | 15 | 114 | 16 | 114 4 | |||
| 500.3 | 3 | 116 | 15 | 116 9 | |||
| 505.9 | 66 | 133 | 35 | 133 4 | |||
| 511.5 | 139 | 124 | 34 | 124 3 | |||
| 518.2 | 170 | 128 | 29 | 128 2 | |||
| 524.7 | 173 | 130 | 33 | 130 2 | |||
| 531.2 | 148 | 126 | 34 | 126 3 | |||
| 537.6 | 91 | 118 | 19 | 118 2 | |||
| 544.7 | 96 | 125 | 19 | 125 2 | |||
| 551.1 | 128 | 127 | 22 | 127 2 | |||
| 557.8 | 152 | 134 | 25 | 135 2 | |||
| 564.4 | 144 | 129 | 27 | 129 2 | |||
| 570.7 | 130 | 135 | 28 | 135 2 | |||
| 576.8 | 72 | 125 | 26 | 125 3 | |||
| 583.9 | 18 | 117 | 21 | 117 5 | |||
| 589.9 | 7 | 114 | 21 | 114 8 |
| R | Napp | Vapp | Nrec | Vrec | V | ||
|---|---|---|---|---|---|---|---|
| arcsec | km s-1 | km s-1 | km s-1 | km s-1 | km s-1 | ||
| 6.9 | 70 | 103 | 28 | 66 | 110 | 71 | 107 7 |
| 11.2 | 109 | 124 | 27 | 105 | 150 | 22 | 136 2 |
| 15.4 | 156 | 141 | 27 | 113 | 126 | 34 | 135 3 |
| 19.7 | 201 | 150 | 30 | 88 | 115 | 47 | 140 3 |
| 24.4 | 243 | 139 | 33 | 76 | 85 | 56 | 126 4 |
| 28.7 | 247 | 134 | 31 | 119 | 104 | 28 | 124 2 |
| 33.0 | 184 | 128 | 39 | 151 | 131 | 41 | 129 3 |
| 37.1 | 150 | 108 | 27 | 118 | 134 | 53 | 120 4 |
| 41.9 | 155 | 96 | 33 | 71 | 146 | 52 | 112 4 |
| 46.4 | 217 | 109 | 44 | 78 | 113 | 48 | 110 4 |
| 50.8 | 292 | 108 | 46 | 96 | 97 | 62 | 106 4 |
| 55.1 | 390 | 113 | 45 | 221 | 116 | 39 | 114 2 |
| 59.5 | 428 | 120 | 38 | 301 | 117 | 28 | 119 2 |
| 63.8 | 420 | 118 | 35 | 423 | 131 | 26 | 125 1 |
| 68.3 | 449 | 118 | 38 | 421 | 138 | 20 | 128 1 |
| 72.6 | 529 | 118 | 24 | 425 | 140 | 19 | 128 1 |
| 77.0 | 626 | 117 | 25 | 419 | 144 | 19 | 128 1 |
| 81.5 | 707 | 114 | 22 | 579 | 143 | 20 | 127 1 |
| 85.8 | 682 | 111 | 23 | 615 | 138 | 22 | 124 1 |
| 90.2 | 682 | 111 | 21 | 668 | 139 | 24 | 125 1 |
| 94.6 | 652 | 113 | 26 | 674 | 137 | 21 | 125 1 |
| 99.0 | 723 | 113 | 29 | 703 | 135 | 19 | 124 1 |
| 103.4 | 635 | 111 | 26 | 553 | 135 | 22 | 122 1 |
| 107.8 | 609 | 120 | 20 | 522 | 135 | 23 | 127 1 |
| 112.2 | 598 | 128 | 18 | 561 | 134 | 22 | 131 1 |
| 116.6 | 703 | 134 | 17 | 552 | 136 | 20 | 135 1 |
| 121.0 | 661 | 139 | 18 | 649 | 142 | 17 | 141 1 |
| 125.5 | 661 | 139 | 20 | 800 | 145 | 16 | 142 1 |
| 129.8 | 700 | 143 | 20 | 925 | 148 | 19 | 146 1 |
| 134.2 | 680 | 146 | 26 | 1016 | 150 | 29 | 149 1 |
| 138.6 | 675 | 137 | 22 | 1052 | 150 | 24 | 145 1 |
| 143.0 | 713 | 143 | 18 | 1068 | 148 | 23 | 146 1 |
| 147.4 | 668 | 147 | 17 | 1031 | 155 | 21 | 152 1 |
| 151.8 | 661 | 152 | 15 | 924 | 157 | 32 | 155 1 |
| 156.2 | 782 | 153 | 15 | 719 | 159 | 38 | 156 1 |
| 160.7 | 807 | 155 | 14 | 706 | 162 | 36 | 158 1 |
| 165.0 | 830 | 156 | 17 | 689 | 161 | 38 | 158 1 |
| 169.4 | 863 | 155 | 18 | 684 | 156 | 35 | 155 1 |
| 173.8 | 837 | 162 | 16 | 553 | 156 | 37 | 159 1 |
| 178.1 | 706 | 164 | 18 | 495 | 160 | 42 | 162 1 |
| 182.6 | 533 | 166 | 19 | 399 | 155 | 37 | 161 1 |
| 187.0 | 408 | 171 | 21 | 430 | 154 | 30 | 162 1 |
| 191.4 | 382 | 174 | 19 | 420 | 158 | 29 | 165 1 |
| 195.8 | 396 | 176 | 17 | 309 | 161 | 26 | 169 1 |
| 200.2 | 317 | 169 | 15 | 329 | 160 | 35 | 165 2 |
| 204.7 | 235 | 171 | 14 | 342 | 164 | 23 | 167 1 |
| 209.1 | 295 | 172 | 17 | 346 | 165 | 32 | 168 1 |
| 213.4 | 312 | 175 | 16 | 429 | 172 | 20 | 174 1 |
| 217.8 | 250 | 174 | 14 | 332 | 175 | 23 | 175 1 |
| 222.2 | 193 | 172 | 13 | 504 | 163 | 38 | 165 2 |
| 226.7 | 227 | 169 | 16 | 380 | 161 | 23 | 164 1 |
| 231.2 | 272 | 180 | 20 | 411 | 160 | 27 | 168 1 |
| 235.3 | 286 | 187 | 24 | 607 | 154 | 35 | 165 1 |
| 239.9 | 344 | 188 | 27 | 471 | 156 | 26 | 169 1 |
| 244.2 | 497 | 182 | 26 | 443 | 167 | 24 | 175 1 |
| 248.6 | 572 | 177 | 34 | 542 | 163 | 24 | 170 1 |
| 253.0 | 409 | 175 | 35 | 628 | 163 | 24 | 168 1 |
| 257.4 | 270 | 178 | 32 | 743 | 168 | 24 | 170 1 |
| 262.0 | 140 | 188 | 30 | 816 | 169 | 26 | 172 1 |
| 266.2 | 154 | 206 | 44 | 797 | 163 | 31 | 170 2 |
| 270.2 | 57 | 208 | 46 | 745 | 162 | 28 | 165 2 |
| 274.8 | 19 | 238 | 15 | 675 | 158 | 30 | 160 1 |
| 279.3 | 563 | 159 | 29 | 159 1 | |||
| 283.7 | 469 | 162 | 30 | 162 1 | |||
| 288.2 | 380 | 178 | 28 | 178 1 | |||
| 292.4 | 283 | 183 | 30 | 183 2 | |||
| 296.7 | 162 | 175 | 31 | 175 2 | |||
| 300.9 | 48 | 154 | 26 | 154 26 |
| R | Napp | Vapp | Nrec | Vrec | V | ||
|---|---|---|---|---|---|---|---|
| arcsec | km s-1 | km s-1 | km s-1 | km s-1 | km s-1 | ||
| 3 | 36 | 64 | 55 | 36 | 3 | 36 | 34 11 |
| 6 | 59 | 111 | 25 | 59 | 64 | 33 | 88 5 |
| 8 | 85 | 130 | 31 | 85 | 86 | 38 | 108 5 |
| 10 | 108 | 147 | 33 | 108 | 89 | 42 | 118 5 |
| 12 | 131 | 170 | 21 | 124 | 143 | 21 | 156 3 |
| 14 | 153 | 169 | 17 | 129 | 142 | 22 | 155 2 |
| 17 | 182 | 174 | 11 | 172 | 148 | 21 | 161 2 |
| 19 | 201 | 179 | 9 | 201 | 150 | 21 | 164 2 |
| 21 | 228 | 184 | 13 | 228 | 149 | 15 | 167 1 |
| 23 | 254 | 186 | 19 | 254 | 153 | 14 | 169 1 |
| 25 | 277 | 184 | 19 | 275 | 156 | 14 | 170 1 |
| 28 | 291 | 183 | 16 | 291 | 159 | 17 | 171 1 |
| 30 | 323 | 185 | 15 | 315 | 164 | 18 | 175 1 |
| 32 | 347 | 186 | 13 | 339 | 170 | 16 | 178 1 |
| 34 | 373 | 185 | 15 | 373 | 173 | 17 | 179 1 |
| 36 | 387 | 185 | 16 | 384 | 177 | 13 | 181 1 |
| 39 | 423 | 188 | 14 | 423 | 178 | 10 | 183 1 |
| 41 | 443 | 191 | 12 | 443 | 180 | 10 | 185 1 |
| 43 | 462 | 192 | 11 | 460 | 180 | 11 | 186 1 |
| 45 | 487 | 193 | 11 | 486 | 180 | 11 | 187 1 |
| 47 | 514 | 196 | 11 | 512 | 182 | 10 | 189 1 |
| 50 | 544 | 198 | 11 | 512 | 185 | 10 | 191 1 |
| 52 | 558 | 199 | 11 | 512 | 192 | 10 | 195 1 |
| 54 | 573 | 199 | 10 | 515 | 198 | 13 | 198 1 |
| 56 | 606 | 200 | 11 | 506 | 200 | 12 | 200 1 |
| 58 | 631 | 201 | 10 | 560 | 202 | 15 | 201 1 |
| 61 | 654 | 202 | 10 | 602 | 203 | 15 | 203 1 |
| 63 | 686 | 202 | 9 | 604 | 208 | 13 | 205 1 |
| 65 | 695 | 201 | 10 | 641 | 209 | 12 | 205 1 |
| 67 | 706 | 202 | 10 | 678 | 209 | 18 | 206 1 |
| 69 | 718 | 201 | 11 | 647 | 209 | 16 | 205 1 |
| 72 | 725 | 200 | 12 | 535 | 207 | 18 | 204 1 |
| 74 | 742 | 197 | 16 | 520 | 208 | 15 | 203 1 |
| 76 | 778 | 195 | 19 | 573 | 207 | 17 | 201 1 |
| 78 | 782 | 195 | 22 | 611 | 205 | 18 | 200 1 |
| 80 | 825 | 195 | 20 | 677 | 202 | 19 | 199 1 |
| 83 | 841 | 196 | 18 | 686 | 201 | 20 | 199 1 |
| 85 | 863 | 195 | 16 | 714 | 198 | 22 | 197 1 |
| 87 | 883 | 195 | 15 | 642 | 198 | 21 | 197 1 |
| 89 | 833 | 196 | 16 | 617 | 194 | 27 | 195 1 |
| 91 | 826 | 197 | 15 | 600 | 195 | 24 | 196 1 |
| 93 | 864 | 197 | 15 | 665 | 191 | 26 | 194 1 |
| 96 | 893 | 197 | 14 | 724 | 188 | 30 | 192 1 |
| 98 | 910 | 197 | 14 | 631 | 191 | 28 | 194 1 |
| 100 | 931 | 198 | 15 | 678 | 189 | 28 | 193 1 |
| 102 | 935 | 200 | 16 | 792 | 193 | 23 | 196 1 |
| 104 | 902 | 202 | 15 | 885 | 197 | 21 | 199 1 |
| 107 | 870 | 204 | 14 | 977 | 195 | 27 | 199 1 |
| 109 | 928 | 204 | 13 | 955 | 196 | 25 | 200 1 |
| 111 | 935 | 204 | 14 | 896 | 198 | 25 | 201 1 |
| 113 | 1013 | 203 | 15 | 851 | 200 | 25 | 201 1 |
| 116 | 976 | 204 | 14 | 814 | 199 | 29 | 202 1 |
| 118 | 987 | 205 | 13 | 799 | 199 | 33 | 202 1 |
| 120 | 1046 | 205 | 12 | 778 | 202 | 30 | 203 1 |
| 122 | 1100 | 205 | 13 | 771 | 204 | 31 | 204 1 |
| 124 | 1219 | 204 | 12 | 802 | 203 | 34 | 203 1 |
| 127 | 1268 | 204 | 12 | 839 | 203 | 34 | 204 1 |
| 129 | 1282 | 205 | 11 | 913 | 203 | 34 | 204 1 |
| 131 | 1323 | 207 | 11 | 957 | 208 | 29 | 207 1 |
| 133 | 1259 | 209 | 12 | 918 | 209 | 27 | 209 1 |
| 135 | 1214 | 209 | 12 | 810 | 208 | 29 | 209 1 |
| 137 | 1160 | 210 | 12 | 741 | 209 | 26 | 210 1 |
| 140 | 1111 | 208 | 12 | 623 | 209 | 27 | 209 1 |
| 142 | 1116 | 208 | 12 | 602 | 209 | 30 | 209 1 |
| 144 | 1093 | 207 | 12 | 649 | 207 | 33 | 207 1 |
| 146 | 1132 | 206 | 12 | 624 | 207 | 34 | 206 1 |
| 149 | 1153 | 205 | 13 | 605 | 210 | 28 | 208 1 |
| 151 | 1175 | 204 | 13 | 619 | 211 | 22 | 208 1 |
| 153 | 1175 | 204 | 15 | 622 | 209 | 24 | 207 1 |
| 155 | 1230 | 205 | 16 | 587 | 206 | 28 | 206 1 |
| 157 | 1177 | 206 | 17 | 530 | 206 | 30 | 206 1 |
| 160 | 1080 | 208 | 16 | 458 | 203 | 34 | 205 2 |
| 162 | 980 | 208 | 13 | 467 | 200 | 32 | 204 2 |
| 164 | 988 | 209 | 11 | 537 | 204 | 26 | 206 1 |
| 166 | 1022 | 211 | 12 | 711 | 205 | 22 | 208 1 |
| 168 | 990 | 211 | 12 | 630 | 203 | 22 | 207 1 |
| 171 | 1032 | 212 | 13 | 588 | 201 | 22 | 206 1 |
| 173 | 1077 | 209 | 14 | 606 | 200 | 24 | 205 1 |
| 175 | 1009 | 209 | 12 | 570 | 203 | 28 | 206 1 |
| 177 | 1050 | 208 | 11 | 542 | 206 | 21 | 207 1 |
| 179 | 1018 | 207 | 11 | 507 | 207 | 21 | 207 1 |
| 182 | 1004 | 208 | 13 | 529 | 207 | 20 | 207 1 |
| 184 | 960 | 208 | 13 | 593 | 203 | 24 | 206 1 |
| 186 | 836 | 209 | 14 | 688 | 202 | 27 | 205 1 |
| 188 | 674 | 210 | 14 | 591 | 200 | 30 | 205 1 |
| 190 | 608 | 212 | 12 | 569 | 199 | 29 | 206 1 |
| 192 | 499 | 213 | 11 | 539 | 201 | 28 | 207 1 |
| 195 | 472 | 213 | 11 | 623 | 204 | 26 | 208 1 |
| 197 | 415 | 211 | 11 | 714 | 204 | 26 | 207 1 |
| 199 | 296 | 208 | 14 | 702 | 207 | 25 | 208 1 |
| 201 | 276 | 202 | 27 | 599 | 207 | 26 | 205 2 |
| 204 | 321 | 198 | 35 | 619 | 210 | 28 | 204 2 |
| 206 | 389 | 202 | 19 | 603 | 217 | 17 | 209 1 |
| 208 | 341 | 200 | 13 | 575 | 217 | 13 | 208 1 |
| 210 | 327 | 199 | 11 | 436 | 215 | 15 | 207 1 |
| 212 | 276 | 201 | 17 | 309 | 216 | 17 | 209 1 |
| 214 | 193 | 202 | 14 | 283 | 214 | 20 | 208 2 |
| 217 | 112 | 199 | 15 | 283 | 208 | 29 | 203 2 |
| 219 | 82 | 192 | 28 | 278 | 208 | 27 | 200 3 |
| 221 | 67 | 196 | 15 | 252 | 206 | 27 | 201 2 |
| 223 | 56 | 208 | 10 | 293 | 213 | 22 | 210 2 |
| 226 | 20 | 218 | 19 | 344 | 213 | 19 | 215 4 |
| 227 | 10 | 223 | 28 | 376 | 211 | 19 | 217 9 |
| 233 | 13 | 190 | 23 | 267 | 208 | 14 | 199 6 |
| 234 | 21 | 167 | 17 | 275 | 211 | 19 | 189 4 |
| 237 | 29 | 181 | 45 | 282 | 217 | 27 | 199 8 |
| 239 | 21 | 174 | 78 | 209 | 217 | 37 | 195 17 |
| 241 | 42 | 180 | 20 | 218 | 212 | 33 | 196 4 |
| 243 | 29 | 191 | 13 | 138 | 219 | 29 | 205 3 |
| 245 | 51 | 192 | 5 | 69 | 221 | 34 | 206 4 |
| 247 | 28 | 192 | 7 | 65 | 235 | 52 | 213 7 |
| 251 | 1 | 214 | 0 | 96 | 234 | 20 | 224 2 |
| 255 | 8 | 204 | 4 | 86 | 237 | 11 | 221 2 |
| 256 | 23 | 208 | 17 | 119 | 245 | 11 | 227 4 |
| 259 | 43 | 199 | 31 | 165 | 238 | 14 | 219 5 |
| 261 | 49 | 208 | 14 | 111 | 238 | 15 | 223 2 |
| 263 | 73 | 205 | 17 | 44 | 233 | 21 | 219 4 |
| 265 | 78 | 206 | 18 | 33 | 249 | 34 | 227 6 |
| 267 | 81 | 204 | 30 | 9 | 218 | 92 | 211 31 |
| 270 | 110 | 207 | 21 | 6 | 241 | 15 | 224 6 |
| 272 | 133 | 206 | 22 | 16 | 234 | 15 | 220 4 |
| 274 | 126 | 200 | 28 | 28 | 231 | 20 | 215 4 |
| 276 | 94 | 205 | 21 | 26 | 223 | 14 | 214 3 |
| 278 | 92 | 212 | 17 | 21 | 230 | 10 | 221 3 |
| 281 | 120 | 217 | 21 | 2 | 139 | 19 | 178 14 |
| 283 | 134 | 205 | 25 | 3 | 47 | 4 | 126 3 |
| 285 | 128 | 201 | 28 | 1 | 29 | 0 | 115 2 |
| 287 | 144 | 196 | 31 | 4 | 195 | 51 | 195 25 |
| 289 | 146 | 198 | 30 | 12 | 112 | 53 | 155 15 |
| 291 | 112 | 199 | 23 | 7 | 117 | 16 | 158 7 |
| 294 | 66 | 199 | 23 | 199 3 | |||
| 296 | 56 | 182 | 24 | 182 3 | |||
| 298 | 86 | 176 | 18 | 176 2 | |||
| 300 | 93 | 177 | 19 | 177 2 | |||
| 303 | 101 | 172 | 23 | 172 2 | |||
| 305 | 118 | 164 | 35 | 164 3 | |||
| 307 | 76 | 160 | 14 | 160 2 |
| R | Napp | Vapp | Nrec | Vrec | V | ||
|---|---|---|---|---|---|---|---|
| arcsec | km s-1 | km s-1 | km s-1 | km s-1 | km s-1 | ||
| 20 | 41 | 193 | 160 | 26 | 30 | 232 | 111 52 |
| 25 | 19 | 171 | 103 | 42 | 144 | 155 | 158 34 |
| 28 | 21 | 214 | 90 | 46 | 180 | 126 | 197 27 |
| 33 | 54 | 203 | 80 | 43 | 225 | 133 | 214 23 |
| 37 | 47 | 262 | 112 | 33 | 270 | 62 | 266 20 |
| 42 | 58 | 293 | 155 | 30 | 304 | 75 | 299 25 |
| 46 | 60 | 323 | 177 | 63 | 265 | 225 | 294 36 |
| 51 | 113 | 297 | 161 | 128 | 262 | 117 | 279 18 |
| 55 | 151 | 312 | 154 | 231 | 291 | 90 | 302 14 |
| 59 | 171 | 304 | 150 | 276 | 296 | 107 | 300 13 |
| 64 | 176 | 300 | 142 | 282 | 299 | 89 | 299 12 |
| 68 | 237 | 312 | 152 | 227 | 315 | 78 | 314 11 |
| 72 | 265 | 304 | 159 | 209 | 312 | 98 | 308 12 |
| 77 | 286 | 316 | 153 | 167 | 321 | 113 | 318 13 |
| 81 | 344 | 326 | 145 | 130 | 316 | 68 | 321 10 |
| 86 | 314 | 333 | 147 | 138 | 287 | 94 | 310 12 |
| 90 | 306 | 345 | 159 | 197 | 300 | 129 | 323 13 |
| 95 | 311 | 345 | 185 | 240 | 301 | 104 | 323 12 |
| 99 | 339 | 329 | 147 | 262 | 300 | 68 | 314 9 |
| 103 | 352 | 329 | 122 | 226 | 299 | 127 | 314 11 |
| 108 | 399 | 305 | 147 | 227 | 289 | 146 | 297 12 |
| 112 | 348 | 316 | 127 | 196 | 257 | 139 | 286 12 |
| 117 | 391 | 321 | 139 | 120 | 267 | 232 | 294 22 |
| 121 | 365 | 316 | 129 | 98 | 302 | 167 | 309 18 |
| 125 | 319 | 291 | 154 | 105 | 314 | 185 | 303 20 |
| 130 | 349 | 301 | 152 | 124 | 317 | 208 | 309 20 |
| 134 | 376 | 315 | 155 | 124 | 326 | 211 | 321 21 |
| 139 | 284 | 300 | 155 | 112 | 336 | 192 | 318 20 |
| 143 | 185 | 308 | 173 | 104 | 369 | 222 | 338 25 |
| 147 | 129 | 327 | 205 | 87 | 356 | 183 | 342 27 |
| 152 | 99 | 304 | 159 | 59 | 321 | 145 | 312 25 |
| 156 | 116 | 307 | 174 | 19 | 455 | 324 | 381 76 |
| 160 | 116 | 312 | 191 | 8 | 432 | 214 | 372 78 |
| 165 | 84 | 333 | 176 | 7 | 396 | 180 | 364 71 |
| 169 | 76 | 335 | 176 | 335 20 | |||
| 174 | 48 | 339 | 206 | 339 30 | |||
| 178 | 22 | 376 | 194 | 376 41 | |||
| 187 | 17 | 350 | 254 | 350 62 | |||
| 191 | 21 | 348 | 221 | 348 48 | |||
| 196 | 16 | 453 | 226 | 453 56 | |||
| 200 | 20 | 388 | 207 | 388 46 | |||
| 204 | 15 | 382 | 131 | 382 34 | |||
| 208 | 3 | 304 | 82 | 304 48 |
| R | Napp | Vapp | Nrec | Vrec | V | ||
|---|---|---|---|---|---|---|---|
| arcsec | km s-1 | km s-1 | km s-1 | km s-1 | km s-1 | ||
| 11.5 | 1 | 146 | - | 146 - | |||
| 14.3 | 6 | 197 | 20 | 10 | 121 | 179 | 150 45 |
| 18.4 | 11 | 223 | 34 | 32 | 222 | 37 | 223 8 |
| 22.0 | 29 | 233 | 44 | 43 | 228 | 27 | 230 6 |
| 25.8 | 73 | 250 | 38 | 43 | 246 | 31 | 248 5 |
| 29.8 | 82 | 265 | 28 | 44 | 244 | 29 | 258 4 |
| 33.6 | 89 | 270 | 17 | 38 | 247 | 36 | 263 4 |
| 37.5 | 89 | 274 | 24 | 33 | 267 | 60 | 272 6 |
| 41.7 | 105 | 287 | 22 | 36 | 286 | 42 | 287 4 |
| 45.7 | 125 | 293 | 16 | 29 | 272 | 57 | 289 5 |
| 49.4 | 134 | 298 | 27 | 45 | 273 | 25 | 292 3 |
| 53.4 | 147 | 312 | 31 | 45 | 272 | 25 | 302 3 |
| 57.6 | 155 | 313 | 49 | 60 | 275 | 24 | 302 4 |
| 61.4 | 169 | 319 | 50 | 104 | 279 | 29 | 304 3 |
| 65.2 | 141 | 318 | 33 | 88 | 278 | 38 | 303 3 |
| 69.3 | 130 | 320 | 32 | 89 | 283 | 46 | 305 4 |
| 73.4 | 112 | 315 | 30 | 93 | 282 | 40 | 300 3 |
| 77.3 | 125 | 313 | 39 | 117 | 276 | 31 | 295 3 |
| 81.1 | 108 | 301 | 45 | 109 | 287 | 28 | 294 4 |
| 85.2 | 82 | 298 | 50 | 103 | 284 | 33 | 290 4 |
| 89.2 | 86 | 292 | 45 | 113 | 290 | 35 | 291 4 |
| 93.1 | 102 | 283 | 37 | 116 | 288 | 31 | 286 3 |
| 97.1 | 141 | 284 | 34 | 92 | 292 | 37 | 287 3 |
| 101.0 | 169 | 292 | 27 | 63 | 298 | 39 | 294 3 |
| 105.0 | 160 | 288 | 29 | 55 | 297 | 34 | 290 3 |
| 108.8 | 153 | 289 | 33 | 64 | 287 | 30 | 288 3 |
| 112.7 | 124 | 295 | 30 | 45 | 275 | 43 | 290 4 |
| 116.9 | 128 | 296 | 29 | 36 | 291 | 46 | 294 4 |
| 120.7 | 108 | 298 | 22 | 26 | 294 | 43 | 297 4 |
| 124.8 | 91 | 296 | 22 | 29 | 283 | 33 | 293 4 |
| 128.6 | 93 | 294 | 36 | 14 | 275 | 25 | 291 4 |
| 132.8 | 93 | 304 | 18 | 19 | 295 | 31 | 303 3 |
| 136.6 | 85 | 309 | 24 | 20 | 289 | 30 | 305 4 |
| 140.5 | 76 | 322 | 37 | 15 | 284 | 18 | 316 4 |
| 144.4 | 21 | 296 | 52 | 10 | 282 | 13 | 291 10 |
| 147.9 | 9 | 276 | 36 | 6 | 272 | 10 | 275 10 |
| 76.3 | 18 | 290 | 43 | 290 10 | |||
| 78.2 | 21 | 314 | 14 | 314 3 | |||
| 79.9 | 17 | 296 | 64 | 296 16 | |||
| 82.2 | 30 | 310 | 13 | 310 2 | |||
| 164.4 | 19 | 303 | 17 | 303 4 | |||
| 168.0 | 4 | 275 | 10 | 275 5 |
| R | V |
|---|---|
| arcsec | km s-1 |
| 60 | 294.2 9.21 |
| 75 | 299.0 5.94 |
| 90 | 297.3 3.31 |
| 105 | 295.6 3.42 |
| 120 | 295.9 3.23 |
| 135 | 297.1 3.72 |
| 150 | 292.4 4.49 |
| 165 | 288.6 5.40 |
| 180 | 285.1 5.89 |