Spectroscopic study of blue compact galaxies
This is the fourth paper in a series studying star formation rates, stellar components, metallicities, and star formation histories of a blue compact galaxy (BCG) sample. Using H, [O ii]3727, infrared (IR), radio (1.4 GHz) luminosities and neutral hydrogen (H i) gas masses, we estimated star formation rates and gas depletion timescales of 72 star-forming BCGs. The star formation rates of the BCGs in our sample span nearly four orders of magnitude, from approximately 10-2 to M⊙ yr-1, with a median star formation rate of about 3 M⊙ yr-1. The typical gas depletion timescale of BCGs is about one billion years. Star formation could be sustained at the current level only on a timescale significantly lower than the age of the universe before their neutral gas reservoir is completely depleted.
To assess the possible systematic differences among different star formation rate indicators, we compared the star formation rates derived from H, [O ii]3727, IR, and radio luminosities, and investigated the effects from underlying stellar absorption and dust extinction. We found that subtracting underlying stellar absorption is very important to calculate both dust extinction and star formation rate of galaxies. Otherwise, the intrinsic extinction will be overestimated, the star formation rates derived from [O ii]3727 and H will be underestimated (if the underlying stellar absorption and the internal extinction were not corrected from the observed luminosity) or overestimated (if an overestimated internal extinction were used for extinction correction). After both the underlying stellar absorption and the dust extinction were corrected, a remarkably good correlation emerges among H, [O ii]3727, IR and radio star formation rate indicators. Finally, we find a good correlation between the measured star formation rate and the absolute blue magnitude, metallicity, interstellar extinction of BCGs. Our results indicate that faint, low-mass BCGs have lower star formation rates.
Key Words.:
galaxies: compact – galaxies: dust, extinction – galaxies: starburst – stars: formation1 Introduction
Understanding the star formation history of the universe is the primary goal of much current research in astronomy (Madau et al. 1996; Steidel et al. 1999). Star formation rate (SFR) is a crucial ingredient to understand the star formation history of galaxies at all redshifts, as well as the global evolution of the Universe. To obtain this understanding, a reliable estimate of the SFR in individual galaxies is required. Many calibrations of SFR depend on the luminosity measured at various wavelengths, including radio, infrared (IR), ultraviolet (UV), optical spectral lines (such as H, [O ii]3727) and continuum (Kennicutt 1998). Using these SFR indicators, a number of studies of the SFR were performed at different redshift regimes (such as Gallego et al. 1995; Pettini et al. 1998; Sullivan et al. 2001). Unfortunately, the agreement among these SFR indicators at different wavelengths is poor; the underlying reasons for the differences are not well understood (Charlot et al. 2002).
Blue compact galaxies (BCGs) are characterized by their blue color, compact appearance, high gas content, strong nebular emission lines, and low chemical abundances (Kunth & Östlin (2000)). In recent years BCGs have attracted a great deal of interest and have become key in understanding fundamental astrophysical problems. Most of the work carried out has focused on a statistical analysis of BCG samples by means of surface photometry (Papaderos et al. 1996; Vitores et al. 1996; Doublier et al. 1997; Östlin et al. 1999; Cairós et al. 2001; Gil de Paz et al. 2003). The measured broadband colors are strongly affected by interstellar extinction and gaseous emission; therefore, optical broadband photometry alone does not allow us to derive their physical properties accurately.
Spectroscopic information is required since spectra of galaxies contain a wealth of additional information concerning the physical properties of galaxies. The continuum and the absorption lines provide information concerning the stellar content, while the nebular emission lines provide a measure of the SFR and the interstellar metallicity. During the last three decades, a number of major objective-prism surveys for extragalactic emission-line objects have been carried out. Examples include the University of Michigan (UM) survey (MacAlpine, Smith, & Lewis 1977), the Universidad Complutense de Madrid (UCM) survey (Zamorano et al. 1994, 1996), the KPNO International Spectroscopic Survey (KISS) (Salzer et al. 2000). Some BCG candidates and other emission line objects have been discovered. Since the objective-prism spectra have very low spectral dispersion and small wavelength range, they cannot be used to investigate the physical properties of BCGs. Spectroscopic follow-up observations were carried out to study the characteristics of the survey BCG candidates (Salzer et al. (1989); Terlevich et al. (1991); Gallego et al. (1996)). The observations were obtained with different telescopes at different observatories with different equipment and instrument setups. The spectra from these observations have relatively low dispersions and low S/N ratios.
We have undertaken an extensive long-slit spectral observation of 200 BCGs since 1997. Spectra were obtained at the Cassegrain focus of the 2.16 m telescope of National Astronomical Observatory of China. A 300 line mm-1 grating was used, giving a dispersion of 4.8 Å pixel-1. All 200 spectral observations were finished by February 2004, and 97 luminous BCG spectra were studied in this series. The observations have been performed with the same instruments; the reductions and analyses are homogeneous.
The blue color, high gas content and strong nebular emission-line spectrum of BCGs indicate that they have a high star formation activity. One of the key parameters in developing an understanding of the formation and evolution of BCGs is the determination of the SFRs. While SFRs are central to discussions of the evolution of BCGs, there are surprisingly few quantitative SFRs for BCGs available in the literature. In addition, the values available in the literature suggest that the SFRs of BCGs might vary over five orders of magnitude, and the mean SFRs given in the existing investigations are noted to also vary over two orders of magnitude. It is therefore not clear whether and to what extent the wide range of BCG SFRs results from the use of different techniques, assumptions, or sample selections, employed in the available studies.
Furthermore, the studies of intermediate redshift compact galaxies in the Hubble deep field (Guzmán et al. (1996); Phillips et al. (1997)) reveal that these include galaxies with properties very similar to those of local luminous BCGs, such as small sizes, high luminosities and blue colors. Because spectroscopic observation for these intermediate redshift galaxies is difficult (for example, H is shifted outside the optical range), some other SFR indicators or methods must be used to determine the SFRs of these intermediate redshift galaxies (Guzmán et al. (1997); Hammer et al. (2001); Guzmán et al. (2003)). Therefore, estimating SFRs of nearby BCGs with different SFR indicators may help us in accurately estimating SFRs of intermediate redshift galaxies and studying their evolutionary history.
Based on our homogeneous BCG optical spectral sample, we calculate SFRs and gas depletion timescales of a sample of star-forming blue compact galaxies, using the H and [O ii]3727 emission line fluxes and the IR and radio luminosities. We compare the global SFRs derived from [O ii]3727 and H, with or without corrections for dust extinction and underlying stellar absorption, to the SFRs derived from the IR and radio luminosities of these galaxies and investigate the source of the discrepancies among these different SFR indicators. We also investigate the relationship between the intrinsic SFR and other galaxy properties. We found that subtracting underlying stellar Balmer absorptions is very important in estimating dust extinction and SFR of galaxies.
The paper is organized as follows. In Sect. 2 we review the spectroscopic observation and reduction, and describe the IRAS data, the radio 1.4 GHz observations. In Sect. 3 we calculate multiwavelength SFR estimates for the galaxy sample using the available flux data. In Sect. 4, we compare the results obtained using the different SFR estimators and investigate the underlying reason for their discrepancies. We present some discussion in Sect. 5 and our conclusions in Sect. 6. Throughout this paper we assume , and adopt the Salpeter initial mass function with mass ranges .
2 The data
2.1 H and [O ii]3727 emission line fluxes
To investigate the current SFRs, stellar components, metallicities and star formation histories of BCGs, we have observed an atlas of optical spectra of the central regions of 97 blue compact galaxies in the first paper of this series (Kong & Cheng 2002a ). Since we want to combine the optical spectra we obtained with H i data to constrain simultaneously the stellar and gas contents of BCGs, our sample galaxies were selected from large H i surveys (Gordon & Gottesman 1981; Thuan & Martin 1981). The spectra were obtained at the 2.16 m telescope at the XingLong Station of the National Astronomical Observatory of China. A 300 line mm-1 grating was used to achieve coverage in the wavelength region from 3580 to 7400 Å with about 4.8 Å per pixel resolution. The emission line equivalent widths and fluxes for our BCG sample were provided in the second paper of this series (Kong et al. 2002b ). The typical uncertainties of the measurements are less than 10% for H6563, H4861, and [O ii]3727 emission lines.
2.1.1 Stellar absorption and extinction correction
The underlying stellar absorption affects accurate measurement of H-Balmer emission line, and is crucial to constrain the attenuation by dust and the SFRs of galaxies. Some previous works have discussed this effect on extinction and SFR estimation. Rosa-González et al. (2002) found the is close to the while both and show a clear excess for 31 nearby star-forming galaxies. The underlying Balmer absorption results in an underestimate of the emitted fluxes and an overestimation of the internal extinction of the galaxy. Subtracting the underlying absorption from emission lines (with EWabs(H) = EWabs(H) = EWabs(H)) brings into agreement the SFR in the optical with those in the FIR. Using 149 galaxies from the Stromlo-APM redshift survey and using Charlot & Longhetti (2001) model (which provides a physically consistent description of the effects of stars, gas and dust on the integrated spectra of galaxies), Charlot et al. (2002) found the contamination of Balmer emission by stellar H-Balmer absorption is important in estimating SFRs of galaxies with small observed H emission equivalent widths. Flores et al. (2004) studied SFRs for a sample of 16 distant galaxies; the underlying Balmer absorption lines were estimated by the Bica & Allion (1986) method. After subtracting the underlying Balmer absorption line effect, the extinction estimates using the H/H and the H/H and the SFR estimates (for galaxies with below 100 M⊙ yr-1) using and are in excellent agreement.
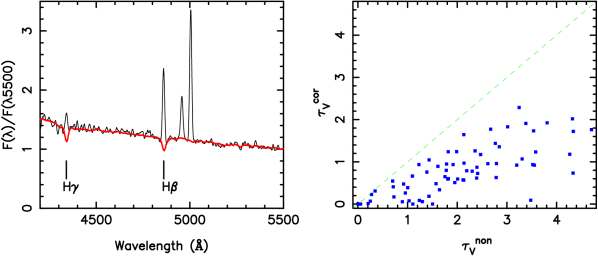
To derive the equivalent widths for these underlying stellar absorption lines and correct the measured Balmer emission line fluxes for these absorptions, we have applied an empirical population synthesis method to our BCG spectra (Cid Fernandes et al. (2001)). The left panel of Figure 1 illustrates the spectral fit of one of our sample galaxies. The synthetic spectrum (thick line) from an empirical population synthesis analysis provides good fits to the observed spectrum of BCGs (thin line). The absorption wings of H and H in the observed spectrum is well reproduced by the synthetic spectrum too (Kong et al. (2003)). The synthetic stellar spectrum is then subtracted from the observed spectrum to yield a pure emission spectrum uncontaminated by underlying stellar absorption, which we can use to measure the Balmer decrement, derive extinction and estimate SFR.
In the right panel of Figure 1, we show the effect of underlying stellar absorption on the internal extinction of galaxies ( is the effective absorption optical depth at 5500Å by interstellar dust), where was determined using these two strongest Balmer lines, H, H, and the Charlot & Fall (2000) effective absorption curve (which is similar to the Calzetti (2001) effective absorption curve at optical wavelengths; for the Charlot & Fall (2000) effective absorption curve is almost same as for the Calzetti (2001) effective absorption curve and varying the extinction curves has negligible effects in the visible range). was calculated from the and , where the underlying stellar absorption was not subtracted. was calculated from the and , and the underlying stellar population absorption was subtracted. From this figure, we find that subtracting underlying stellar absorption is very important in calculating the ; otherwise the internal extinction of galaxy will be overestimated. Using , the internal extinction of each galaxy was corrected.
2.1.2 Aperture corrections
In addition to the underlying absorption and extinction correction, the emission line fluxes also require an aperture correction to account for the fact that only a limited amount of emission from a galaxy is detected using a slit 2″ 3″ wide and 3′ long.
Two different methods were used to estimate the slit covering fraction. The first method is similar to that used by Kewley et al. (2002). We convolve the galaxy spectral energy distribution with the normalized B-filter response curve (Bessell 1979) in -band magnitude, , and estimate the fraction, , by comparison with the B-band photometry for the whole galaxy: . is the B-band magnitude for the whole galaxy, which is taken from Gordon & Gottesman (1981), de Vaucouleurs et al. (1991, RC3) and the NASA/IPAC Extragalactic Database (NED).
The second method is similar to that used by Carter et al. (2001). We use the digitized Palomar (POSS) images of BCGs to estimate the slit covering fraction for the galaxies. We measure the ratio of the photographic flux within the slit aperture to the total photographic flux, , where is the photographic flux within the slit aperture, and is the total photographic flux of a galaxy.
The results from these two different methods are in good agreement in most cases. We use the average slit covering fraction from these two methods for the aperture correction. Most of our spectra contain 2050% of the total flux of the galaxies; for the largest galaxies this fraction can be as small as 10%; for the smallest galaxies this fraction can be as large as 90%. The average slit fraction of our sample is 37%. The absolute fluxes of H and [O ii]3727, , were calibrated from the spectral flux, , and the average slit covering fraction with .
2.2 Infrared data
Indicators of SFR at longer wavelengths are less effected by dust extinction than those at UV or optical wavelengths. To investigate the underlying reasons for the discrepancies between different SFR indicators, we also use the infrared and radio luminosities to derive the SFR of BCGs.
Infrared Astronomical Satellite (IRAS) products include 12, 25, 60 and 100 flux densities for galaxies from the Point Source Catalog (brighter than about 0.5 Jy) and Faint Source Catalog (typically brighter than 0.2 Jy) (Moshir et al. 1992). We cross-correlated our galaxies with the IRAS Faint Source Catalogue and Point Source Catalogue. The IRAS beam size at 60 is 1.5′, and the IRAS positional uncertainty is 30″. Because the spectroscopic positional uncertainty is only a few arcseconds and because all BCGs are smaller than 2′ in extent, we used a detection radius of 30″. Any IRAS source associated with a BCG should be detected within this radius. We found that of the 72 BCGs in our sample, 58 are detected at all four bands by IRAS within 30″; most of them have moderate or good quality fluxes at 60 and 100 .
For each galaxy that was detected by IRAS, the total far-infrared flux was estimated from the observed IRAS flux densities at 25, 60, and 100 , using the method of Dale & Helou (2002). The total IR flux determined in this way is typically 2.2 0.4 times larger than the FIR estimator of Helou et al. (1985), and similar to that from the estimator of Sanders & Mirabel (1996).
2.3 1.4 GHz radio flux
The insensitivity of radio wavelengths to dust obscuration makes radio emission a particularly attractive way of estimating SFRs in star-forming galaxies. To calculate the SFRs of BCGs, we extract the radio 1.4 GHz integrated flux for our sample galaxies from the NRAO VLA Sky Survey (NVSS) and Faint Images of the Radio Sky at Twenty-cm (FIRST) survey.
The NVSS is a 1.4 GHz continuum survey covering the entire sky north of -40 deg declination, made using the Very Large Array (VLA) operated by the National Radio Astronomy Observatory. About 220,000 individual snapshots (phase centers) have been observed. The resulting images have a rms noise level of about 0.5 mJy beam-1 and a FWHM resolution of 45″. A detailed description is given in Condon et al. (1998). For 45 galaxies in our BCG sample, an NVSS catalog source is close enough ( 30″) to be a probable identification.
The FIRST is a 1.4 GHz radio continuum survey currently covering about 9033 square degrees of the North Galactic Cap. The images have a typical rms noise level of 0.15 mJy with a FWHM resolution of 5″ (White et al. 1997). From the FIRST catalog (03apr11 version, 2003 April 11), 24 galaxies were matched with our BCG sample (). For these 24 FIRST galaxies, 22 of them were observed by the NVSS too. Because of the much higher resolution of FIRST compared to NVSS, we will use the FIRST flux density for SFR calculation when galaxies were observed by both FIRST and NVSS.
2.4 Distances
Of the 72 star-forming BCGs in our sample, all have [O ii]3727 and H fluxes, 58 have IR fluxes, and 47 have 1.4 GHz radio fluxes. To calculate the SFRs of galaxies, we convert the fluxes into luminosities, using . Here is the cosmological luminosity distance, calculated using the heliocentric velocities of the galaxies and a Hubble constant value of km s-1 Mpc-1 from WMAP (Spergel et al. 2003).
3 Multiwavelength star formation rates
In this section, we calculate the SFRs of 72 BCGs from the luminosities of [O ii]3727 and H nebular lines, IR and radio continuum using well-known calibrations.
3.1 SFR from H luminosities
Hydrogen recombination line fluxes have been used very extensively to estimate the SFR, since they are proportional to the number of photons produced by the hot stars, which is in turn proportional to their birthrate. Most applications of this method have been based on measurements of the H line. Other hydrogen recombination lines, such as H and H, were not widely used because the effect of the underlying stellar absorption and dust extinction are more important in these blue lines.
For the estimate of the SFR from H luminosities we used the expression given by Kennicutt (1998):
| (1) |
which is valid for a Te=104K and Case B recombination, i.e. all the ionizing photons are processed by the gas.
Figure 2a shows that the SFRs derived from H fluxes for the 72 star-forming blue compact galaxies in our sample. of BCGs cover almost four orders of magnitude, from 0.01 to 65 and with a median SFR of 2.4 .

3.2 SFR from [O ii]3727 luminosities
If recombination lines are unavailable, the collisionally excited lines of heavy elements may be used in their stead. The [O ii]3727 doublet is the most natural star formation tracer for objects with redshifts larger than 0.4 where H is shifted outside the optical range. The [O ii]3727 luminosity is not directly coupled to the ionization rate, and their excitation is known to be sensitive to the abundance and the ionization state of the gas. However, it is claimed that the excitation of [O ii]3727 is sufficiently stable in observed galaxies that it can be calibrated empirically with H as a quantitative SFR tracer (Gallagher et al. 1989; Kennicutt 1992).
Figure 8a in Kong et al. (2002) shows a plot of the [O ii]3727 emission line flux versus the H emission line flux corrected for stellar absorption in our star-forming BCG sample. There is a good correlation between and . From the data in Fig. 8a of Kong et al. (2002), we derive a least-squares relationship of /= 0.85. The / of BCGs (local galaxies) in good agreement with the values of high redshift galaxies, where / 0.9 (Hippelein et al. 2003). Adopting the calibration between SFR and H luminosity given in Kennicutt (1998), the SFR and can be expressed as:
| (2) |
3.3 SFR from far-infrared continuum
A significant fraction of the bolometric luminosity of a galaxy is absorbed by interstellar dust and re-emitted in the thermal IR, at wavelengths of roughly 10–300 . The absorption cross section of the dust is strongly peaked in the ultraviolet, so in principle the FIR emission can be a sensitive tracer of the young stellar population and SFR. Using theoretical stellar flux distributions and evolutionary models, we can then derive the SFRs of galaxies.
The SFR of a galaxy in our sample was estimated from its integrated IR luminosity (Kennicutt 1998) by:
| (3) |
where refers to the luminosity integrated over the full mid-infrared to submillimeter spectrum (8–1000 ). The for 58 BCGs in our sample with IRAS detection were plotted in Figure 2c, range from 0.02 to 67 and with a median SFR of 3.6 .
3.4 SFR from 1.4 GHz continuum
In theory, the radio emission results predominantly from the nonthermal supernova remnant flux, and therefore should be very model dependent and critically influenced by the density of, and magnetic field in, the interstellar gas. However, the FIR/radio (the 1.4 GHz radio continuum flux) correlation suggests that the constant of proportionality is nearly the same for all star forming galaxies and is insensitive to unknown variables such as magnetic field strength (Condon 1992; Yun et al. 2001). The reality of this correlation has been repeatedly demonstrated by observation, not only in terms of the integrated flux, but also in terms of spatial correlations between these two quantities within individual galaxies. Therefore, the radio continuum flux can be used as a star formation indicator.
For an individual star-forming galaxy, the SFR is directly proportional to its radio luminosity at 1.4 GHz (Condon 1992):
| (4) |
Condon (1992) derives this relation by calculating the synchrotron radio emission from supernova remnants and the thermal radio emission from HII regions. Both the thermal and non-thermal components of the radio expression are proportional to the formation rate of high-mass stars () which produce supernova and large HII regions, so the factor is included to account for the mass of all stars in the interval . We have assumed throughout a Salpeter IMF (), for which .
The for 47 BCGs in our sample with NVSS and FIRST detection were plotted in Figure 2d, range from 0.01 to 129 and with a median SFR of 5.3 . Most of them are consistent with those derived from H, [O ii]3727 and IR luminosities, but the of I Zw 56 is much larger than those derived from other SFR indicators.
3.5 of BCGs
Based on the FIR (60 m) and radio continuum (1.4 GHz) luminosities, Izotova et al. (2000) derived the SFRs of 27 BCGs, with a mean of about 18 M⊙ yr-1. Using spectroscopically derived Hβ luminosities, Popescu et al. (1999) determined the SFRs of a sample of BCGs, with a mean SFR of about 0.5 M⊙ yr-1. Therefore, the values available in the literature suggest that the mean SFRs given in the existing investigations vary over two orders of magnitude. It is therefore not clear whether and to what extent the wide range of BCG SFRs results from the use of different techniques, or sample selections, employed in the available studies.
In this section, we have determined the SFRs of 72 blue compact galaxies, using the H, [O ii]3727 emission line fluxes, the IRAS, and the 1.4 GHz radio continuum luminosities. Since we have determined the SFRs for our homogeneous BCG sample, and calculated the median SFR of the sample using these different SFR indicators, it can be used to understand the reasons for these discrepancies in the literature.
Fig. 2 shows that the SFRs derived from different star formation indicators cover almost four orders of magnitude, from to M⊙ yr-1. After correcting for the underlying stellar absorption and the dust extinction effects, the SFR of each galaxy derived from those different SFR indicators is similar. Using different techniques will not result a large different median SFR of galaxies if we have observed the same sample galaxies over the entire wavelength bands.
From Fig. 2, we also found that the medium and average SFRs from these different indicators of our sample galaxies are different; values derived from the IR and radio data are much larger than those derived from the optical emission lines. Therefore, the sample selection effect is an important reason for the different mean SFR of BCGs in the literature. This can be explained by: the positional accuracy of far-infrared observation being not good, therefore, it is difficult to identify an object with weak IR emission. On the opposite side, radio observations typically have better positional accuracy, but the detector in the radio band is not sensitive. Therefore both far-infrared and radio observations are difficult to use to identify an objects with weak star formation activity; these survey are biased towards the galaxies with high SFRs, and the mean values of these survey samples are larger than those of optical observations.
4 Comparison of SFRs derived using different standard estimators
We have applied the commonly used SFR estimators to the 72 star-forming BCGs in our sample. In this section, we will investigate the SFR relation from these different standard estimators and the underlying reason for their discrepancies.
4.1 and
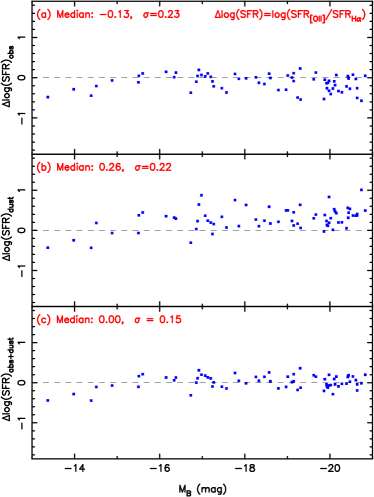
Figure 3 shows the logarithmic difference between and for the 72 BCG in our sample as a function of the B-band absolute magnitude, . In each panel, we indicate the median offset and the rms scatter.
In Fig. 3a, and were calculated with equations (1), (2) and the observed and data, where the underlying stellar absorption and the internal extinction were not corrected. Fig. 3a is consistent with the recent result by Charlot et al. (2002) that bright galaxies tend to have lower [O ii]/H ratios than less luminous galaxies. We find that, for mag, [O ii]3727-derived SFR estimates are typically 30 per cent smaller than H-derived ones, while at fainter magnitudes, the two estimators give similar results. At fixed magnitude, the rms scatter in / is a factor of . The scatter in this plot and the weak trend with magnitude can probably be explained by variations in the effective gas parameters (ionization, metallicity, dust content) of the galaxies.
In Fig. 3b, SFRs were calculated from the and data for which the internal extinction was corrected by , which was determined by the observed HH of the galaxy (the underlying stellar absorption was not subtracted). In star-forming galaxies, the Balmer emission lines from the ionized gas appear superimposed on the stellar absorption lines; this effect grows in importance towards the higher order Balmer lines, and the result is an underestimate of the emitted fluxes and an overestimate of the internal extinction, as show in Fig. 1. This overestimated internal extinction correction makes the [O ii]3727-derived SFR estimates typically a factor of higher than H-derived ones.
In Fig. 3c, the and were determined by the and , where the underlying stellar absorption was subtracted and the internal extinction was corrected. The SFR of BCGs from and have an excellent match, which can be understood easily since we derived the formula (equation 2) from the relation between and . In Fig. 3c the rms scatter in / becomes smaller, about 1.4. The 3 low luminosity BCGs are unaffected by stellar absorption and extinction. This is because: 1) They are low metallicity galaxies, and have a small dust component. The effect of internal extinction is not important for them. 2) They appear dominated by a recent burst of star formation, which causes their extremely strong emission line spectrum. The underlying stellar absorption is much weaker than the emission component. In addition, the correlation between and derived from the whole sample (most of them are high luminosity galaxies) is not good for these low metallicity galaxies, and may underestimate the for low luminosity galaxies.
4.2 and
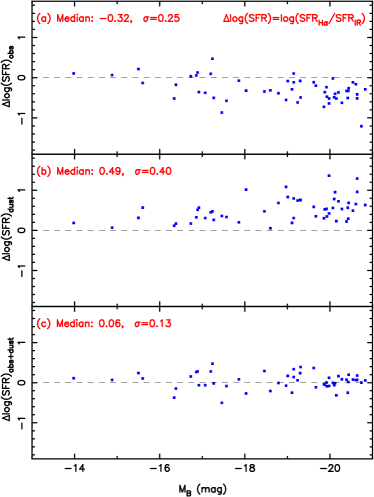
Figure 4 shows the logarithmic difference between and for 58 BCGs (IRAS data are available) in our sample as a function of .
In Fig. 4a, was derived from equation (3), was calculated with equation (1) and the observed H luminosity data, . The underlying stellar absorption and the internal extinction were not corrected in the observed H luminosity data in this panel. We find the difference between the SFRs estimated using and those estimated using the total FIR luminosity is large. The SFRs derived using H are lower than those obtained using . The median discrepancy tends to increase with B-band absolute luminosity and amounts to a factor of 2 at . The discrepancy and the scatter is similar to the SFRs derived using [O ii]3727. The median and the standard deviation of the logarithmic difference between and for 58 BCGs in our sample is , which similar to (or a little smaller than) that of Charlot et al. (2002) () and of Rosa-González et al. (2002) ().
In Fig. 4b, was calculated from the data with the internal extinction corrected by (see Fig. 1 for more detail). Since the effect of the underlying stellar absorption was not considered, the median of the is about 1.9, which is much larger than the median of the intrinsic internal extinction value () of galaxies. The internal extinction value of galaxies was overestimated; it makes the differences between the SFRs estimated using optical lines and those estimated using the total IR luminosities greater. Fig. 4b shows that H-derived SFR estimates are typically a factor of higher than -derived ones.
For the galaxies in our sample, the mean of the equivalent width of H-Balmer absorption corresponds to Å Å (Kong et al. 2003), which is consistent with the results from Bruzual & Charlot(2003), . The correction for stellar absorption is therefore quite important for galaxies with narrow observed H emission equivalent widths. This is shown in Fig. 4c, where we corrected the H-derived SFRs of individual galaxies in our sample for both the underlying stellar absorption and the interstellar dust extinction (using ). These corrections bring the H-derived SFRs into agreement with the -derived SFRs.
The median and the standard deviation of the logarithmic difference between and for 58 BCGs in our sample is . Our results agree with those of Rosa-González et al. (2002), and also Charlot et al. (2002). Rosa-González et al. (2002) developed a method to estimate simultaneously the intrinsic visual extinction and the underlying Balmer absorption. The values of were applied to the emission line fluxes. They also found that the extinction correction which includes the effects of an underlying stellar Balmer absorption brings into agreement and .
4.3 and
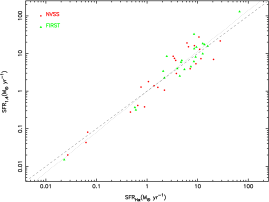
Figure 5 shows the comparison between SFRs derived from 1.4 GHz (FIRST and NVSS) and the H luminosities. If the underlying absorption and dust extinction were not corrected for, the trend between the and is similar to that of and (see Fig. 4a, b), since the radio luminosities and the IR luminosities have a tight correlation. We show the estimated SFRs derived from H luminosities, with the underlying stellar absorption and the internal dust extinction corrections, as a function of in Figure 5 only.
The Spearman rank correlation coefficient is for the relation between and ; this implies that the correlation between and is significant at the level. This correlation has been reported by other authors for both the case of nearby galaxies (such as Afonso et al. 2003; Hopkins et al. 2003) and for more distant galaxies (Flores et al. 2004). Another interesting point about this relation is that bright galaxies (high SFRs) tend to have higher / ratios than less luminous galaxies. This can be seen clearly from the one-to-one line (dashed line) and the ordinary least squares fit line (dotted line). For those galaxies with M⊙ yr-1, SFRs derived from 1.4 GHz radio luminosities are less than those derived from H luminosities; the probable reason for this is that the detector in radio band is not sensitive, and the uncertainty for those faint galaxy observations is large. The deviation at high radio luminosities, as well as the increasing scatter in the correlation, could result from a relatively large amount of extinction in those objects undergoing the most vigorous star formation, from the absorption of Lyman photons by dust, or from an IMF that weights differently the high-mass stars mainly responsible for H and the lower mass stars that dominate the supernova numbers (Cram et al. 1998).
In this section, after comparing with and ; and , we found that subtracting the underlying stellar absorption is very important to determine the internal dust extinction, and also in estimating the SFRs of galaxies, especially high luminosity galaxies. Without the underlying stellar absorption and the internal dust extinction correction, the SFRs estimated with IR and radio luminosities are larger than those derived from optical spectral lines (). This result is consistent with what has been found and shown in Madau-type plots in recent years, where the SFRs obtained from UV and optical data are much lower than that obtained from mm and submm observations at intermediate and high redshifts. In order to reach agreement between both determinations, fixed (and somehow arbitrary) amounts of extinction have been applied to the UV/optical data, because at the moment, the intermediate and high redshift samples do not allow a reliable determination of the dust extinction (Rosa-González et al. 2002). If the underlying Balmer absorption was not subtracted, the dust extinction from Balmer lines (such as H, H) would be overestimated. The and show a clear excess and the excess is much larger for than for (). After taking into account the corrections for Balmer absorptions and dust extinction, the SFRs in the optical with those in the FIR and radio show a very good agreement.
5 Discussion
5.1 Gas depletion timescales

The star formation history of BCGs is still an open question, BCGs are either genuinely young galaxies, or old galaxies that have resumed forming stars at a prodigious rate. In the third paper of this series (Kong et al. 2003), using a technique of empirical population synthesis based on a library of observed star cluster spectra, we find that BCGs are typically age-composite stellar systems; in addition to young stellar populations, intermediate-age and old stellar populations contribute significantly to the 5870 Å continuum emission of most galaxies in our sample. Since all BCGs have been found to contain a population of old stars, our results suggest that BCGs are primarily old galaxies with discontinuous star formation histories.
Since the galaxies in our sample were selected from some large neutral hydrogen (H i) surveys (Gordon & Gottesman 1981; Thuan & Martin 1981), the H i gas mass () of our sample galaxies was measured by these H i surveys. The SFR of our sample galaxies were measured in Sec. 3, using the H, [O ii]3727 emission lines, far-infrared, and radio luminosities. Therefore, we can calculate the gas depletion time-scale of BCGs, obtained by dividing the available gas mass by the present SFR:
| (5) |
where is the total H i mass content and SFR is the ongoing star formation rate.
Figure 6 shows the distribution of gas depletion timescales for the galaxies in our sample. Most galaxies are consuming their interstellar gas at a rate which can only be sustained for another few billion years. The median value of the gas depletion time-scale of BCGs is less than or about one billion years, and the gas depletion time-scale of BCGs is generally much shorter than the age of the universe. It indicates that star formation in BCGs could be sustained at the current level only on a time scale significantly lower than (cosmological time) before their neutral gas reservoir will be completely depleted.
To understand the evolutionary connection between blue compact star-forming galaxies observed at intermediate redshifts () and nearby blue compact galaxies, Pisano et al. (2001) have compared Arecibo H i 21 cm spectroscopy and Keck HIRES spectroscopy of 11 nearby blue compact galaxies. Using the and the H i mass, they calculated the gas depletion timescale, , of each galaxy. The SFRs of BCGs range from 0.2323.5 M⊙ yr-1, and gas depletion timescales range from 0.187.29 Gyr. Using the optical spectroscopy, deep optical/near-IR photometry of 4 luminous blue compact galaxies, and spectral evolutionary models, Bergvall & Östlin (2002) concluded that star formation in luminous BCGs is intense, corresponding to gas depletion timescales of the order of 100 Myr. Our results are consistent with those works: the luminous BCGs have shorter gas depletion timescale, and the typical gas depletion timescale of BCG is about a few billion years.
Based on surface photometry and spectroscopic analysis, most of BCGs have been found to contain a population of old stars. Based on the gas depletion estimation, the high star formation activities of BCGs must be transient. Therefore, the general star formation history of BCGs is that these galaxies undergo a few or several short bursts of star formation followed by longer more quiescent periods.
5.2 SFRs versus MB
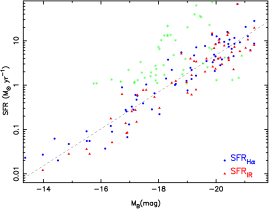
Figure 7 shows the SFR against absolute B-band magnitude for BCGs; the SFRs were derived from the H (circles) and from IR (triangles) luminosities, and were taken from Kong & Cheng (2002a). There is a trend between B-band magnitude and SFR of BCGs, the Spearman Rank correlation coefficient being . The higher SFRs are clearly being hosted by galaxies with higher luminosities although there is a significant scatter in the trend. The least-squares fit of these data, shown by the dash line, yields an increased SFR towards high luminosity galaxies, . This relation implies that the SFR per solar luminosity in BCGs is constant over a range of 7 magnitudes.
In Kong et al. (2004), the authors have compiled an ultraviolet-selected sample of 115 nearby, non-Seyfert galaxies spanning a wide range of star formation activities, from starburst to nearly dormant, based on observations with various ultraviolet satellites. To check the correlation between SFR and for other galaxy types, we over-plot these galaxies in Figure 7 as stars. IRAS flux densities , and were used to estimate the total far-infrared flux and . The apparent blue magnitudes from De Vaucouleurs et al. (1991) and the redshift from the NASA/IPAC Extragalactic Database (NED) were used to calculate the absolute B-band magnitudes. From Figure 7, we found there is a scattered but good correlation between the and the SFR of other galaxy types. Starburst galaxies lie substantially above the relation for BCGs, and the less vigorously star forming galaxies are located in the region below this relation. Our results are consistent with the much large sample of SDSS galaxies studied by Brinchmann et al. (2004): they found a clear correlation between SFR and stellar mass (luminosity) over a significant range in log .
While optical spectral line fluxes, UV, IR, and radio luminosity are commonly used as SFR indicators, the luminosity at B-band wavelengths is also dominated in starburst galaxies by young stellar populations. In the absence of other observations, the B-band luminosity may thus be used as an SFR indicator for nearby large-area image surveys (such as SDSS) and deep image surveys (such as COSMOS and Subaru Deep Field , Ouchi et al. 2003). BCGs can be selected according to their compactness and blue colors from images in these surveys, and the best-fit relation between and SFR can be used to estimate the SFR of BCG. The SFR based on is not very accuracy, since the scatter for the and SFR relation is large.
5.3 SFRs and dust extinction
Star forming galaxies in the local universe have been shown to exhibit a correlation between obscuration and FIR luminosity (Wang & Heckman 1996). This implies that the obscuration in a galaxy is related to its SFR. This same general effect can also be seen in other recent studies (such as Takagi, Arimoto & Hanami 2003). Buat et al. (2002) found a good relation between the extinction in the H line and the FIR luminosity for starburst galaxies. Hopkins et al. (2001) and Sullivan et al. (2001) report a positive correlation between the dust extinction traced by the Balmer decrement and the SFR of the galaxies traced by their total FIR or H luminosities.
Figure 8 shows the correlation between the dust extinction () and the SFR of BCGs in our sample. Using the data of and , we perform a least squares fit to the and to derive . The Spearman Rank correlation coefficient between and SFR is 0.62. There is a clear trend between the dust extinction and the SFR of BCGs; the value of SFR increases with . We see evidence for a strong correlation between SFR and metallicity (in the next subsection), presumably reflecting a correlation between metallicity and dust content. The correlation between SFR and dust may simply reflect a more fundamental correlation between dust and metallicity. This question clearly merits further investigation. The scatter in these trends may be related to intrinsic differences within galaxy populations. Because greater SFRs correspond to greater extinction in the dust, then the SFRs of high redshift galaxies derived from either Balmer fluxes or from UV continuum measurements would tend to be systematically underestimated, if the dust extinction were not corrected. Since the dispersion between the dust extinction and the SFR of BCGs is large, the situation is worse for these low extinction galaxies (most BCGs have low ). This relation cannot be used to estimate the amount of dust extinction in BCGs.

5.4 SFRs vs. Metallicity
Figure 9 shows the correlation between oxygen abundance and SFR. The oxygen abundance of BCGs was estimated by the N2 = [N ii]6584Å/H estimator from the results of Denicoló, Terlevich & Terlevich (2002). These authors found that the N2 estimator follows a linear relation with log(O/H) that holds for a wide abundance range, from about to twice the Solar value. A positive trend of 12+log(O/H) with and can be seen, in the sense that galaxies with higher global SFRs also show higher oxygen abundance. The Spearman Rank correlation coefficient for this correlation is 0.67, an unweighted linear regression yields .
Zaritsky, Kennicutt & Huchra (1994) found the luminosity (mass)-metallicity relationship exists over a large range of luminosity, galaxy type, and metallicity. A similar relationship was seen for BCGs in our sample (see Fig. 9 in Kong et al. 2002). This correlation reflects the fundamental role that galaxy mass plays in galactic chemical evolution. With the luminosity and SFR correlation (see Figure 7), the most straightforward interpretation of the correlation between SFRs and metallicity is that more massive galaxies form fractionally more stars in a Hubble time (higher SFR) than low-mass galaxies, and then have higher metallicity. From Figure 9, we also found that the slope of the SFR and metallicity relation for these low-mass galaxies increases more quickly and the slope of the more massive galaxies increases more slowly. It can probably be explained as in massive galaxies, which are already relatively metal rich, it is more difficult to significantly alter than it would be in a low-mass, low-metallicity galaxy.

6 Summary
In this paper, we have determined the star formation rates and gas depletion timescales of 72 blue compact galaxies and investigated the source of the discrepancies between these different SFR indicators. Then we analyzed the correlation between the star formation rate and the absolute B-band magnitude, dust extinction and metallicity for the star-forming BCGs in our sample.
Our main results are:
-
1.
The SFRs derived from the H, [O ii]3727 emission lines, the IRAS, and the 1.4 GHz radio luminosities show that the SFR of BCGs cover almost four orders of magnitude, from to M⊙ yr-1.
-
2.
The medium and average SFRs from these different indicators for our sample galaxies are different. The values derived from IR and radio continuum data are much larger than those derived from emission lines in the optical spectrum. The sample selection effect is important for the different mean SFRs of BCGs in the literature, determined using different SFR indicators.
-
3.
Subtracting the underlying stellar absorption is very important when calculating both the dust extinction and , . Otherwise, the intrinsic extinction will be overestimated or underestimated; star formation rates derived using [O ii]3727, H, and IR have large discrepancies.
-
4.
The gas depletion time-scale of BCGs is generally much shorter than the age of the universe. Star formation in BCGs could be sustained at the current level only on a time scale significantly lower than the cosmological time before their neutral gas reservoir will be completely depleted.
-
5.
There are some good correlations between the SFR and the absolute B-band magnitude, dust extinction and metallicity for the star-forming BCGs. The galaxies with lower luminosity have lower metallicity, lower dust extinction and lower SFR.
Acknowledgements.
I thank the anonymous referee, S. Charlot and R. Kennicutt for their helpful comments and highly constructive suggestions. I am especially grateful to F.Z. Cheng for his valuable discussions and spectroscopic co-observation. This work is based on observations made with the 2.16m telescope of the National Astronomical Observatory of China and supported by the Chinese National Natural Science Foundation (CNNSF 10073009). XK acknowledges support provided by the Alexander von Humboldt Foundation of Germany and the Japan Society for the Promotion of Science (JSPS).References
- Afonso et al. (2003) Afonso, J., Hopkins, A., Mobasher, B., et al. 2003, ApJ, 597, 269
- Bergvall & Östlin (2002) Bergvall, N., & Östlin, G. 2002, A&A, 390, 891
- Bessell (1979) Bessell, M. S. 1979, PASP, 91, 589
- Bica & Alloin (1986) Bica, E. & Alloin, D. 1986, A&A, 162, 21
- Brinchmann et al. . (2003) Brinchmann, J., Charlot, S., White, S. D. M., et al. 2003, astro-ph/0311060
- Bruzual & Charlot (2003) Bruzual, G. & Charlot, S. 2003, MNRAS, 344, 1000
- Buat et al. (2002) Buat, V., Boselli, A., Gavazzi, G., et al. 2002, A&A, 383, 801
- Cairós et al. (2001) Cairós, L. M., Vílchez, J. M., González Pérez, J. N., et al. 2001, ApJS, 133, 321
- Calzetti (2001) Calzetti, D. 2001, PASP, 113, 1449
- Carter et al. (2001) Carter, B. J., Fabricant, D. G., Geller, M. J., et al. 2001, ApJ, 559, 606
- Charlot & Fall (2000) Charlot, S. & Fall, S. M. 2000, ApJ, 539, 718
- Charlot & Longhetti (2001) Charlot, S. & Longhetti, M. 2001, MNRAS, 323, 887
- Charlot et al. (2002) Charlot, S., Kauffmann, G., Longhetti, M., et al. 2002, MNRAS, 330, 876
- Cid Fernandes et al. (2001) Cid Fernandes, R., Sodré, L., Schmitt, H. R., et al. 2001, MNRAS, 325, 60
- Condon (1992) Condon, J. J. 1992, ARA&A, 30, 575
- Condon et al. (1998) Condon, J. J., Cotton, W. D., Greisen, E. W., et al. 1998, AJ, 115, 1693
- Cram et al. (1998) Cram, L., Hopkins, A., Mobasher, B., et al. 1998, ApJ, 507, 155
- Dale & Helou (2002) Dale, D. A. & Helou, G. 2002, ApJ, 576, 159
- Denicoló, Terlevich, & Terlevich (2002) Denicoló, G., Terlevich, R., & Terlevich, E. 2002, MNRAS, 330, 69
- de Vaucouleurs et al. (1991) de Vaucouleurs, G., de Vaucouleurs, A., Corwin, J. R., et al. 1991, “Third reference catalogue of Bright galaxies,” (New York: Springer-Verlag)
- Doublier et al. (1997) Doublier, V., Comte, G., Petrosian, A., et al. 1997, A&AS, 124, 405
- Gallagher, Hunter, & Bushouse (1989) Gallagher, J. S., Hunter, D. A., & Bushouse, H. 1989, AJ, 97, 700
- Gallego et al. (1995) Gallego, J., Zamorano, J., Aragon-Salamanca, A., & Rego, M. 1995, ApJ, 455, L1
- Gallego et al. (1996) Gallego, J., Zamorano, J., Rego, M., et al. 1996, A&AS, 120, 323
- Gil de Paz et al. (2003) Gil de Paz, A., Madore, B. F., & Pevunova, O. 2003, ApJS, 147, 29
- Gordon & Gottesman (1981) Gordon, D., & Gottesman, T. S. 1981, AJ, 86, 161
- Flores et al. (2004) Flores, H., Hammer, F., Elbaz, D., et al. 2004, A&A, 415, 885
- Guzmán et al. (1996) Guzmán, R., Koo, D. C., Faber, S. M., et al. 1996, ApJ, 460, L5
- Guzmán et al. (1997) Guzmán, R., Gallego, J., Koo, D. C., et al. 1997, ApJ, 489, 559
- Guzmán et al. (2003) Guzmán, R., Östlin, G., Kunth, D., et al. 2003, ApJ, 586, L45
- Hammer et al. (2001) Hammer, F., Gruel, N., Thuan, T. X., et al. 2001, ApJ, 550, 570
- Helou et al. (1985) Helou, G., Soifer, B. T., Rowan-Robinson, M., 1985, ApJ, 298, L7
- Hippelein et al. (2003) Hippelein, H., Maier, C., Meisenheimer, K., et al. 2003, A&A, 402, 65
- Hopkins et al. (2001) Hopkins, A., Connolly, A., Haarsma, D., Cram, L. 2001, AJ, 122, 288
- Hopkins et al. (2003) Hopkins, A. M., et al. 2003, ApJ, 599, 971
- Izotova et al. (2000) Izotova, I., Parnovskya, S., Izotov, Y. 2000, NewAR, 44, 283
- Kennicutt (1992) Kennicutt, R. C. 1992, ApJ, 388, 310
- Kennicutt (1998) Kennicutt, R. C. 1998, ARA&A, 36, 189
- Kewley et al. (2002) Kewley, L. J., Geller, M. J., Jansen, R. A., et al. 2002, AJ, 124, 3135
- (40) Kong, X., & Cheng, F. Z. 2002a, A&A, 389, 845
- (41) Kong, X., Cheng, F. Z., Weiss, A., & Charlot, S. 2002b, A&A, 396, 503
- Kong et al. (2003) Kong, X., Charlot, S., Weiss, A., & Cheng, F. Z. 2003, A&A, 403, 877
- Kong, Charlot, Brinchmann, & Fall (2004) Kong, X., Charlot, S., Brinchmann, J., & Fall, S. M. 2004, MNRAS, 349, 769
- Kunth & Östlin (2000) Kunth, D., & Östlin G., 2000, A&A Rev., 10, 1
- MacAlpine, Smith, & Lewis (1977) MacAlpine, G. M., Smith, S. B., & Lewis, D. W. 1977, ApJS, 34, 95
- Madau et al. (1996) Madau, P., Ferguson, H. C., Dickinson, M. E., et al. 1996, MNRAS, 283, 1388
- Moshir et al. (1992) Moshir, M., et al. 1992, Explanatory Supplement to the IRAS Faint Source Survey, Version 2 (JPL D-10015; Pasadena: Jet Propulsion Laboratory) (FSC)
- Östlin et al. (1999) Östlin, G., Amram, P., Masegosa, J., et al. 1999, A&AS, 137, 419
- Ouchi et al. (2003) Ouchi, M., et al. 2003, ApJ, 582, 60
- Papaderos et al. (1996) Papaderos, P., Loose, H.-H., Thuan, T. X., et al. 1996, A&AS, 120, 207
- Pettini et al. (1998) Pettini, M., Kellogg, M., Steidel, C. C., et al. 1998, ApJ, 508, 539
- Phillips et al. (1997) Phillips, A. C., Guzmán, R., Gallego, J., et al. 1997, ApJ, 489, 543
- Pisano et al. (2001) Pisano, D. J., Kobulnicky, H. A., Guzmán, R., et al. 2001, AJ, 122, 1194
- Popescu et al. (1999) Popescu, C. C., Hopp, U., Rosa, M. R. 1999, A&AS, 350, 414
- Rosa-González et al. (2002) Rosa-González, D., Terlevich, E., & Terlevich, R. 2002, MNRAS, 332, 283
- Salzer et al. (1989) Salzer, J. J., MacAlpine, G. M., & Boroson, T. A. 1989, ApJS, 70, 447
- Salzer et al. (2000) Salzer, J. J., et al. 2000, AJ, 120, 80
- Sanders & Mirabel (1996) Sanders, D. B. & Mirabel, I. F. 1996, ARA&A, 34, 749
- Spergel et al. (2003) Spergel, D. N. et al. 2003, ApJS, 148, 175
- Steidel et al. (1999) Steidel, C. C., Adelberger, K. L., Giavalisco, M., et al. 1999, ApJ, 519, 1
- Sullivan et al. (2001) Sullivan, M., Mobasher, B., Chan, B., et al. 2001, ApJ, 558, 72
- Takagi, Arimoto, & Hanami (2003) Takagi, T., Arimoto, N., & Hanami, H. 2003, MNRAS, 340, 813
- Terlevich et al. (1991) Terlevich, R., Melnick, J., Masegosa, J., et al. 1991, A&AS,91, 285
- Thuan & Martin (1981) Thuan, T. X. & Martin, G. E. 1981, ApJ, 247, 823
- Vitores et al. (1996) Vitores, A. G., Zamorano, J., Rego, M., et al. 1996, A&AS, 118, 7
- Wang & Heckman (1996) Wang, B., Heckman, T. M. 1996, ApJ, 457, 645
- White et al. (1997) White, R. L., Becker, R. H., Helfand, D. J., et al. 1997, ApJ, 475, 479
- Yun, Reddy, & Condon (2001) Yun, M. S., Reddy, N. A., & Condon, J. J. 2001, ApJ, 554, 803
- Zamorano et al. (1994) Zamorano, J., Rego, M., Gallego, J. G., et al. 1994, ApJS, 95, 387
- Zamorano et al. (1996) Zamorano, J., Gallego, J., Rego, M., et al. 1996, ApJS, 105, 343
- Zaritsky, Kennicutt, & Huchra (1994) Zaritsky, D., Kennicutt, R. C., & Huchra, J. P. 1994, ApJ, 420, 87
| Name | RA(J2000) | Dec(J2000) | SFR () | M(HI) | (Gyr) | |||||||
|---|---|---|---|---|---|---|---|---|---|---|---|---|
| Name | (h:m:s) | (∘:′ : ′′) | [OII] | H | IR | 1.4GHz | () | [OII] | H | IR | 1.4GHz | (mag) |
| iiizw12 | 00:47:56.5 | +22:22:23 | 4.913 | 3.484 | 3.953 | 7.413 | .300E+10 | 0.611 | 0.863 | 0.760 | 0.405 | -19.665 |
| haro15 | 00:48:35.4 | -12:42:59 | 8.188 | 6.155 | 5.991 | 19.061 | .554E+10 | 0.676 | 0.899 | 0.925 | 0.290 | -21.192 |
| iiizw33 | 01:43:56.5 | +17:03:43 | 14.604 | 9.249 | 5.789 | 5.333 | .820E+10 | 0.561 | 0.887 | 1.416 | 1.538 | -20.827 |
| vzw155 | 01:57:49.4 | +27:51:56 | 18.089 | 20.624 | 6.907 | 6.957 | .000E+00 | 0.000 | 0.000 | 0.000 | 0.000 | -21.027 |
| iiizw42 | 02:11:33.5 | +13:55:02 | 7.472 | 11.622 | 7.253 | 7.294 | .161E+10 | 0.216 | 0.139 | 0.222 | 0.221 | -20.637 |
| iiizw43 | 02:13:45.0 | +04:06:07 | 5.369 | 7.127 | 3.387 | 3.934 | .101E+10 | 0.188 | 0.142 | 0.298 | 0.257 | -19.310 |
| iizw23 | 04:49:44.4 | +03:20:03 | 26.118 | 28.047 | 19.512 | 21.548 | .172E+11 | 0.659 | 0.614 | 0.881 | 0.800 | -21.327 |
| iizw28 | 05:01:42.0 | +03:34:28 | 3.984 | 2.807 | 4.156 | 0.000 | .000E+00 | 0.000 | 0.000 | 0.000 | 0.000 | -20.145 |
| iizw33 | 05:10:48.1 | -02:40:54 | 3.746 | 1.635 | 0.791 | 1.257 | .171E+10 | 0.456 | 1.050 | 2.163 | 1.358 | -19.302 |
| iizw40 | 05:55:42.8 | +03:23:30 | 0.432 | 0.891 | 0.624 | 0.381 | .349E+09 | 0.807 | 0.392 | 0.560 | 0.916 | -16.731 |
| mrk5 | 06:42:15.5 | +75:37:32 | 0.072 | 0.091 | 0.036 | 0.000 | .130E+09 | 1.807 | 1.429 | 3.614 | 0.000 | -15.499 |
| viizw153 | 07:28:12.0 | +72:34:29 | 2.249 | 1.375 | 0.607 | 1.392 | .345E+10 | 1.535 | 2.500 | 5.689 | 2.483 | -19.147 |
| viizw156 | 07:29:25.4 | +72:07:44 | 3.363 | 3.685 | 3.645 | 6.552 | .460E+10 | 1.368 | 1.250 | 1.265 | 0.703 | -19.925 |
| haro1 | 07:36:56.4 | +35:14:31 | 11.997 | 12.637 | 10.607 | 18.370 | .604E+10 | 0.504 | 0.480 | 0.570 | 0.328 | -21.105 |
| mrk385 | 08:03:28.0 | +25:06:10 | 7.768 | 8.549 | 7.219 | 13.437 | .105E+10 | 0.135 | 0.123 | 0.146 | 0.078 | -20.637 |
| mrk390 | 08:35:33.1 | +30:32:03 | 11.333 | 7.361 | 3.641 | 4.475 | .657E+10 | 0.581 | 0.893 | 1.803 | 1.469 | -20.442 |
| zw0855 | 08:58:27.4 | +06:19:41 | 4.196 | 3.750 | 0.000 | 0.000 | .816E+09 | 0.194 | 0.218 | 0.000 | 0.000 | -18.330 |
| mrk105 | 09:20:26.3 | +71:24:16 | 0.746 | 1.034 | 0.780 | 0.000 | .000E+00 | 0.000 | 0.000 | 0.000 | 0.000 | -17.571 |
| izw18 | 09:34:02.0 | +55:14:28 | 0.022 | 0.062 | 0.000 | 0.043 | .905E+08 | 4.112 | 1.459 | 0.000 | 2.104 | -14.387 |
| mrk402 | 09:35:19.2 | +30:24:31 | 11.738 | 7.626 | 2.009 | 0.000 | .291E+10 | 0.249 | 0.381 | 1.449 | 0.000 | -19.616 |
| haro22 | 09:50:11.0 | +28:00:47 | 0.119 | 0.089 | 0.051 | 0.000 | .256E+09 | 2.153 | 2.877 | 5.023 | 0.000 | -16.384 |
| haro23 | 10:06:18.1 | +28:56:40 | 0.330 | 0.256 | 0.082 | 0.000 | .618E+08 | 0.187 | 0.242 | 0.753 | 0.000 | -16.885 |
| iizw44 | 10:15:14.7 | +21:06:34 | 3.970 | 5.481 | 5.124 | 3.771 | .118E+11 | 2.972 | 2.153 | 2.307 | 3.133 | -18.792 |
| haro2 | 10:32:31.9 | +54:24:03 | 3.097 | 2.207 | 1.127 | 1.060 | .520E+09 | 0.168 | 0.236 | 0.460 | 0.491 | -18.461 |
| mrk148 | 10:35:34.8 | +44:18:57 | 6.994 | 4.438 | 2.329 | 2.522 | .196E+10 | 0.281 | 0.442 | 0.841 | 0.778 | -19.981 |
| haro3 | 10:45:22.4 | +55:57:37 | 0.731 | 0.655 | 0.538 | 0.415 | .563E+09 | 0.771 | 0.859 | 1.047 | 1.355 | -17.858 |
| haro25 | 10:48:44.2 | +26:03:12 | 15.048 | 15.829 | 13.315 | 15.759 | .574E+10 | 0.383 | 0.363 | 0.432 | 0.363 | -20.392 |
| mrk1267 | 10:53:03.9 | +04:37:54 | 1.571 | 2.083 | 0.000 | 3.392 | .000E+00 | 0.000 | 0.000 | 0.000 | 0.000 | -19.955 |
| haro4 | 11:04:58.5 | +29:08:22 | 0.014 | 0.027 | 0.012 | 0.020 | .190E+08 | 1.358 | 0.703 | 1.585 | 0.951 | -13.978 |
| mrk169 | 11:26:44.4 | +59:09:20 | 0.588 | 0.575 | 0.597 | 0.368 | .522E+09 | 0.887 | 0.908 | 0.875 | 1.419 | -17.265 |
| haro27 | 11:40:24.8 | +28:22:26 | 0.496 | 0.284 | 0.000 | 0.000 | .231E+09 | 0.466 | 0.813 | 0.000 | 0.000 | -17.771 |
| mrk201 | 12:14:09.7 | +54:31:38 | 8.530 | 13.625 | 14.818 | 17.316 | .750E+09 | 0.088 | 0.055 | 0.051 | 0.043 | -19.860 |
| haro28 | 12:15:46.1 | +48:07:54 | 0.137 | 0.067 | 0.085 | 0.081 | .215E+09 | 1.570 | 3.206 | 2.529 | 2.655 | -16.917 |
| haro8 | 12:19:09.9 | +03:51:21 | 0.278 | 0.277 | 0.138 | 0.000 | .174E+09 | 0.627 | 0.628 | 1.262 | 0.000 | -16.858 |
| haro29 | 12:26:16.0 | +48:29:37 | 0.008 | 0.023 | 0.000 | 0.015 | .504E+08 | 6.295 | 2.193 | 0.000 | 3.357 | -13.366 |
| mrk213 | 12:31:22.2 | +57:57:52 | 2.047 | 3.946 | 3.954 | 3.980 | .308E+10 | 1.503 | 0.780 | 0.780 | 0.774 | -20.071 |
| mrk215 | 12:32:34.7 | +45:46:04 | 11.041 | 12.618 | 0.000 | 9.867 | .000E+00 | 0.000 | 0.000 | 0.000 | 0.000 | -20.018 |
| haro32 | 12:43:48.6 | +54:54:02 | 6.237 | 4.180 | 3.988 | 0.000 | .882E+10 | 1.413 | 2.109 | 2.208 | 0.000 | -20.430 |
| haro33 | 12:44:38.3 | +28:28:19 | 0.090 | 0.055 | 0.028 | 0.000 | .198E+09 | 2.198 | 3.597 | 7.079 | 0.000 | -15.605 |
| haro34 | 12:45:06.6 | +21:10:10 | 7.219 | 8.426 | 8.270 | 6.124 | .704E+10 | 0.975 | 0.836 | 0.851 | 1.151 | -19.982 |
| haro36 | 12:46:56.4 | +51:36:46 | 0.016 | 0.020 | 0.000 | 0.000 | .137E+09 | 8.570 | 6.855 | 0.000 | 0.000 | -14.505 |
| haro35 | 12:47:08.5 | +27:47:35 | 2.537 | 2.456 | 3.953 | 8.415 | .258E+10 | 1.016 | 1.050 | 0.653 | 0.307 | -19.108 |
| haro37 | 12:48:41.0 | +34:28:39 | 1.157 | 1.064 | 1.237 | 1.788 | .981E+09 | 0.845 | 0.925 | 0.791 | 0.548 | -18.599 |
| mrk57 | 12:58:37.2 | +27:10:34 | 4.030 | 3.287 | 2.599 | 8.436 | .222E+10 | 0.551 | 0.675 | 0.853 | 0.263 | -19.883 |
| mrk235 | 13:00:02.1 | +33:26:15 | 3.935 | 4.868 | 6.817 | 6.544 | .000E+00 | 0.000 | 0.000 | 0.000 | 0.000 | -19.930 |
| mrk241 | 13:06:19.8 | +32:58:25 | 3.102 | 4.686 | 3.468 | 5.874 | .195E+10 | 0.630 | 0.416 | 0.562 | 0.332 | -19.236 |
| izw53 | 13:13:57.7 | +35:18:55 | 0.309 | 0.388 | 0.771 | 0.000 | .100E+10 | 3.236 | 2.576 | 1.297 | 0.000 | -17.464 |
| izw56 | 13:20:35.3 | +34:08:22 | 65.419 | 67.364 | 66.927 | 129.683 | .000E+00 | 0.000 | 0.000 | 0.000 | 0.000 | -20.742 |
| haro38 | 13:35:35.6 | +29:13:01 | 0.080 | 0.055 | 0.000 | 0.000 | .884E+08 | 1.104 | 1.607 | 0.000 | 0.000 | -15.508 |
| mrk275 | 13:48:40.5 | +31:27:39 | 5.224 | 4.505 | 2.261 | 0.000 | .862E+10 | 1.652 | 1.910 | 3.811 | 0.000 | -20.607 |
| haro39 | 13:58:23.8 | +25:33:00 | 0.493 | 0.327 | 0.255 | 0.000 | .160E+10 | 3.243 | 4.898 | 6.281 | 0.000 | -17.070 |
| haro42 | 14:31:09.0 | +27:14:14 | 2.400 | 2.200 | 1.671 | 2.252 | .320E+10 | 1.334 | 1.455 | 1.914 | 1.422 | -19.151 |
| haro43 | 14:36:08.8 | +28:26:59 | 0.050 | 0.037 | 0.000 | 0.000 | .592E+09 | 11.830 | 15.996 | 0.000 | 0.000 | -16.147 |
| haro44 | 14:43:24.7 | +28:18:04 | 0.381 | 0.280 | 0.000 | 0.000 | .121E+10 | 3.177 | 4.325 | 0.000 | 0.000 | -17.128 |
| iizw70 | 14:50:56.5 | +35:34:18 | 0.379 | 0.469 | 0.148 | 0.277 | .328E+09 | 0.865 | 0.700 | 2.218 | 1.183 | -17.236 |
| iizw71 | 14:51:14.4 | +35:32:31 | 0.207 | 0.130 | 0.000 | 0.000 | .921E+09 | 4.446 | 7.079 | 0.000 | 0.000 | -16.976 |
| izw97 | 14:54:39.2 | +42:01:26 | 0.214 | 0.221 | 0.303 | 0.000 | .000E+00 | 0.000 | 0.000 | 0.000 | 0.000 | -18.032 |
| izw101 | 15:03:45.8 | +42:41:59 | 0.982 | 1.245 | 1.163 | 0.000 | .392E+10 | 3.990 | 3.133 | 3.381 | 0.000 | -18.973 |
| izw117 | 15:35:53.6 | +38:40:37 | 8.874 | 9.467 | 7.757 | 14.817 | .819E+10 | 0.923 | 0.865 | 1.054 | 0.553 | -20.282 |
| izw123 | 15:37:04.2 | +55:15:48 | 0.040 | 0.047 | 0.028 | 0.000 | .575E+08 | 1.439 | 1.225 | 2.056 | 0.000 | -14.882 |
| mrk297 | 16:05:12.9 | +20:32:32 | 11.812 | 8.483 | 15.084 | 32.678 | .516E+10 | 0.438 | 0.608 | 0.342 | 0.158 | -20.425 |
| izw159 | 16:35:21.1 | +52:12:53 | 0.773 | 0.601 | 0.273 | 0.316 | .174E+09 | 0.225 | 0.290 | 0.637 | 0.551 | -17.199 |
| izw166 | 16:48:24.1 | +48:42:33 | 11.310 | 9.131 | 10.478 | 8.069 | .000E+00 | 0.000 | 0.000 | 0.000 | 0.000 | -20.097 |
| mrk893 | 17:15:02.2 | +60:12:59 | 1.824 | 1.010 | 0.000 | 0.000 | .170E+10 | 0.933 | 1.683 | 0.000 | 0.000 | -18.574 |
| izw191 | 17:40:24.8 | +47:43:59 | 3.078 | 3.797 | 2.962 | 2.945 | .000E+00 | 0.000 | 0.000 | 0.000 | 0.000 | -20.202 |
| ivzw93 | 22:16:07.7 | +22:56:33 | 1.965 | 1.407 | 0.000 | 0.000 | .137E+10 | 0.695 | 0.973 | 0.000 | 0.000 | -18.262 |
| mrk303 | 22:16:26.8 | +16:28:17 | 11.272 | 10.609 | 0.000 | 27.405 | .516E+10 | 0.457 | 0.486 | 0.000 | 0.188 | -20.465 |
| zw2220 | 22:23:02.0 | +30:55:29 | 7.713 | 8.624 | 7.992 | 16.154 | .535E+10 | 0.693 | 0.621 | 0.670 | 0.330 | -21.322 |
| mrk314 | 23:02:59.2 | +16:36:19 | 1.072 | 0.759 | 0.670 | 1.280 | .278E+10 | 2.600 | 3.664 | 4.150 | 2.173 | -19.007 |
| ivzw142 | 23:20:03.1 | +26:12:58 | 9.980 | 10.963 | 9.130 | 12.901 | .256E+10 | 0.256 | 0.233 | 0.281 | 0.199 | -20.117 |
| ivzw149 | 23:27:41.2 | +23:35:21 | 9.456 | 6.591 | 5.509 | 15.087 | .101E+11 | 1.067 | 1.531 | 1.832 | 0.668 | -20.541 |
| zw2335 | 23:37:39.6 | +30:07:47 | 0.138 | 0.120 | 0.176 | 0.000 | .173E+09 | 1.253 | 1.442 | 0.984 | 0.000 | -16.342 |