Low-Energy Hadronic Interaction Models
Abstract
Different interaction models treating hadronic collisions below GeV in air shower simulations are compared within the frame of the CORSIKA program. Their behaviour is studied in isolated collisions of protons or pions with light-mass targets in comparison with experimental data. It is discussed how model properties influence air-shower parameters like the longitudinal profile or the lateral distribution of particles arriving at ground.
1 INTRODUCTION
In extensive air showers (EAS) induced by cosmic hadronic particles low-energy secondary hadrons collide with the atmospheric nuclei thus forming the final branches of the hadronic shower backbone. Recently Ref. [10] reported that in simulations the lateral particle distribution at core distances 1 km shows a strong dependence on the used low-energy hadronic interaction model. Therefore several codes describing low-energy interactions have been examined with the EAS simulation program CORSIKA [17] in the present study. Preliminary results are given in [19]. The used interaction codes are presented in Sect. 2. In Sect. 3 their predictions are compared with experimental results of single hadronic collisions with light targets close in mass to the atmospheric constituents. How the behaviour in single collisions transforms into measurable properties of EAS is discussed in Sect. 4. The consequences to simulations are exemplified in Sect. 5.
2 MODELS
Within this study the 4 codes FLUKA [14], GHEISHA [15], Hillas Splitting Algorithm [20], and UrQMD [6] are investigated in view of their application to low-energy (100 GeV) hadronic interactions within the EAS simulation program CORSIKA.
In some comparisons the high-energy interaction models DPMJET II.55 [24], neXus 3 [9], QGSJET 01 [21], or SIBYLL 2.1 [13] are included overstretching their recommended energy range to show up possible problems in the transition region around 80 GeV.
The hadronic event generator FLUKA 2002 [14] is used with CORSIKA only for the description of the inelastic interactions with laboratory energies below several 100 GeV. Within FLUKA these collisions are handled by different hadronic interaction models above, around, and below the nuclear resonance energy range. The capability of FLUKA for cosmic ray calculations has recently been demonstrated [7].
The GHEISHA [15] program successfully used in the detector Monte Carlo code GEANT3 [16] is called GHEISHA 600 within this study to distinguish it from version GHEISHA 2002 with modified kinematics using correction patches [8] which improve energy and momentum conservation.
The Hillas Splitting Algorithm (HSA) [20] is employed in the EAS simulation code AIRES [26, 27]. Its parametrizations are valid only for collisions with air which do not allow a direct comparison with experiments performed with other targets. The HSA has been linked with CORSIKA for test purposes only to add the results of these tests to the present comparison. It is not planned to make the HSA available within CORSIKA.
The Ultra-relativistic Quantum Molecular Dynamic (UrQMD 1.3) model [6] describes microscopically the projectile transport through the air target in tiny steps ( 0.2 fm) and follows collisions and/or scatterings on the hadron level. Nuclear resonance effects are considered in detail.
3 SINGLE COLLISIONS
All simulations presented in this section have been performed with the so-called ‘interactiontest’ option of CORSIKA to compare all interaction programs under equal conditions.
3.1 pp-collisions
The and -multiplicities in pp-collisions are shown in Fig. 1. Most of the displayed low-energy models follow the experimental
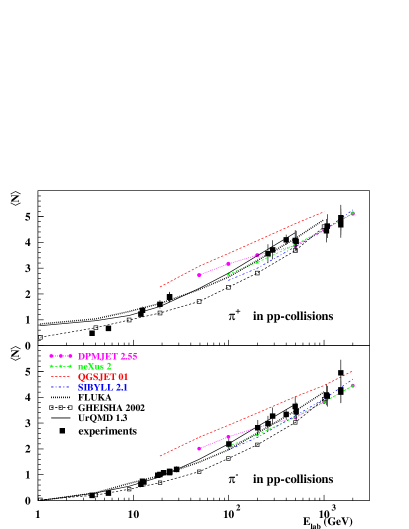
points sufficiently well except GHEISHA which produces too few pions. QGSJET overestimates the pion multiplicity within the 20 - 500 GeV region at the lower end of its design energy range.
3.2 p-9Be collisions
The above mentioned deficit of pions produced by GHEISHA is visible in the longitudinal momentum fractions of p-9Be collisions (Fig. 2) at -values around 0.15. As in pp-collisions QGSJET shows a pion overestimation visible in Fig. 2 at . Despite the completely different approaches of FLUKA and UrQMD both models reproduce the experimental data equally well.
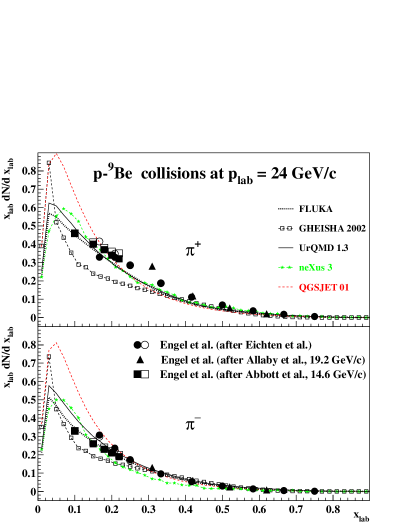
For kaons all codes behave similar as for the pions. The dominance of K+-mesons over the K- ones caused by the associated production of K++ in proton initiated interactions is reproduced by all studied models similarly (shown in Ref. [19]). FLUKA produces a small deficit of K± at .
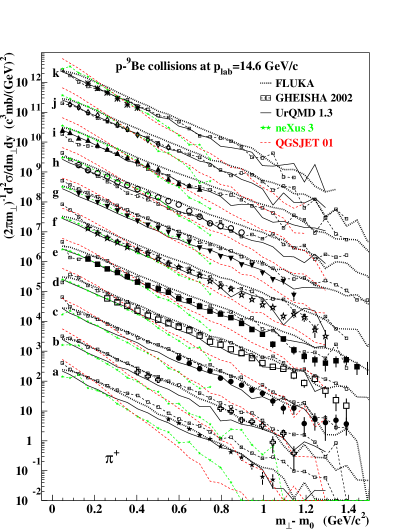
The agreement of the transverse momenta with experimental data is examined in Fig. 3 where the double-differential cross sections of -mesons are given as function of transverse mass and rapidity. The rapidity bins of width extend from 0.6 (curve a at bottom) to 2.8 (curve k on top). Both FLUKA and UrQMD follow the exponential trend (straight lines in logarithmic scale) of the experimental points [1] with the correct slope in the whole rapidity range. GHEISHA exhibits significant deviations for small transverse masses and for rapidities (curves c to i). Presumably the kinematics are still far from being perfect despite the correction patches [8]. As the high-energy models QGSJET and neXus use a -parametrization covering a wide energy range up to highest energies it is not surprising that below the lowest end of their designed energy range they produce transverse momenta with slopes generally too steep. All these findings hold similarly for -mesons emerging from p-9Be collisions.
3.3 p-12C collisions
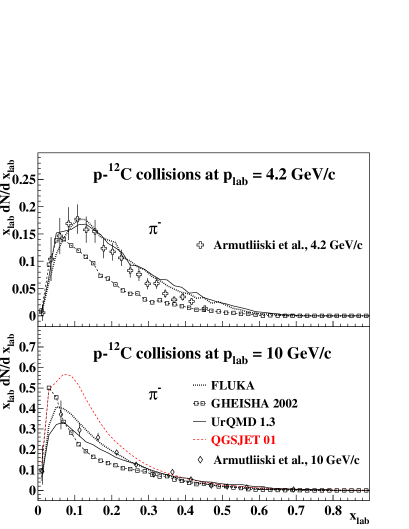
For the carbon target the diagnoses resemble the conclusions from Sect. 3.2. Longitudinal momentum fractions of -mesons are plotted for projectile energies of 4.2 and 10 GeV in Fig. 4. Again the agreement of FLUKA and UrQMD with the experimental data is fine. Simultaneously for low-energy pions () QGSJET produces an overshoot and GHEISHA shows a deficit at both examined energies.
3.4 Collisions with 14N and air targets
In contrast to the preceding sections no experimental data exist for 14N or air targets. We take the behaviour of FLUKA and UrQMD as reference as both models have shown a sufficiently good agreement with experimental values for lighter targets.
As charged pions are by far the most frequent projectiles within an EAS and 14N is the most abundant target nucleus within air, we investigate in Fig. 5 the momentum fractions which the -mesons carry away from -14N collisions. The behaviour of the displayed models resembles that which has already been found for the lighter targets. FLUKA and UrQMD are close to each other. All other high energy models, at 20 GeV collision energy neXus, at 100 GeV additionally DPMJET, QGSJET, and SIBYLL result in similar -distributions
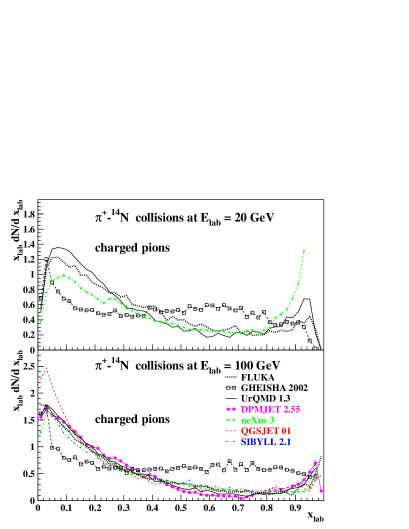
(Again the overestimation of QGSJET at low -values deviates from the average behaviour). The peak occurring at results from diffractive interactions. Differing from all other interaction models GHEISHA creates the pions with momenta shifted to higher values for both displayed collision energies, i.e. with an excess in the range and a deficit at . In EAS simulations this finding implies too high an elasticity which results in a stretching of the low-energy branches in the hadronic backbone.
In p-air interactions we include the HSA [20] as used in AIRES 2-6-0 [27]. It is parametrized only for air as target.
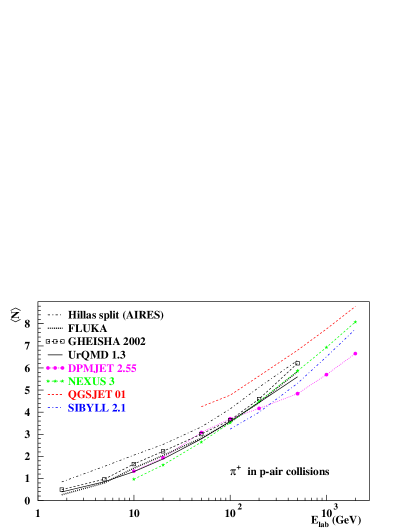
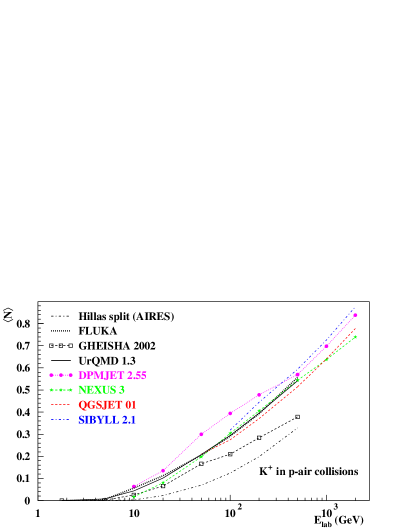
Fig. 6 shows the -multiplicities as function of the collision energy. Assuming FLUKA and UrQMD as standard we observe an overshoot of QGSJET as in Sect. 3.1. For GHEISHA the multiplicities seem now to be in agreement with the reference models.
The HSA as implemented in AIRES has been ”configured to approximately emulate the multiplicities and energy distributions of other models” [27]. An interpolation between GHEISHA and QGSJET has been selected [22] to get a smooth transition to the high-energy model QGSJET.
In my opinion HSA should not be tuned to imitate other models, rather the parameters should be adjusted in a manner to approach experimental values as closely as possible.
The K+-multiplicities displayed in Fig. 7 show a nice agreement of most models for energies below 50 GeV. In the HSA the K+-number has a significant deficit. By a comparison with the corresponding K--multiplicities the discrepancy can be traced back to kaons resulting from the associated K++ production which is missing in the HSA. GHEISHA exhibits a moderate deficit for both charged K-mesons which increases with the collision energy. Generally for negative kaon multiplicities the models show much better agreement than for the positive ones.
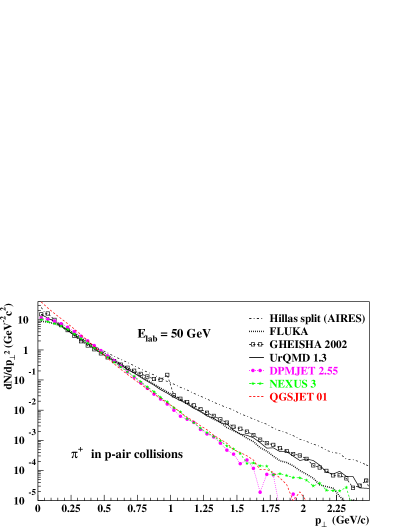
Special care has to be taken of the transverse momenta as they might influence the lateral distribution of the EAS particles arriving at ground. In the HSA the transverse momentum distributions need to be inserted from outside. For the other models we have examined the -feature already in p-9Be collisions (see Fig. 3). Fig. 8 compares the -distributions of -mesons for all low-energy and several high-energy codes. The reference models FLUKA and UrQMD coincide up to 1.75 GeV/c. Their predictions are well separated from that of HSA with its flat slope indicating an insufficient approximation to experimental values. This flat slope is detectable in the whole design range of the HSA within AIRES [26]. The GHEISHA distribution exhibits even a completely unexpected peak at GeV/c. As discussed in Sect. 3.2, with increasing the high-energy models fall-off with a too steep slope.
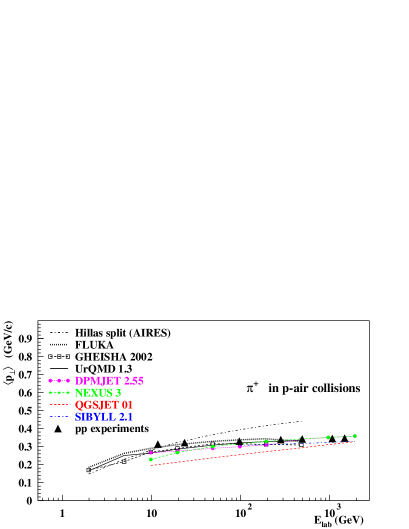
The average transverse momentum as function of collision energy is given in Fig. 9. Nearly all models follow the trend of experimental values of pp-collisions. HSA shows a too strong increase of with collision energy which results from the flat transverse momentum distribution shown in Fig. 8. The parametrization of QGSJET below the lower end of its designed energy range results in too low an average transverse momentum, especially below GeV.
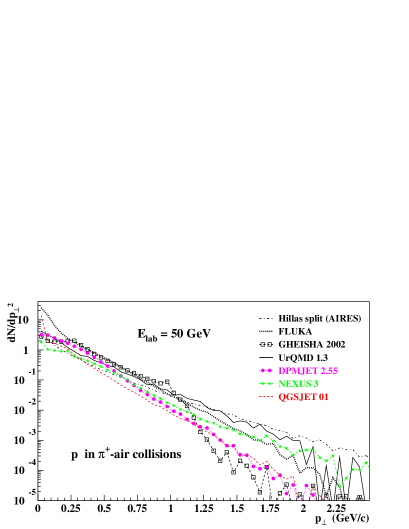
For pion-induced collisions with air the transverse momentum distributions of protons are displayed in Fig. 10. Again the HSA shows a deficit at small transverse momenta and an overshoot at large -values. The kink in the -distribution of GHEISHA at GeV/c once more demonstrates the problem in the kinematics of this model.
4 AIR SHOWER SIMULATIONS
The low-energy hadronic interaction codes have been combined with the high-energy code QGSJET 01 and in part with SIBYLL 2.1 to simulate p-induced showers of 1019 eV at vertical incidence. In the simulations the thinning method [20, 23] is employed with the parameters given in Table 1. For UrQMD the thinning level has been modified to = because of the long required CPU-times. For all combinations the transition energy between high and low-energy model has been taken as 80 GeV. 100 showers of each model combination have been averaged to minimize the influence of shower-to-shower fluctuations.
4.1 Longitudinal profiles
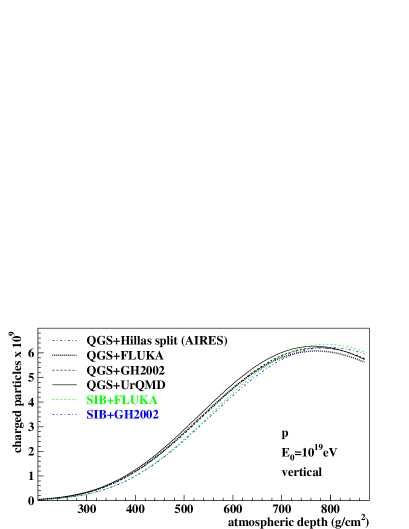
The resulting longitudinal profiles are reproduced in Fig. 11. All averaged profiles with QGSJET reach the shower maximum at g/cm2. The differences exceed slightly the standard deviation of 6.5 g/cm2. UrQMD with enhanced thinning fluctuations reveals the smallest value at 766 g/cm2, while FLUKA penetrates deepest (g/cm2). For the combinations with SIBYLL the value g/cm2 of FLUKA agrees well with 796 g/cm2 of GHEISHA (for the influence of high-energy hadronic interaction models on see Fig. 6 in Ref. [18]).
One might argue the differences coming from different production cross sections, but for nucleon and pion projectiles with GeV/c the corresponding cross sections agree within %, only the kaon cross sections show somewhat larger differences. No correlation of the -values with the cross sections of the low-energy models could be observed.
4.2 Lateral distributions
The lateral particle number distributions fall off by 5 orders of magnitude in the distance range from 200 m to 5 km.
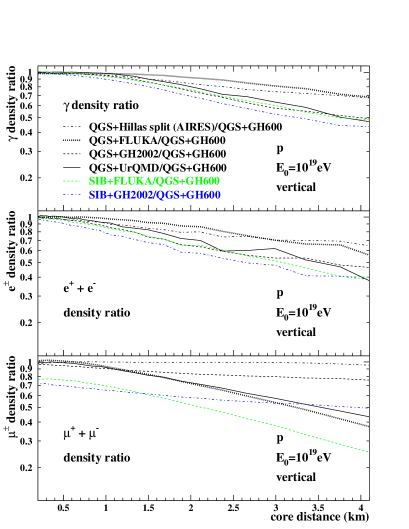
Therefore the ratios relative to the combination QGSJET + GHEISHA 600 are displayed in Fig. 12. This combination of high and low-energy models shows the flattest distribution for , e±, and -densities. The reason might be the wrong kinematics resulting in a prolongated shower development at the low-energy end of the hadronic backbone. Close to the shower axis this effect is masked by the numerous particles emerging from high-energy interactions, while at large core distances with a longer shower development path and therefore larger hadronic shower age the excess in elasticity of GHEISHA 600 produces more secondaries which finally flattens the lateral distributions. Similarly the high elasticity of GHEISHA 2002 found in Sect. 3.4 for -14N collisions may explain the flatter distributions (with QGSJET and SIBYLL) for the -density.
While FLUKA and UrQMD show similar distributions for the -densities (and to a minor degree for the e±-densities), the flat distributions of HSA have to be attributed to the insufficient -parametrization. The combinations with SIBYLL exhibit a significantly lower -density even at core distances as small as 1 km.
For the energy calibration of the Auger experiment [5] the signal
S(1000) of the Cherenkov water tanks at 1000 m core distance will be used.
Here we investigate the dependence of S(1000) on the low-energy model.
With the assumptions for the Cherenkov water tanks that
-
•
em-particles deposit their full energy,
-
•
muons contribute with their full energy, but at maximum with 240 MeV, and
-
•
240 MeV deposited energy corresponds to 1 vertical equivalent muon (VEM)
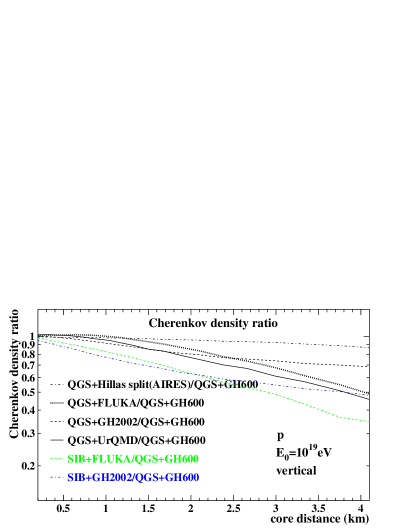
the lateral Cherenkov densities given in Fig. 13 are derived. For the Auger tanks of 10 m2 area the signal S(1000) of a vertical 10eV shower (p-induced) amounts to 47 (QGSJET+FLUKA), 46 (QGSJET+HSA), 45 (QGSJET+UrQMD), 43 (QGSJET+GHEISHA 2002), 39 (SIBYLL+FLUKA), and 36 (SIBYLL+ GHEISHA 2002) VEM. Radial distributions of Cherenkov densities are plotted in Fig. 14 as ratios which again display the large dependence on the high-energy model at 1 km core distance. The differences increase at larger distances still relevant to measurements of the Auger detector.
5 IMPLICATIONS AND CONCLUDING REMARKS
The CPU-time requirements to treat single collisions rsp. complete showers is important for EAS-simulations. In Table 1 CPU-times are collected.
The HSA-code as the fastest has an unsatisfactory performance as demonstrated in the preceding sections and lacks predictive power. A revision of its parameters is needed.
As shown in previous sections the kinematics of GHEISHA 2002 is still not satisfying.
| collisions | 1 shower 1 | ||
| at 10 GeV | eV | ||
| Model | p-air | -air | |
| FLUKA | 181 | 164 | 63300 |
| GHEISHA 2002 | 108 | 102 | 29100 |
| HSA (AIRES) | 64 | 64 | 18000 |
| UrQMD 1.3 2 | 12200 | 11400 | (800000) |
| neXus 3 | 6173 | 5861 | |
| QGSJET 01 | 88 | 87 | |
| 1 QGSJET 01, , MeV, MeV, | |||
| keV, W, W. | |||
| 2 H.J. Drescher has accelerated UrQMD 1.3c by a factor 15. | |||
The microscopic UrQMD model gives reliable results
at the expense of extreme long CPU-times.
In this model no parametrized cross sections are used, rather the
projectile hits on a ‘disk’ chosen large enough to cover the
maximum collision parameter.
Several trials (with their time-consuming microscopic calculation)
without interaction are usually needed before in an
inelastic collision secondary particles are produced.
Therefore this model is less suited for EAS simulations.
The FLUKA model shows the best performance and it is recommended
for EAS-simulations despite the longer CPU-times.
Unfortunately its source code is not yet publicly available,
only object codes for 5 types of machine/operating
systems are distributed at present.
Finalizing one can state that measurable shower parameters are predominantly influenced by the high-energy interaction programs [18] and only to some minor extend by the low-energy models.
Acknowledgments
I am indebted to the authors of the interaction models for their advice in linking their codes with CORSIKA. Special thanks go to G. Battistoni and A. Ferrari who enabled the use of FLUKA with CORSIKA. The support of M. Bleicher, H.J. Drescher, S. Soff, H. Stöcker, and H. Weber to get the UrQMD 1.3 running for EAS simulations is acknowledged. I thank R. Engel who provided me with experimental data sets and helped with clarifying discussions. Last but not least my thanks go to K. Bekk and J. Manger for their continuous efforts to keep the DEC-workstations running which was a prerequisite for this study.
References
- [1] T. Abbott et al., Phys. Rev. D45 (1992) 3906
- [2] J.V. Allaby et al., Yellow Report 70-12, CERN (1970)
- [3] M. Antinucci et al., Lett. Nuovo Cim. 6 (1973) 121
- [4] D.D. Armutliiski et al., Sov. J. Nucl. Phys. 48 (1988) 101
- [5] Auger Collaboration, Auger Project Design Report, FNAL (1997); www.auger. org/admin/DesignReport/index.html
- [6] S.M. Bass et al., Prog. Part. Nucl. Phys. 41 (1998) 225; M. Bleicher et al., J. Phys. G: Nucl. Part. Phys. 25 (1999) 1859; www.th.physik.uni-frankfurt.de/~urqmd/
- [7] G. Battistoni et al., Astropart. Phys. 19 (2003) 269
- [8] R.E. Cassell and G. Bower (SLAC), private communication (2002)
- [9] H.J. Drescher et al., Phys. Reports 350 (2001) 93; www-subatech.in2p3.fr/~theo/nexus
- [10] H.J. Drescher et al., Astropart. Phys. 21 (2004) 87
- [11] T. Eichten et al., Nucl. Phys. B44 (1972) 333
- [12] R. Engel, T.K. Gaisser, and T. Stanev, Phys. Lett. B47 (2000) 113
- [13] R. Engel et al., Proc. Int. Cosmic Ray Conf., Salt Lake City (USA) 1 (1999) 415
- [14] A. Fassò et al., FLUKA: Status and Prospective of Hadronic Applications, Proc. Monte Carlo 2000 Conf., Lisbon, Oct. 23-26, 2000, A. Kling et al. eds., Springer (Berlin) 955 (2001); www.fluka.org/
- [15] H. Fesefeldt, Report PITHA-85/02, RWTH Aachen (1985)
- [16] Application Software Group, GEANT, CERN Program Library (1994)
- [17] D. Heck et al., Report FZKA 6019, Forschungszentrum Karlsruhe (1998); www-ik.fzk.de/~heck/corsika/
- [18] D. Heck, M. Risse, and J. Knapp, Nucl. Phys. B (Proc. Suppl.) 122 (2003) 364
- [19] D. Heck et al., Proc. 28th Int. Cosmic Ray Conf., Tsukuba (Japan) 1 (2003) 279
- [20] A.M. Hillas, Proc. 17th Int. Cosmic Ray Conf., Paris (France) 8 (1981) 193; Nucl. Phys. B (Proc. Suppl.) 52B (1997) 29
- [21] N.N. Kalmykov, S.S. Ostapchenko, and A.I. Pavlov, Nucl. Phys. B (Proc. Suppl.) 52B (1997) 17; D. Heck et al. (KASCADE Collaboration), Proc. 27th Int. Cosmic Ray Conf., Hamburg (Germany) 1 (2001) 233
- [22] J. Knapp et al., Astropart. Phys. 19 (2003) 77
- [23] M. Kobal (P. Auger Collaboration), Astropart. Phys. 15 (2001) 259
- [24] J. Ranft, Phys. Rev. D51 (1995) 64; hep-ph/9911213; hep-ph/9911232 (1999)
- [25] A.M. Rossi et al., Nucl. Phys. B84 (1975) 269
- [26] S.J. Sciutto, astro-ph/9911331 (1999); www.fisica.unlp.edu.ar/auger/aires
- [27] S.J. Sciutto, Proc. 27th Int. Cosmic Ray Conf., Hamburg (Germany) 1 (2001) 237;
- [28] L.C. Tan and L.K. Ng, J. Phys. G: Nucl. Phys. 9 (1983) 1453