Silicate-break galaxies: an efficient selection method of distant ultraluminous infrared galaxies
Abstract
We present a photometric selection method for ULIRGs in the redshift range of – 2. We utilize the most prominent spectral feature of ULIRGs, i.e. the silicate absorption feature at 9.7 m and an optimized filter system at mid-infrared wavelengths. These ‘silicate-break’ galaxies could be selected by using colour anomalies owing to the silicate absorption feature around 9.7(1+) m. Such filter systems are available on the Spitzer Space Telescope but we suggest that the most promising selection criteria would be given with mid-infrared bands of ASTRO-F satellite due to a more comprehensive set of filter bands than that of Spitzer. We study the selection method of silicate-break galaxies with the SED model of both starbursts and quiescent star-forming galaxies, and then verify the method by using the observed spectra of nearby galaxies. We would expect that about 1000 candidates of silicate-break galaxies could be detected per square degree in current and future mid-infrared surveys. The silicate-break selection criteria will break the degeneracy between various galaxy evolution models for extragalactic source counts and place strong limits on the star formation activity at – 2. Applying our silicate-break technique to initial Spitzer results we have tentatively identified the first candidate silicate-break galaxy at .
keywords:
galaxies: starburst – dust, extinction – infrared: galaxies – submillimetre.1 Introduction
Extreme examples of high-redshift counterparts of nearby Ultra-Luminous Infra-Red Galaxies (ULIRGs, [Sanders & Mirabel 1996]) have been found by observations with SCUBA (the Submillimetre Common-User Bolometer Array) at 850m (e.g. Smail et al. [Smail, Ivison & Blain 1997], Hughes et al. [Hughes et al. 1998]). The star formation rates (SFRs) of submillimetre (submm) galaxies are estimated to be more than yr-1 (e.g. Smail et al. [Smail et al. 2002], Chapman et al. [Chapman et al. 2003] ), i.e. significantly higher than that of nearby ULIRGs. The observed flux at submm wavelengths is insensitive to the classical flux-redshift relation at , owing to the so-called negative K-correction. Nevertheless, the redshift distribution of submm galaxies seems to be rather narrow with a median redshift of 2.4 (Chapman et al. [Chapman et al. 2003] ). A tentative detection of strong clustering within the submm population suggests that submm galaxies may be the progenitors of today’s giant elliptical galaxies (Blain et al. [Blain et al. 2004]). A further clue to the evolutionary link between submm galaxies and ellipticals is presented by the Spectral Energy Distribution (SED) fitting analysis by Takagi et al. (2004).
Spheroids contain about 50 – 70 % of the stellar mass in the local universe (e.g Schechter & Dressler [Schechter & Dressler 1987], Fukugita, Hogan, & Peebles [Fukugita, Hogan, & Peebles1998]). It is not yet clear whether the formation of such a large mass fraction can be explained by submm galaxies alone, including the recently found optically-faint radio galaxies at similar redshifts (Chapman et al. 2004), which could have the similar SFR with that of submm galaxies. The SFR density due to submm galaxies and optically-faint radio galaxies has a strong peak at – 3 (Chapman et al. 2004), which corresponds to the time-scale of only 1 Gyr.
Recent studies on near-IR selected galaxies in the HDF-N [Dickinson et al.2003] and the HDF-S [Fontana et al. 2003] show that a significant fraction of stars at the present epoch are formed at – 2, i.e. at later epochs than when most of submm galaxies are found. Therefore, ULIRGs at – 2 could be a key galaxy population in understanding the formation process of spheroidal galaxies as well as submm galaxies at . Furthermore it is probable that these infrared galaxies are the main contributors to the cosmic infrared background (c.f. Chary & Elbaz [Chary & Elbaz 2001]). Such galaxies will be prime targets of new infrared satellites, such as Spitzer [Werner et al. 2004] and ASTRO-F [Pearson et al. 2004], [Murakami 1998].
Various methods for the photometric pre-selection of interesting high- objects, such as Lyman-break galaxies [Steidel et al. 2003], massive galaxies at high redshifts (van Dokkum et al. 2004; Cimatti et al. 2004), Lyman- emitters at (Cowie & Hu 1998; Taniguchi et al. 2003; Shimasaku et al. 2003), have revolutionized the field of the galaxy evolution at high redshift. These techniques are widely used to select objects for spectroscopy, and for statistical studies to derive luminosity functions and spatial correlation functions, which require a large sample at a similar redshift.
Until now, these photometric pre-selection techniques have been developed for galaxy populations observed at optical and near-infrared (NIR) wavelengths. Similar techniques for selecting luminous infrared galaxies at – 2 are strongly demanded. Recently, the spectroscopic bump at 1.6 m due to the H- opacity minimum has been applied to galaxies detected at 24m with Spitzer (Le Floc’h et al. 2004; Egami et al. 2004). This technique requires coordinated surveys at NIR wavelengths targeting the rest-frame 1.6m and MIR wavelengths to detect significant dust emission, and also unambiguous cross-identification between NIR and MIR sources, which is not easy for blended pairs of NIR sources (e.g. Egami et al. 2004). Therefore, any techniques using only the dust emission would be more efficient.
In the spectra of ULIRGs, the most prominent features are found at MIR wavelengths, i.e. silicate absorption at 9.7 m and the PAH features. Here, we investigate the possibility of selecting luminous infrared galaxies at with Spitzer and ASTRO-F by focusing on the MIR features. We hereafter refer to distant infrared galaxies selected by this method as ‘silicate-break’ galaxies for simplicity. Note that Charmandaris et al. (2004) briefly discuss the possibility of estimating redshifts from the MIR features by using the Infrared Spectrograph (IRS, Houck et al. [Houck et al. 2004] ) peak-up imagers at 16 and 22 m onboard Spitzer, although it is difficult to use these imagers for large area blank field surveys, because of the small filed-of-view.
Silicate-break galaxies could be selected by using the colour anomaly owing to the silicate absorption feature around a m band. For example, a galaxy with the SED of Arp 220 at would be too faint to be detected with Spitzer in the MIPS 24 m band, while it would be detectable in the other infrared bands, as shown in Figure 1. Thus, sources which are detected in all the Spitzer bands but 24 m are candidates for heavily obscured galaxies at . With the sensitivity of Spitzer and ASTRO-F, most of the silicate-break galaxies would be classified as ULIRGs.
The structure of this paper is as follows. In section 2 we describe the SED model used to derive the selection criteria for silicate-break galaxies. In section 3 we discuss the selection criteria for the Spitzer and ASTRO-F infrared satellite missions and predicted effectiveness of the filter combinations in detecting potential silicate-break candidates. The potential number of silicate-break galaxies at – 2 are estimated using two infrared evolutionary models in section 4. We give discussion and conclusions in section 5. Throughout this work we assume a flat cosmology of , , and km sec-1 Mpc-1.

2 SED templates
In order to derive the colour criteria to select silicate-break galaxies in a desired redshift range only, we need to ensure that there is negligible contamination from the other redshifts by using a wide variety of possible SEDs.
We adopt the evolutionary SED model of starbursts by Takagi et al. (2003a), in which the SED variation is explained by the difference in the starburst age and the compactness of the starburst region . It is found that the SED model reproduces not only the SED of ULIRGs, but also the SED of UV-selected starburst galaxies which are usually less luminous. This means that the SED model is capable of covering the wide variation of observed starburst galaxy SEDs.
In Takagi et al. (2003a), three types of dust model are adopted, i.e. the Milky Way (MW), Large Magellanic Cloud (LMC), and Small Magellanic Cloud (SMC) dust models (see Takagi et al. 2003b for details of the models). The fraction of silicate dust grains is assumed to increase from the MW to SMC model, i.e. as a function of the metallicity. Therefore, the silicate absorption feature is most prominent in the SEDs described by the SMC type dust model. Thus, in this work, we focus on the SMC dust model, which is found to be suitable for most of the nearby ULIRGs modelled by Takagi et al. (2003a). We have confirmed that none of the SED models with the MW and LMC type dust causes any contamination in the selection criteria discussed below.
We constrain the possible parameter space of the SED model, suitable for high- ULIRGs by using the observed SED variation of submm galaxies. Note that the SED model itself can cover a wide variety of starburst SEDs, including that of UV-selected starburst galaxies, i.e. non-ULIRGs. We first constrain the starburst age at where is the evolutionary time-scale of starbursts, since the probability to select very young galaxies is low. We use the models younger than , which are enough to reproduce the majority of observed SEDs (Takagi et al. 2003a; Takagi et al. 2004). We then constrain the compactness to 0.6 – 1.4, which is enough to cover the observed range of SEDs of submm galaxies. In Figure 2, we show the SED models with the starburst age of – 6, and – 1.4, together with the observed fluxes of submm galaxies at – 3. The SED models are normalized at mJy at . We adopt an initial mass function (IMF) with a power-law index of , which is slightly flatter than the Salpeter IMF (), following Takagi et al. (2004). Note that submm galaxies which are very faint at optical – NIR wavelengths, are not included in the sample. Such galaxies could be more heavily obscured than the coverage of the SED model, and would therefore have an even deeper silicate absorption feature.
Using the high- galaxy sample, rather than well studied nearby galaxies, to constrain the SED parameter space has two distinct advantages; 1) the redshift of the target galaxies themselves is high (), and 2) the effect of any underlying stellar population will be minimal in the optical – NIR in the observed frame. Note that the latter advantage is useful in estimating the variation of the SED parameters from the observed optical – NIR SEDs. SED analysis of individual submm galaxies is given in Takagi et al. (2004).
We also need an SED template for quiescent star-forming galaxies to estimate any possible contamination of the sample of silicate-break galaxies. We adopt the phenomelogical SED template of Dale et al. (2001), which reproduces the empirical spectra and infrared colour trends. In this model, SEDs are characterized by a power-law index of the distribution of dust mass over a wide range of interstellar radiation field strengths. We use the SED models with which are suitable for the quiescent population.

Both of SED templates by Takagi et al. (2003a) and Dale et al. (2001) do not include the contribution of AGN. AGN generally produce a featureless continuum which can be approximated by a power-law spectrum without PAH emission (e.g. Laurent et al. 2000). This means that the presence of an AGN will decrease the prominence of the silicate absorption feature. Such AGN-dominated galaxies would be difficult to be selected as silicate-break galaxies even with high luminosity. Therefore, the number of silicate-break galaxies depends on how strong the AGN contribution is in ULIRGs at . However, the AGN contribution is not very important to derive the selection criteria of silicate-break galaxies, since AGN-dominated galaxies have almost constant MIR colours, owing to the power-law like spectrum. This is confirmed below by using observed spectra of AGN in section 3.3.
All fluxes are calculated using the transmission curves at each filter band. The digital form of the transmission curves of Spitzer bands and ASTRO-F bands are available from the web page of Spitzer Science Center (SSC) and H. Matsuhara (2004, private communication), respectively, except for the Spitzer/IRS filters at the time of writing. For the IRS filters at 16 and 22 m, we assume box car profiles for the transmission curve.
3 Selection criteria of silicate-break galaxies
3.1 Case for Spitzer
Spitzer covers the near to far-infrared range in 7 bands at 3.6, 4.5, 5.8, 8.0m with the IRAC instrument [Fazio et al. 2004] and 24, 70, 160 m with the MIPS instrument [Rieke et al. 2004]. Also, the IRS has peak-up imagers at 16 and 22 m, although the field-of-view is small. These imagers would be useful for targeted observations of objects which are too faint to obtain spectroscopic redshifts. In Figure 3, we show the three flux ratios, 8-to-24m, 24 to 70m and 16 to 22 m as a function of redshift for the SED templates described above, where fluxes are given per unit frequency (i.e. flux density).
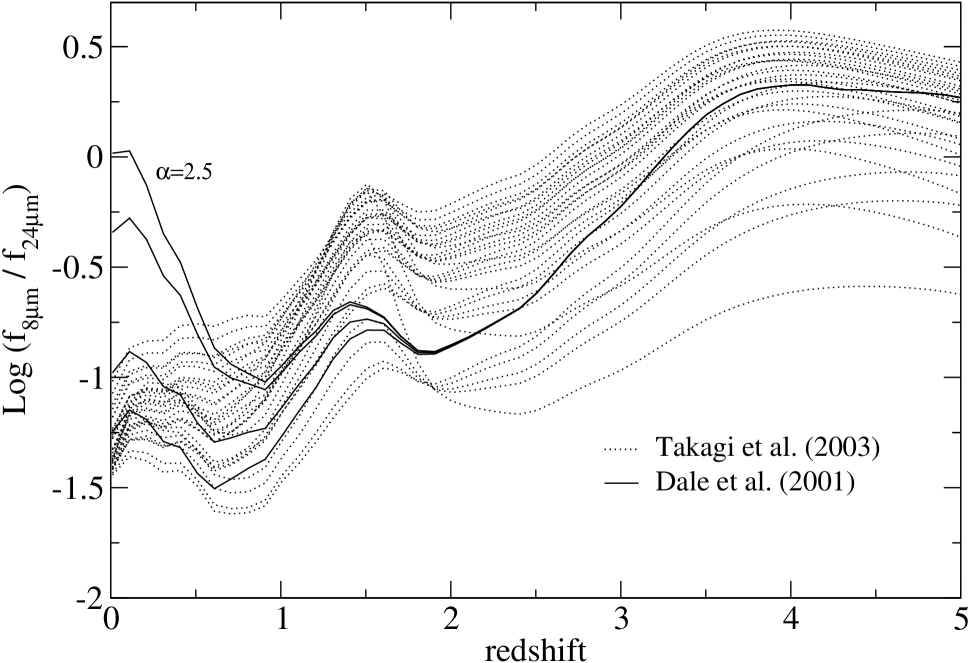


For the 8 to 24 m flux ratio, the colour bump around due to silicate absorption is not prominent. The flux ratio can vary with a rather large scatter at different redshifts, which makes the silicate-break selection difficult. This is because the stellar light mainly contributes to the 8 m flux, while dust emission contributes at 24 m. Also, note that quiescent star-forming galaxies at have a similar flux ratio to that of ULIRGs at . Obviously, this flux ratio is not useful for the selection of silicate-break galaxies.
We can expect a weaker variation of the flux ratio as a function of redshift, when the dust emission contributes in both the selected bands. This is the case for the flux ratio of 24 to 70 m for the Spitzer band. From the flux variation predicted by the SED model, galaxies with could be silicate-break galaxies at . This selection is effective for galaxies with relatively deep silicate absorption feature. This means that 24-to-70 m selection is likely to be biased towards high optical depth. The contamination from quiescent star-forming galaxies is negligible.
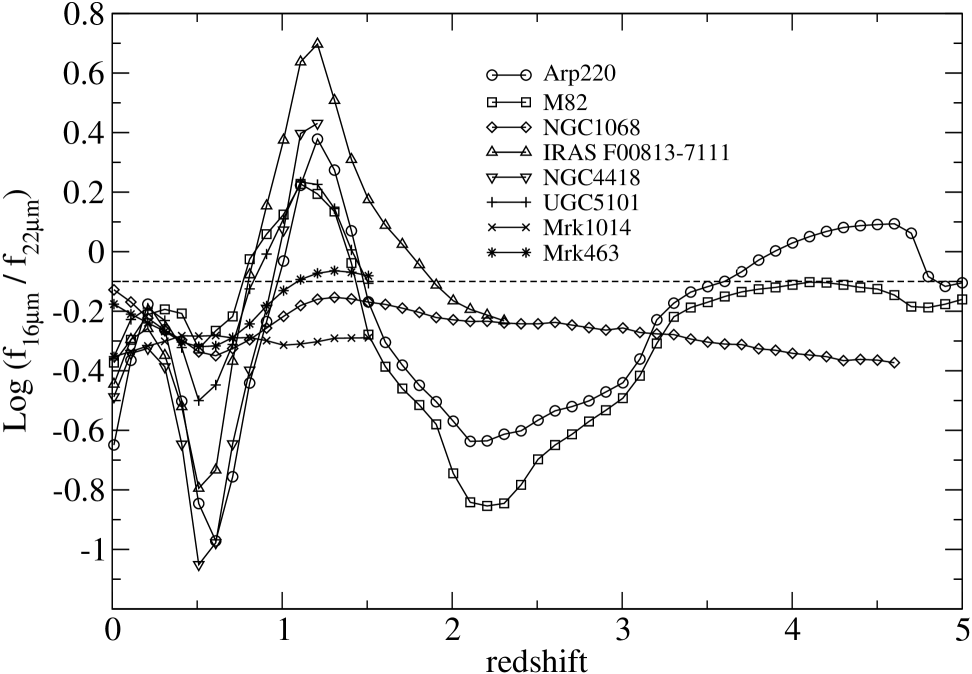
With the IRS peak-up imagers at 16 and 22 m, we could make more complete sample of silicate-break galaxies than that of 24-to-70 m selection, i.e. free from the bias in optical depth. If we adopt the criterion of , most of the SED templates of ULIRGs satisfy this criterion at – 2. Although this selection suffers from some contamination from quiescent star-forming galaxies with cold dust temperatures at , it can be removed by using additional photometry at 70 m. In Figure 4, we show the colour-colour diagram with the two IRS imagers and 70 m. The 22-to-70 m ratio is higher for more quiescent galaxies, which is distinguishable from that of ULIRGs at – 2. The selection with the 16-22 m ratio also includes ULIRGs at , which are interesting objects as well. The fraction of such high- ULIRGs would be small with the current sensitivity limits.
3.2 Case for ASTRO-F
ASTRO-F has a more comprehensive set of photometric bands at MIR wavelengths, compared to Spitzer. The Infra Red Camera (IRC) instrument on ASTRO-F has 3 channels each comprising of 3 photometric bands (Wada et al. [Wada et al. 2003]). The IRC-NIR has bands at 2.4, 3.2, 4.3m. The IRC-MIR-S has bands at 7, 9, 11m. The IRC-MIR-L has bands at 15, 20, 24m. The bands at 9 and 20m are considerably wider than the others. Thus among the three channels of the IRC, the MIR-L channel has the most useful bands to cover the silicate absorption in galaxies at ; i.e. 15 m (L15), wide 20 m (L20W), and 24 m (L24).
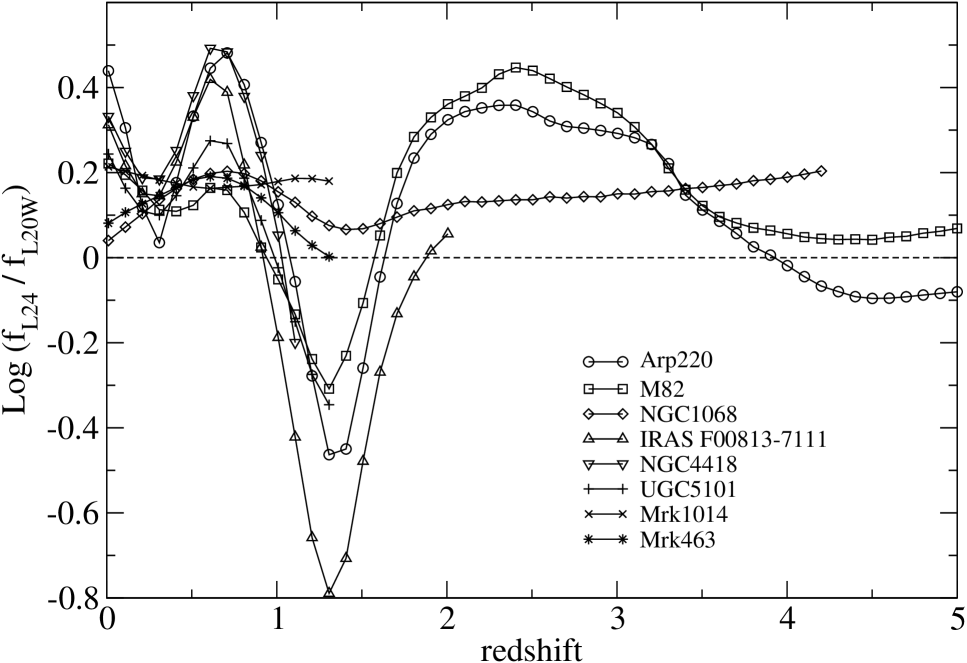
In Figure 5, we show three flux ratios as a function of redshift. The flux ratio of L24 to L20W has the most prominent colour bump at 1.5 due to the silicate absorption. Galaxies with could be silicate-break galaxies. In this colour cut, most of the galaxies showing the silicate absorption feature could be selected, irrespective of the optical depth. As in the case of the selection with the IRS peak-up imagers, there would be some contamination from quiescent star-forming galaxies with cold dust temperatures at . Again, this contamination can be removed with additional photometry at FIR wavelengths as shown in Figure 6. Also note that this selection will include a small fraction of ULIRGs at .


3.3 Test with observed spectra
Takagi et al. (2003b) perform a detailed comparison of the SED model with the observations of Arp220 and M82. They find that the depth of the silicate absorption features in Arp220 and M82, along with the UV-submm SED, are reproduced by the SMC and LMC dust models, respectively. The detailed observed spectra of silicate absorption features are slightly different from that of the model, which can be attributed to the uncertainty of the optical properties of dust grains. Also note that some ULIRGs show strong absorption features of molecules, such as CO gas and water ice (Spoon et al. 2004), which are not taken into account in the models. Thus, we need a test of derived selection criteria by using observed spectra.
Here we test our selection criteria by using 8 observed spectra obtained with ISO and Spitzer, i.e. Arp220, M82 (Elbaz et al. 2002), NGC1068 (Sturm et al. 2000), IRAS F00183-7111 (Spoon et al. 2004a), NGC4418 (Spoon et al. 2004b), UGC5101, Mrk1014, and Mrk463 (Armus et al. 2004)111 Since the digital form of the spectra in Armus et al. (2004) is not available to the public, we used the data trace software ‘DataThief II’ for the electric version of the published papar. The error on this process is negligible for our study.. Among these galaxies, AGN-continuum dominates the MIR emission in NGC1068 (typical Seyfert 2), Mrk1014 (infrared luminous QSO) and Mrk463 (Seyfert 2). Both NGC4418 and IRAS F00813-7111 have strong silicate absorption features, although the strong radio emission indicate the presence of AGN. By nature, this sample is not complete in any statistical sense.
In Figure 7, we show the 16-to-22 m flux ratio for Spitzer and the L24-to-L20W for ASTRO-F as a function of redshift based on the observed spectra. The selection criteria based on the model analysis result in the selection of 5 out of 8 galaxies as silicate-break galaxies. As expected, these selections miss the continuum-dominated galaxies, which have almost constant flux ratio and cause no contamination.
Note that the variation of flux ratios are similar to those of the SED models. This suggests that these flux ratios are insensitive to the detailed features in the MIR spectra, such as molecular absorptions. Also, the selection criteria would be less sensitive to any uncertainty in the dust model, such as the detailed shape of silicate feature.
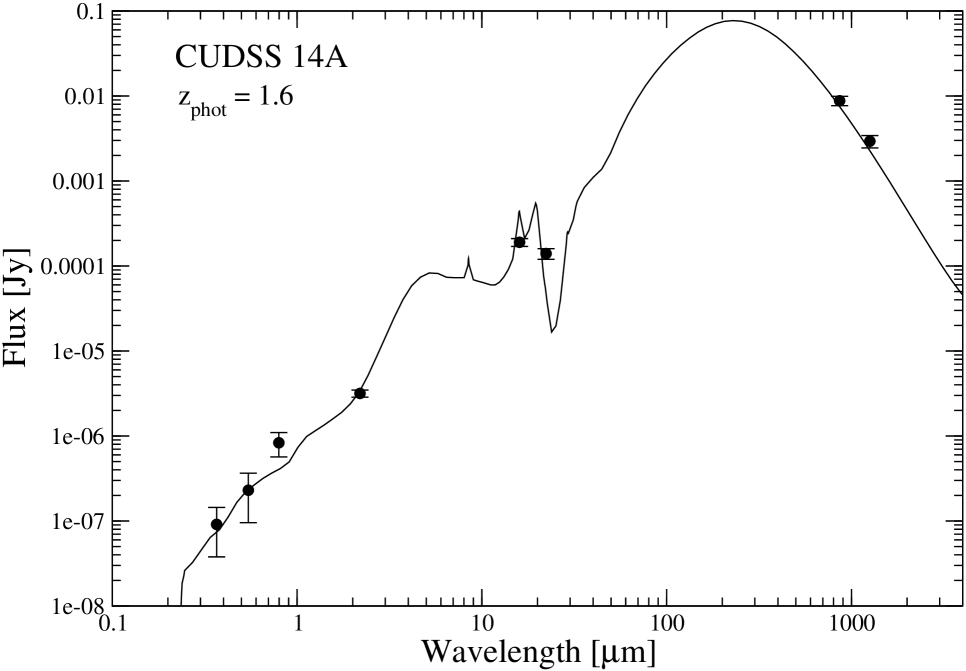
In Charmandaris et al. (2004), there are two galaxies which clearly satisfy the silicate-break selection, i.e. object 9 and 11 in their table. The flux ratio of 16 to 850 m suggests that the object 11 (CUDSS 14A) is likely to be at . We perform the SED fitting for this galaxy by using the same SED models as those in Takagi et al. (2004). The best-fitting SED model suggests that this galaxy is a silicate-break galaxy at as shown in Figure 8. We suggest that this galaxy is the first promising candidate of a silicate-break galaxy.
4 Expected number of silicate-break galaxies
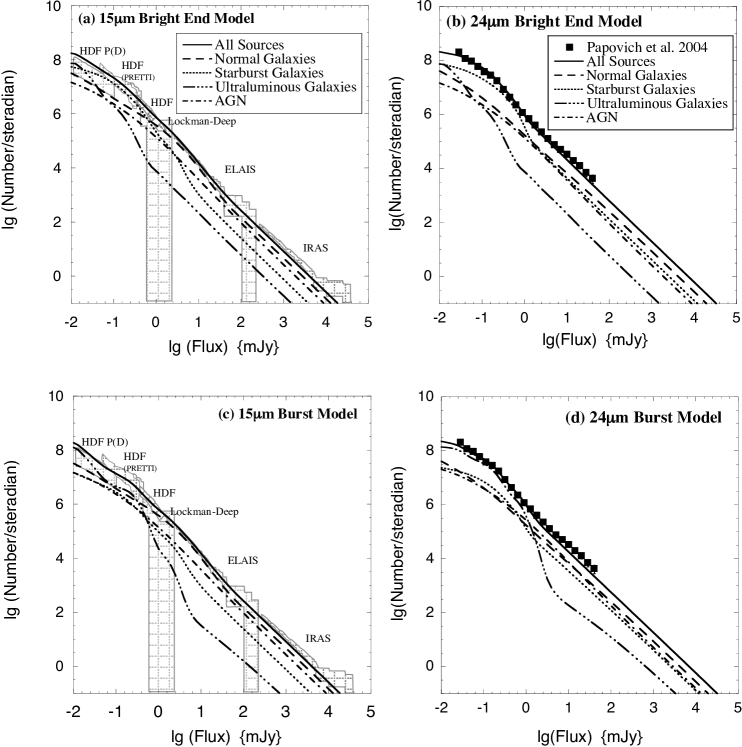
We use the galaxy evolution models of Pearson [Pearson 2004] to predict the numbers of silicate-break galaxies expected in the mid-infrared surveys that are or will be conducted by Spitzer and ASTRO-F. These models use the type dependent luminosity functions derived from the ISO-ELAIS survey (Rowan-Robinson et al. [Rowan-Robinson 2004]) of Pozzi et al. [Pozzi et al. 2004] and Matute et al. [Matute et al. 2004] to represent the normal and starburst/ULIRG and AGN populations respectively. We investigate two particular models, in order to predict the numbers of silicate-break galaxies. The models are categorized by their dominant populations of starburst (M82 like) and ULIRG (Arp 220 like) sources respectively. The first (starburst dominated) model is referred to as the Bright End Model, and broadly follows the evolutionary scenario of Pearson & Rowan-Robinson [Pearson & Rowan-Robinson 1996]. This model assumes power law evolution in both luminosity and density of the forms for the starburst, AGN and ULIRG populations respectively. The second (ULIRG dominated) model is referred to as the Burst Model, and broadly follows the evolutionary scenario of Pearson [Pearson 2001]. This model assumes a similar power law evolution in luminosity, for the starburst and AGN populations and an initial exponential burst + power law evolutionary scenario for the ULIRG population. In both models the normal galaxies are assumed to be non-evolving. See Pearson [Pearson 2004] for details of the models. These models provide good fits to both the 15m ISO counts and the Spitzer counts at 24m (Papovich et al. [Papovich et al. 2004], Oliver et al. [Oliver et al. 1997], Aussel et al. [Aussel et al. 1999], Elbaz et al. [Elbaz et al. 1998], Serjeant et al. [Serjeant et al. 2000]). These model fits are shown in Figure 9.
For the purpose of this study, to model the ULIRG population (i.e. the potential silicate-break galaxies) we have used two SED templates from the library of Takagi (2003a) rather than that of Arp220 which has a rather anomalous farinfrared-midinfrared ratio. These SEDs are modelled on the local IRAS galaxies, IRAS 15250 and IRAS 12112, for which the model gives an excellent fit to the observed multi-band data, specifically at NIR-submm wavelengths. The SED of IRAS 15250 and IRAS 12112 are assumed to be representative of infrared luminosities of () and (), respectively.
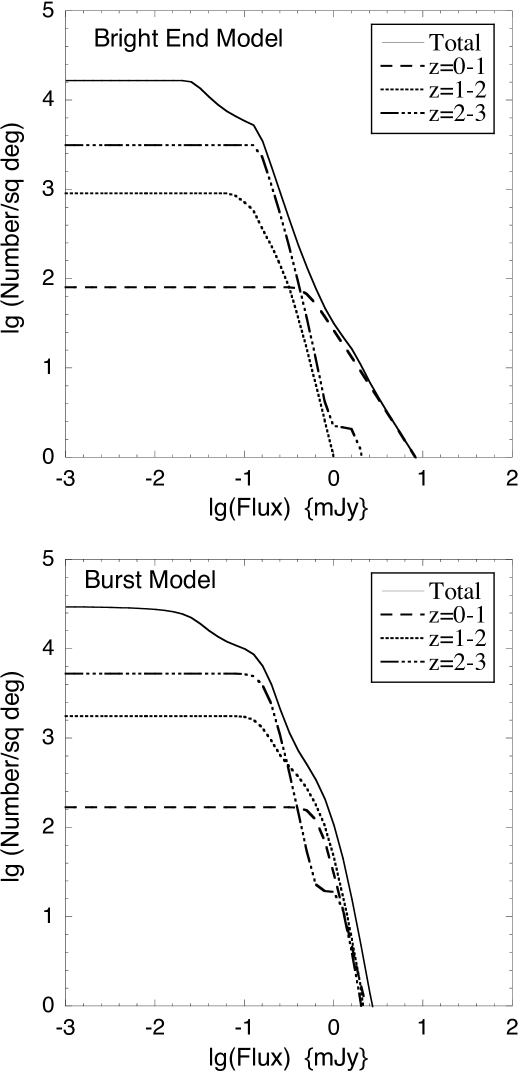
The selection criteria for silicate-break galaxies dictates that the interesting sources will be ULIRGs between – 2. Hence in Figure 10 we plot the number of sources per square degree as a function of flux at 24m in 3 redshift bins of – 1, 1 – 2 and 2 – 3. For the Spitzer 24m band, the number of potential silicate-break galaxies are predicted to be and /sq.deg for the Bright End model and the Burst model respectively. All the silicate-break galaxies selected at 24m should be detected at the confusion limit of the 70m surveys with Spitzer (Lonsdale et al. [Lonsdale et al. 2003], [Lonsdale et al. 2004]).
ASTRO-F will have a more comprehensive set of bands in the mid-infrared, having 3 bands sensitive to the silicate-break galaxies (15, 20, 24m) with its’ IRC instrument. Present survey strategies for the IRC include both a deep survey and a shallow survey around the north ecliptic pole (NEP) region with the sensitivity of and Jy () at L20W band, respectively (Pearson et al. [Pearson et al. 2001]. [Pearson & Matsuhara 2004]). The survey area of the deep and the shallow survey would be 0.5 and deg2, respectively (Pearson et al. [Pearson et al. 2001], Matsuhara & Pearson [Matsuhara & Pearson 2004], Pearson & Matsuhara [Pearson & Matsuhara 2004]). For the deep NEP survey similar numbers to the Spitzer 24m results for the 2 evolutionary models are expected in all 3 bands of the MIR-L since we are effectively detecting all ULIRGs between – 2 at these depths. For the shallow pointing survey, we predict and candidates per square degree at 20 m for the Bright End model and the Burst model, respectively.
The actual number of silicate-break galaxies would be somewhat smaller than the predicted number of ULIRGs at – 2, since the possible contribution from the AGN continuum make the silicate absorption less prominent. Note that the fraction of AGN-dominated galaxies, i.e Seyfert 1 and 2, in nearby ULIRGs are % (Sanders & Mirabel 1996). X-ray follow-up observations of deep ISO surveys in the HDF-N and the Lockman Hole consistently suggest that % of ISO-detected MIR sources are likely to be AGN-dominated (Fadda et al. 2002). X-ray properties of the silicate-break population and other ULIRGs would be very important to study the obscuration of AGNs by dust at high redshifts.
The observed number of silicate-break galaxies will place a strong lower limit on the number of ULIRGs at this redshift range. From the above predictions and our silicate-break selection criteria, it will be possible to discriminate between the models above and more extreme evolutionary models (e.g. Dusty E/S0 models [Xu et al. 2003], cirrus dominated models [Rowan-Robinson 2001]). From Figure 10 it can be seen that even the Bright End and Burst evolutionary models differ by factors of 2 – 3 in their predictions for ULIRGs between and 2.
5 Discussion and conclusions
We have investigated the photometric pre-selection method of high- ULIRGs at – 2, by focusing on the silicate absorption feature at m in the rest-frame. This technique requires observations only at MIR wavelengths, and is therefore very efficient and self-consistent. Applying our silicate-break technique to the sample of Charmandaris et al. (2004) we have tentatively identified the first candidate silicate-break galaxy at .
With Spitzer, we could select ULIRGs at as silicate-break galaxies with . This colour cut is applicable to the selection of optically thick ULIRGs; i.e. the selection is biased towards high optical depth, although the sample is free from the contamination from quiescent star-forming galaxies. A more complete selection of silicate-break galaxies is possible with the IRS peak-up imagers with additional photometry at 70 m to remove the contamination from quiescent star-forming galaxies at .
With ASTRO-F, a similar selection criterea of silicate-break galaxies to that of the IRS imagers is possible with L24 and L20W bands. The advantage of ASTRO-F is the larger field-of-view (100 arcmin2) for these bands, compared to that of the IRS peak-up imagers, allowing for larger samples of silicate-break galaxies.
The proposed selection criteria is useful to construct samples of heavily obscured galaxies at – 2. The majority of such galaxies are likely to be powered by starbursts rather than AGN. Therefore, such samples could be used to place strong limits on the star formation activity at – 2. Note that spectroscopic redshifts might be difficult to measure for such heavily obscured galaxies, which are expected to be faint at optical wavelengths. Furthermore, the expected redshift range of silicate-break galaxies overlaps with the so-called ‘redshift desert’, in which strong emission lines are not accessible from the ground. Thus, the proposed silicate-break selection method could play important role to investigate the nature of infrared galaxies at bridging the gap between the IRAS-ISO and SCUBA populations.
In the ASTRO-F NEP surveys, we expect to detect – 1500 candidates of silicate-break galaxies depending on the evolutionary model. This large sample will allow us to derive important characteristics of ULIRGs at – 2, such as their luminosity and spatial correlation function. Such data sets can also discriminate or tightly constrain multi-component number count models.
The available filters on Spitzer and ASTRO-F are found to be too broad to use individual PAH emission features for photometric pre-selections. Similarly, we find that the ISO 15 m band is too broad to produce the colour anomaly for galaxies at , owing to the silicate absorption. Thus, using the silicate-break method, Spitzer and ASTRO-F can provide the first opportunity to pre-select high- infrared galaxies with MIR bands.
Acknowledgments
We thank S. Serjeant for useful and stimulating discussions. Also, we thank H. Hanami for useful comments, which improved the paper. We would like to thank D. Elbaz and H.W.W. Spoon for providing us with the observed spectra of galaxies. We are also grateful to D. Dale for distributing the SED template on the Web. We thank the referee for stimulating comments. CPP acknowledges a Fellowship to Japan from the European Union.
References
- [Armus et al. 2004] Armus L. et al., 2004, ApJS, 154, 178
- [Aussel et al. 1999] Aussel H., Cesarsky C.J., Elbaz D., Starck J.L., 1999, A&A, 342, 313
- [] Blain A.W. et al., 2002, Physics Reports, 369, 111 (astro-ph/0202228)
- [Blain et al. 2004] Blain A.W., Chapman S., Smail I., Ivison R.J., 2004, ApJ, 611, 725
- [Chapman et al. 2003] Chapman S.C., Blain A.W., Ivison R.J., Smail I.R., 2003, Nature, 422, 695
- [] Chapman S.C., Smail I., Blain A.W., Ivison R.J., 2004, ApJ, 614, 671
- [Charmandaris et al. 2004] Charmandaris V. et al., 2004, ApJS, 154, 142
- [Chary & Elbaz 2001] Chary R., Elbaz D., 2001, ApJ, 556, 562
- [Cimatti et al. 2004] Cimatti A. et al, 2004, Nature, 430, 184
- [] Cowie L.L., Hu E.M., 1998, ApJ, 502, 99
- [] Dale D.A., Helou G., Contursi A., Silbermann N.A., Kolhatkar S., 2001, ApJ, 549, 215
- [Dickinson et al.2003] Dickinson M., Papovich C., ferguson H.C., Budavari T., 2003, ApJ, 587, 25
- [Dole et al. 2004] Dole H. et al., 2004, ApJS, 154, 93
- [] Eales S., Lilly S., Gear W., Dunne L., Bond J.R., Hammer F., Le Fevre O., Crampton D. 1999, ApJ, 515, 518
- [] Egami E. et al., 2004, ApJS, 154, 130
- [Elbaz et al. 1998] Elbaz D. et al., 1998, in Proc. of 34th Liege International Astrophysics Colloquium on the “Next Generation Space Telescope”, Belgium, June 1998, p.42
- [] Elbaz D., Cesarsky C.J., Chanial P., Aussel H., Franceschini A., Fadda D., Chary R.R., 2002, A&A, 384, 848
- [] Fadda D. et al., 2002, A&A, 383, 838
- [Fazio et al. 2004] Fazio G.G. et al., 2004, ApJS, 154, 10
- [Fontana et al. 2003] Fontana A. et al., 2003, ApJ, 594, 9
- [Fukugita, Hogan, & Peebles1998] Fukugita M., Hogan C.J., & Peebles P.J.E., 1998, ApJ, 503, 518
- [] Gear W.K., Lilly S.J., Stevens J.A, Clements D.L., Webb T.M., Eales S.A., Dunne L. 2000, MNRAS, 316, L51
- [Houck et al. 2004] Houck J.R. et al., 2004, ApJS, 154, 18
- [] Huang J.-S. et al., 2004, ApJS, 154, 44
- [Hughes et al. 1998] Hughes D. et al., 1998, Nature, 394, 241
- [] Laurent O. et al., 2000, A&A, 359, 887
- [] Le Floc’ch E. et al., 2004, ApJS, 154, 170
- [] Lilly S.J., Eales S.A., Gear W.K., Hammer F., Le Fevre O., Crampton D., Bond J.R., Dunne L. 1999, ApJ, 518, 641
- [Lonsdale et al. 2003] Lonsdale C.J. et al., 2003, PASP, 115, 897
- [Lonsdale et al. 2004] Lonsdale C.J. et al., 2004, ApJS, 154, 54
- [Matsuhara & Pearson 2004] Matsuhara H., Pearson C.P., 2004, in preparation
- [Matute et al. 2004] Matute I. et al., 2002, MNRAS, 332, L11
- [Murakami 1998] Murakami, H., 1998, Japanese infrared survey mission IRIS (ASTRO-F), In: Bely P.Y., Breckinridge J.B. (Ed), Space Telescopes and Instruments, Proc. SPIE 3356, 471
- [Oliver et al. 1997] Oliver S.J. et al., 1997, MNRAS, 289, 471
- [Papovich et al. 2004] Papovich C. et al., 2004, ApJS, 154, 70
- [Pearson & Rowan-Robinson 1996] Pearson C.P., Rowan-Robinson M., 1996, MNRAS, 283, 174
- [Pearson 2001] Pearson C.P., 2001, MNRAS 325, 1511
- [Pearson et al. 2001] Pearson C.P., Matsuhara H., Onaka T., Watarai H., Matsumoto T., 2001, MNRAS, 999, 1014
- [Pearson et al. 2004] Pearson C.P. et al., 2004, MNRAS, 347, 1113
- [Pearson 2004] Pearson C.P., 2004, MNRAS, in preparation
- [Pearson & Matsuhara 2004] Pearson C.P., Matsuhara H., 2004, in preparation
- [Pozzi et al. 2004] Pozzi F. et al., 2004, ApJ, 609, 122
- [Rieke et al. 2004] Rieke G.H. et al., 2004, ApJS, 154, 25
- [] Rigopoulou D. et al., 1999, AJ, 118, 2645
- [Rowan-Robinson 2001] Rowan-Robinson M., 2001, ApJ, 549, 745
- [Rowan-Robinson 2004] Rowan-Robinson M. et al, 2004, MNRAS, 351, 1290
- [Sanders & Mirabel 1996] Sanders D.B., Mirabel I.F., 1996, ARA&A, 34, 725
- [Schechter & Dressler 1987] Schechter P.L., Dressler A., 1987, AJ, 94, 563 Calzetti D., Storchi-bergmann T., 1997, AJ, 114, 592
- [Serjeant et al. 2000] Serjeant S.B.G. et al., 2000, MNRAS, 316, 768
- [Smail, Ivison & Blain 1997] Smail I., Ivison R.J., Blain A.W., 1997, ApJ, 490, L5
- [Smail et al. 2002] Smail I., Ivison R.J. Blain A.W. Kneib J.-P., 2002, MNRAS, 331, 495
- [Steidel et al. 2003] Steidel C.C., Adelberger K.L., Shapley A.E. Pettini M., Dickinson M., Giavalisco M., 2003, ApJ, 592, 728
- [] Simasaku K. et al., 2003, ApJ, 586, L111
- [] Spoon H.W.W. et al., 2004a, ApJS, 154, 184
- [] Spoon H.W.W., Moorwood A.F.M., Lutz D., Tielens A.G.G.M., Siebenmorgen R., Keane J.V., 2004b, A&A, 414, 873
- [] Sturm E., Lutz D., Tran D., Feuchtgruber H., Genzel R., Kunze D., Moorwood A.F.M., Thornley M.D., 2000, A&A, 358, 481
- [] Taniguchi Y. et al., 2003, ApJ, 585, 97
- [] Takagi T., Arimoto N., Hanami H., 2003a, MNRAS, 340, 813
- [] Takagi T., Vansevičius V., Arimoto N., 2003b, PASJ, 55, 385
- [] Takagi T., Hanami H., Arimoto N., 2004, MNRAS in press(astro-ph/0405322)
- [] van Dokkum P.G. et al., 2004, ApJ, 611, 703
- [Wada et al. 2003] Wada T. et al., 2003, Infrared Camera (IRC) on board ASTRO-F, In Mather J.C. (Ed), IR Space Telescopes and Instruments, Proc. SPIE, 4850, 179
- [Werner et al. 2004] Werner M.W. et al., 2004, ApJS, 154, 1
- [Xu et al. 2003] Xu C., Lonsdale C.J., Shupe D.L., Franceschini A., Martin C., Schiminovich D., 2003, ApJ, 587, 90