Star Formation At High Redshift
Abstract
I review the observational characteristics of intermediate-to-high redshift star forming galaxies, including their star formation rates, dust extinctions, ISM kinematics, and chemical compositions. I present evidence that the mean rate of metal enrichment, , from 0—3, as determined from nebular oxygen abundance measurements in star forming galaxies, is 0.15 dex per redshift unit for galaxies more luminous than . This rate of chemical enrichment is consistent with the chemical rise in Galactic disk stars. It is less dramatic than, but perhaps consistent with, the enrichment rate of 0.18–0.260.07 dex per redshift unit seen in Damped Ly systems, and it is much less than predicted by many cosmological evolution models. The high-redshift galaxies observed to date are the most luminous examples from those epochs, and thus, trace only the greatest cosmological overdensities. Star formation in the first 1-2 Gyr appears sufficient to elevate ambient metallicities to near or above the solar value, implying efficient production and retention of metals in these densest environments.
1 Understanding Star Formation at High Redshift
Even those of us in the relatively junior stages of our careers remember the days when “high-redshift” meant for galaxies and for a handful of the most distant known quasars. Less than 15 years ago, the discovery of a “normal” galaxy at a redshift greater than one was breaking news (e.g, TG ,Te ), and even the quasars at numbered only 11 Turner . Today, by contrast, catalogs of “normal” star forming galaxies at redshifts of contain several thousand entries Se03 , a testament to the rapid growth in the fields of star formation and galaxy evolution at cosmological distances, enabled by advances in astronomical instrumentation. The limits of discovery continue to be pushed aside with reports of star forming galaxies at redshifts exceeding Tan Rhoads2 when the universe was less than 800 Myr old!
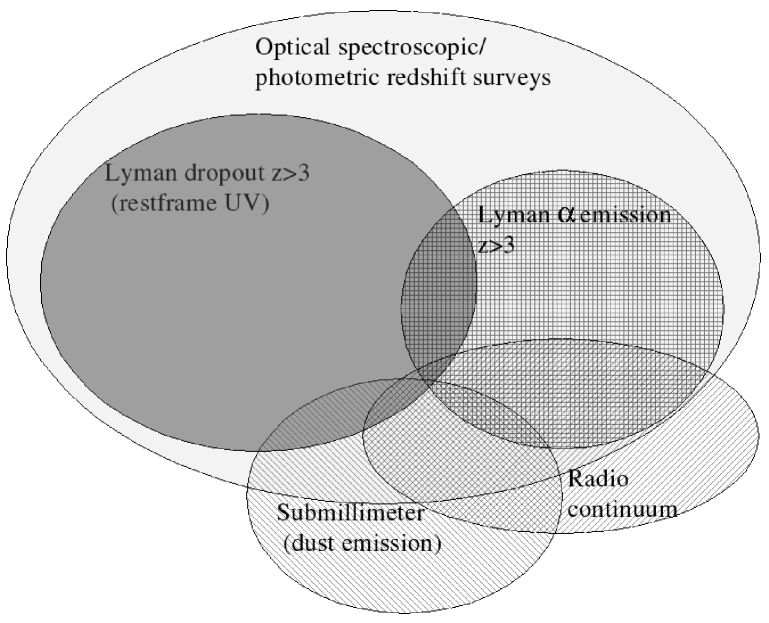
In this review I will focus on observational measurements of four basic parameters of star forming galaxies at redshifts : star formation rates, extinctions, kinematics of the ISM, and chemical composition. Specifying even the average properties for these distant galaxies is complicated by the use of multiple observational detection and selection techniques, each with its own inherent biases toward certain classes of galaxies. Figure 1 uses a Venn-style schematic to illustrate the variety and degree of overlap between techniques. By far the most prolific approach has been the traditional optical spectroscopic survey to identify restframe optical and ultraviolet stellar and interstellar features (e.g., CFA CFRS Col Strauss Coil ,). More specialized methods for finding high redshift objects include the continuum imaging using Lyman dropout approach Se03 and spectroscopic surveys for Lyman emission Rhoads1 . These preferentially select, respectively, objects with strong measurable continuum and objects with strong emission lines having particularly favorable ISM geometries to allow the escape of Lyman photons, respectively. Other approaches employ multi-frequency radio continuum imaging Carilli Ivison or use millimeter-wave measurements to detect dust emission from the host galaxy Hughes Eales Webb . These varied detection techniques complement one another by selecting different (but perhaps related, and sometimes overlapping) high redshift galaxy populations. However, they complicate efforts to ascribe “average” properties to these distant objects. For the purposes of this review, I will focus on the optically selected objects and simply caution that these are unlikely to be representative of the mean extinctions, star formation rates, or chemical composition of radio-selected or submillimeter-selected samples. Furthermore, I address only galaxies powered by star formation and do not consider objects with active nuclei.
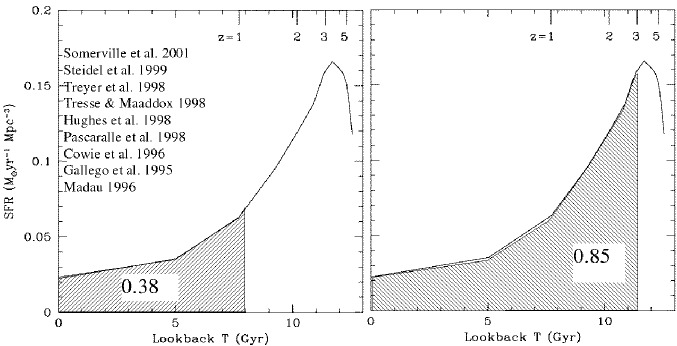
The environment governing star formation in galaxies at high redshift is shaped by the prevailing universal conditions imposed by cosmology. Distant galaxies reside in a younger, smaller, more gas-rich, more metal-poor universe where the supply of the raw material for star formation is abundant. Figure 2 shows a plot of star formation rate density versus lookback time based on the models and observational data of Som , using a cosmology with , , and . The redshift corresponding to a particular lookback time is indicated along the top axis of the figure. This type of graph is shown at every meeting pertaining to cosmological star formation, but usually in the form “SFR vs. redshift”, which, in my opinion, obscures its utility. By plotting SFR vs. linear time, one can integrate by eye under the curve to obtain the fraction of stars formed, the fraction of metals produced, or the fraction of gas consumed since a particular epoch. For instance, in the left panel, the hatched region shows that 28% of the stars and metals in the present universe have formed since , in the last 8 Gyr. The hatched region in the right panel shows that 85% of the stars and metals have formed since , in the last 10.3 Gyr. Such estimates serve as starting points to inform our investigation of the star formation and metal enrichment process within individual galaxies over these epochs. While models and computer simulations have provide predictions for the evolutionary rate of star formation and metal enrichment in the universe Pei Cen Nagamine , observational probes of capable of testing these predictions within individual galaxies are just now becoming available.
2 Star Formation Rates and Extinctions
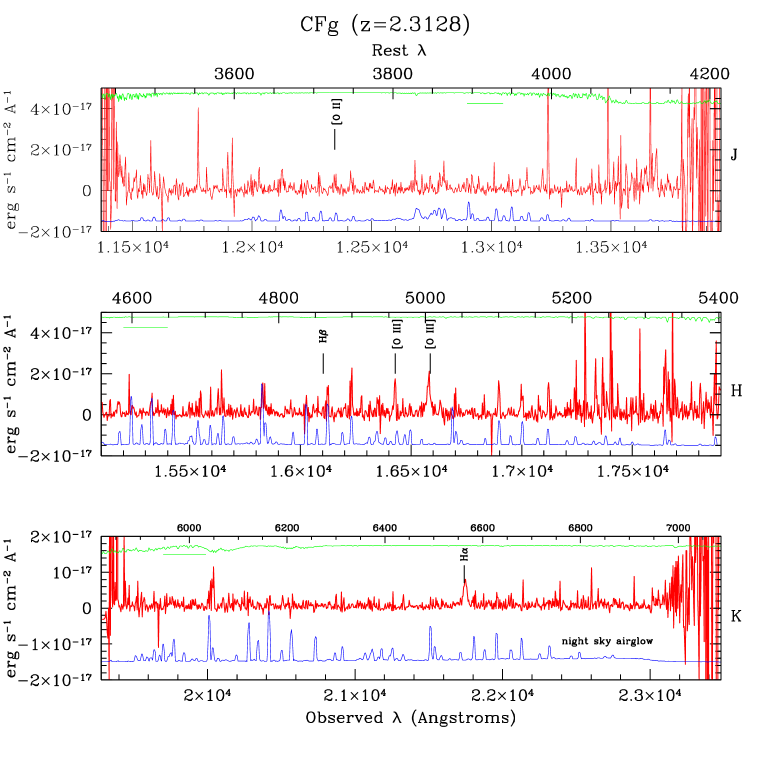
Measurements of star formation rates in distant galaxies have been based primarily upon restframe ultraviolet ( or ) luminosities observed in the optical Madau Sawicki Pascarelle Steidel . Implied star formation rates for 1 galaxies range from M to over 100 M for galaxies which have luminosities several magnitudes brighter than . However, debate about the amount of extinction internal to these high redshift galaxies rendered the derived star formation rates uncertain by factors of several. More recently, it has become possible to use restframe optical emission lines observed in near-infrared windows to make independent estimates which are less affected extinction Teplitz Pettini98 KK00 Pettini01 . Figure 3 shows one such measurement of a galaxy at using the Keck Telescope+NIRSPEC spectrograph KK00 . The H emission line is seen in the K-band, the and [O III]4959,5007 lines are seen in the H-band, and the [O II]3727 line is a marginal detection in the J-band. Strong night sky airglow lines swamp the signal from distant galaxies and make this type of measurement challenging. Targets must be chosen to lie at redshifts where the strong diagnostic emission lines fall between airglow lines, and spectral resolutions exceeding R=2000 are desirable to separate terrestrial atmospheric features from nebular lines.
Despite these difficulties, measurements of the H luminosities of high redshift galaxies provide an independent estimate of the star formation rates. Comparisons show that the SFRs derived from H luminosities are systematically higher by factors of 2-3 compared to those inferred from the ultraviolet continuum luminosities at redshifts from Glazebrook Yan Hopkins out to Pettini01 KK00 . Extinctions at are generally 1 mag versus 2–4 mag at 1500Å. The lack of correlation between the extinction-corrected UV and -derived star formation rates suggests that the extinctions are poorly known, or that the geometry of the dust and gas relative to the stars leads to different extinctions toward each Erb1 . Galaxies with fainter observed fluxes appear to have ratios closer to unity, suggesting that extinction may significantly shape the spectral energy distributions of high redshift galaxies, i.e., higher extinctions lead to more extreme ratios and lower observed fluxes Erb1 . Deep submillimeter continuum searches reveal a population of extremely red galaxies galaxies (EROs) with infrared colors and large dust content, suggesting that some, still debated, fraction of star formation activity is be hidden from view at restframe optical wavelengths Lutz Ivison Frayer .
3 ISM Kinematics
Velocity-revolved optical and near-infrared spectra of stellar and interstellar lines high redshift objects reveal the dynamical state of the galaxies and the impact of star formation on their ISM. rotation curves of spiral galaxies out show a well-developed Tully-Fisher relationship at 8 Gyr lookback times, although the relation may be offset by 0–2 mag toward higher luminosities Vogt Rix Simard Bohm Ziegler , consistent with a brightening due to increased star formation at earlier epochs. However, the degree of luminosity evolution is uncertain and may be strongly color-dependent. At redshift beyond , spiral galaxies become very rare and yet to be studied kinematically. In the few cases where spatially-resolved emission lines are observed at , the implied velocity widths and masses are 80-200 km s-1 and 1–6 . However, neither spatially resolved lines nor 1-D H and [O III] emission line widths in galaxies show a correlation with galaxy luminosity, suggesting that the observed kinematics reflect bulk motions of merging sub-clumps or gas in extended halos of galaxies being assembled instead of true rotation curves Erb1 KK00 . The overall linewidths are larger at than at Pettini01 Erb1 Erb2 , consistent with the idea of continuing galaxy growth and more ordered dynamics as a galaxy ages. Given that recognized morphological types are replaced by an increasing fraction of mergers, irregulars, and compact galaxies (“proto-galaxies”?) at Giavalisco Driver , emission line kinematics probably do not provide a reliable means of estimating their masses Pettini01 Erb1 . Star formation regions producing the ionized gas tracers are unlikely to sample the full gravitational potential of their host systems. This effect is observed in local samples of compact and irregular galaxies where the 1-dimensional profiles can be much more narrow than the neutral HI 21-cm profiles, indicating that the star formation activity covers only a small portion of the potential well Pisano .
Spectra of high-redshift galaxies also reveals systematic differences between the velocities of the cool or hot ambient ISM, ionized star-forming ISM, and Ly emitting regions, where present. Species seen in absorption against the starburst continuum are systematically blue-shifted by 100–500 km s-1 compared to the H and other nebular tracers of the star formation regions Pettini01 Erb1 Erb2 . This is interpreted as a signature of galactic-scale outflows powered by stars and supernovae, such as those seen in more local starbursts (e.g., Marlowe Johnson Heckman Martin ). The redshift of the Ly line relative to the starburst region is understood to be a radiative transfer effect whereby the photons on the blue wing of the line are preferentially absorbed and scattered by neutral hydrogen leading to an asymmetric line profile, an effect also observed in local galaxies Kunth . The impact of dust and extinction on the inferred internal kinematics of galaxies is also largely unknown.
4 Chemical Compositions
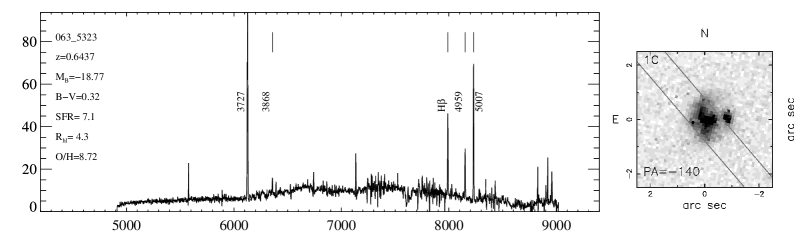
Direct measurements of metallicities111Here I mean primarily the nebular oxygen abundance as tracer of overall gas-phase metallicity. in distant galaxies are now becoming routine, spurred on by larger telescopes and more capable spectrographs used in deep galaxy surveys. Classical nebular diagnostic techniques are applied to emission lines from star forming galaxies to estimate a globally averaged gas-phase oxygen abundance using the ratios of strong H, [O II]3727, and [O III] emission lines KKP . Figure 4 shows a 3600 s Keck spectrum and an HST F814W broadband optical image of a starforming galaxy at from the DEEP Groth Strip Survey Ke03 . This galaxy might be considered typical of those at similar redshift, having only the strongest emission lines measurable, and having an irregular appearance, with a possible companion.
Pioneering surveys at KZ CL initially indicated that intermediate redshift field and compact starburst galaxies followed the same correlation between luminosity and metallicity (i.e., the L-Z relation) observed in local samples (e.g., Faber Lequeux SKH ). However for luminous objects at redshifts , near-infrared nebular spectroscopy of the rest-frame optical emission lines suggested oxygen abundances between 1/3 and 2.0 times solar22212+log(O/H): The logarithmic abundance by number of oxygen relative to hydrogen, where the solar value is 12+log(O/H)= 8.7 Allende . The oxygen abundance is related to, but distinct from , the mass fraction of metals, often called the metallicity. for the standard solar abundance distribution. (), placing them 2-4 magnitudes more luminous than galaxies with comparable metallicities and making them inconsistent with the local L-Z relation KK00 Teplitz Pettini01 Shapley04 . Samples studied to date include only the most luminous objects at these redshifts, and inclusion of fainter objects in future surveys is needed to tell the whole story. It is noteworthy that the oxygen abundances and [N II]/ ratios of these objects are nearly solar at ages Gyr. These initial results demonstrate that the most luminous (and massive massive?) objects have formed and retained enough metals during the early stages of galaxy formation to enrich their mean ISM metallicity to nearly solar values. Rapid chemical enrichment is also observed in the central regions of high-redshift QSOs Wampler Hamann1 Hamann2 , implying that only a few generations of massive stars are sufficient to greatly enrich the ISM provided that the metals are retained within the gravitational potential wells.

Evidence for evolution of the L-Z relation with epoch, particularly among sub L* galaxies with fainter than , grew on the strength of metallicity measurements in field galaxies from the Groth Strip Survey (DGSS) Ke03 , the Canada-France Redshift Survey (CFRS) fields at LCS , the Calar Alto Deep Imaging Survey (CADIS) Maier , and in the GOODS-North field KK04 . Figure 6 shows the mean L-Z relations for galaxies in four redshift bins out to using data collected from a variety of surveys. At the high-luminosity, metal-rich end of the relation there is much overlap between distant samples and local galaxies. At the faint, metal-poor end of the relation, there appears to be a more dramatic offset from the local relation. This relatively greater evolution of low-luminosity galaxies may be evidence for delayed formation epoch compared to massive galaxies Ke03 Ziegler Kodama . Also plotted are several galaxies which depart from the local L-Z relation by several magnitudes.

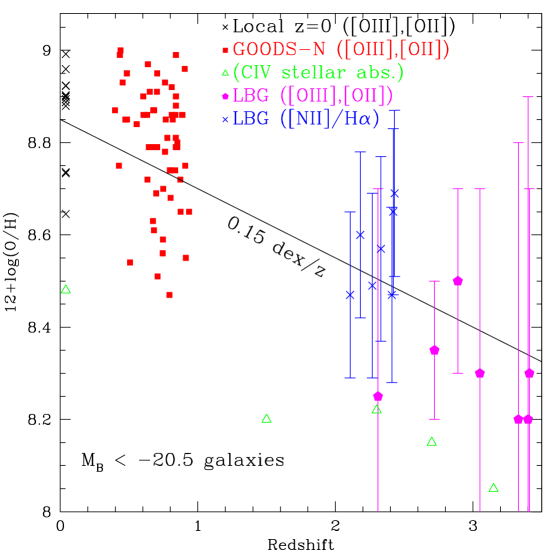
Figure 7 provides another look at the chemo-luminous changes in star forming galaxies by plotting metallicity versus redshift for three different luminosity bins where there are sufficient numbers of objects observed over a range of redshifts. The upper row shows only objects while the lower row includes local galaxies. A linear fit to the data over the range indicates a metal enrichment rate of 0.14 dex per unit redshift. This rate is remarkably consistent with the rate of oxygen enrichment among Galactic disk F and G dwarf stars over the same cosmic interval Reddy . While the star formation and luminosity history of the Milky Way is not well known, and while the dispersion in oxygen abundances for Galactic stars is large, the chemical enrichment process that occurred in the disk of the Milky Way appears to be a good representation of the chemical enrichment process in the bulk of the star-forming galaxies over the last 8 Gyr.
Figure 8 demonstrates that the mean rate of metal enrichment in luminous star forming galaxies over the last 11 Gyr from to is 0.15 dex/z, nearly identical with rate observed at lower redshift. (Note that the slope in this diagram could represented by the unfortunate, but amusing, nomenclature ). This enrichment rate is much less dramatic than the model predictions of 0.3—1 dex/redshift unit Pei Cen Nagamine , but is more nearly consistent with the rates of 0.18—0.26 dex/redshift unit seen in damped Ly absorption systems Prochaska Kulkarni . Cen point out that the overall level of metal enrichment, and the rate of enrichment with time should be functions of local density, with the highest density objects (i.e., galaxies) reaching metal saturation very rapidly at earlier times and less dense regions (i.e., damped Ly and other metal absorption systems) enriching more slowly. Efforts to measure stellar metallicities in distant galaxies using photospheric absorption lines have just begin, but look promising Mehlert . Figure 8 shows that the overall level of metal enrichment as determined from the stellar photospheric C IV absorption lines (triangles; Mehlert ) is systematically 0.2-0.4 dex lower at all redshifts than the determinations from nebular lines, suggesting a possible calibration uncertainty between the methods. The rate of metal enrichment is similar, however.
5 Future Prospects
The existence of a metallicity-luminosity correlation for high redshift galaxies offers the prospect of reliable metallicity estimates for use in modeling spectral energy distributions and dust contributions in the distant universe based on extinction laws and dust properties in nearby galaxies. High redshift galaxies may not be all that different from local starbursts in terms of their metal and dust content, even if the star formation rates are much larger than all but the most impressive Ultra Luminous InfraRed Galaxies (ULIRGS) locally. If mergers are responsible for the dominance of irregular morphologies as galaxies assemble at high redshift, it will be difficult to use observed linewidths or what appear to be rotation curves to measure masses. With adaptive optics and sensitive integral field spectrographs on the largest current telescopes, it will be possible to map velocity fields in galaxies out to to obtain a better dynamical picture. A true understanding of the fundamental galaxy correlations (i.e., Tully-Fisher, L-Z) and how they evolve at high redshift ultimately requires sampling the intrinsically faint sub L* galaxy population at , a feat that will not be easily accomplished with the current generation of telescopes.
References
- (1) Allende Prieto, C. A., Lambert, D. L., & Asplund, M. 2001, ApJ, 556 L63
- (2) Böhm, A., et al. 2004, A&A, 420, 97
- (3) Carilli, C. L., & Yun, M. S. 1999, ApJ, 513, 13
- (4) Carollo, C., M. & Lilly, S. J. 2001, ApJ, 548, L153
- (5) Cen, R., Ostriker, J. P. 1999, ApJ, 519, 109
- (6) Alison L. Coil, Marc Davis, Darren S. Madgwick, Jeffrey A. Newman, Christopher J. Conselice, Michael Cooper, Richard S. Ellis, S. M. Faber, Douglas P. Finkbeiner, Puragra Guhathakurta, Nick Kaiser, David C. Koo, Andrew C. Phillips, Charles C. Steidel, Benjamin J. Weiner, Christopher N. A. Willmer, Renbin Yan (the DEEP2 Survey team), ApJ, 2004, 609, 525
- (7) Colless M.M., Peterson B.A., Jackson C.A., Peacock J.A, Cole S.M., Norberg P., Baldry I.K., Baugh C.M., Bland-Hawthorn J., Bridges T.J., Cannon R.D., Collins C.A., Couch W.J., Cross N., Dalton G.B., De Propris R., Driver S.P., Efstathiou G., Ellis R.S., Frenk C.S., Glazebrook K., Lahav O., Lewis I.J., Lumsden S., Maddox S.J., Madgwick D.S., Sutherland W.J., Taylor K., 2003, (2dF) astro-ph/0306581
- (8) Dietrich, M., Hamann, F., Shields, J. C., Constantin, A., Heidt, J., Jäger, K., Vestergaard, M., & Wagner, S. J. 2003, ApJ, 589, 722
- (9) Driver, S. P., Fernandez-Soto, A., Couch, W. J., Odewahn, S. C., Windhorst, R. A., Phillips, S., Lanzetta, K., & Yahil, A. 1998, ApJL, 496, L93
- (10) Eales, S., Lilly, S., Gear, W., Dunne, L., Bond, J. R., Hammer, F., Le F vre, O., Crampton, D., 1999, ApJ, 515, 518
- (11) Erb, D. K., Shapley, A. E., Steidel, C. C., Pettini, M., Adelberger, K. L., Hunt, M. P., Moorwood, A. F. M., & Cuby, J. 2003, ApJ, 591, 101
- (12) Erb, D. K., Steidel, C. C., Shapley, A. E., Pettini, M., & Adelberger, K. L. 2004, ApJ, 612, 122
- (13) Faber, S. M. 1973, ApJ, 179, 423
- (14) Frayer, D. T., Reddy, N. A., Armus, L., Blain, A. W., Scoville, N. Z., & Smail, I. 2004, AJ, 127, 728
- (15) Giavalisco, M., Steidel, C. C., & Macchetto, F. D. 1996, ApJ, 470, 189
- (16) Glazebrook, K., Blake, C., Economou, F., Lilly, S., Colless, M. 1999, MNRAS, 306, 843
- (17) Hamann, F. & Ferland, G. 1992, ApJL, 391, L53
- (18) Heckman, T. M., Lehnert, M. D., Strickland, D. K., & Armus, L. 2000, ApJS, 129, 493
- (19) Huchra, J., Davis, M., Latham, D.& Tonry, J. (CFA) 1983, ApJS 52, 89
- (20) Hopkins, A. M., Connolly, A. J., Szalay, A. S. 2000, AJ, 120, 2843
- (21) Hughes, D. H., Serjeant, S., Dunlop, J., Rowan-Robinson, M., Blain, A., Mann, R. G., Ivison, R., Peacock, J., Efstathiou, A., Gear, W. et al. 1998, 394, 241
- (22) Ivison, R. J., Greve, T. R., Smail, I., Dunlop, J. S., Roche, N. D., Scott, S. E., Page, M. J., Stevens, J. A., Almaini, O., Blain, A. W. 2002, MNRAS, 337, 1
- (23) Johnson, K. E., Leitherer, C., Vacca, W. D., & Conti, P. S. 2000, AJ, 120, 1273
- (24) Kobulnicky, H. A., Willmer, C. N. A., Weiner, B. J., Koo, D. C., Phillips, A. C., Faber, S. M., Sarajedini, V. L., Simard, L., & Vogt, N. P. 2003, ApJ, 599, 1006
- (25) Kobulnicky, H. A., Kennicutt, R. C., & Pizagno, J. 1998, ApJ, 514, 544
- (26) Kobulnicky, H. A, & Kewley, L. A. 2004, ApJ, in press
- (27) Kobulnicky, H. A, & Koo, D. C. 2000, ApJ, 545, 712
- (28) Kobulnicky, H. A. & Zaritsky, D. 1999, ApJ, 511, 118
- (29) Kodama, T. et al. The Subaru/XMM-Newton Deep Survey Team, 2004, MNRAS, in press
- (30) Kulkarni, V. P., Fall, M. P., Lauroesch, J. T., York, D. G., Welty, D. E., Khare, P., & Truran, J. W. 2004, ApJ, in press (astro-ph/0409234)
- (31) Kunth, D., Mas-Hesse, J. M., Terlevich, E., Terlevich, R., Lequeux, J., & Fall, S. M. 1998, A&A, 334, 11
- (32) Lequeux, J., Peimbert, M., Rayo, J. F., Serrano, A., & Torres–Peimbert, S. 1979, A&A, 80, 155
- (33) Lilly, S. J., Carollo, C. M., & Stockton, A. N. 2003, ApJ, 597, 730
- (34) Lilly, S.J., Le Fevre, O., Crampton. D., Hammer, F.,Tresse, L., (CFRS) 1995, ApJ, 455, 50
- (35) Lutz, D., et al. 2001, A&A, 378, 70
- (36) Madau, P., Ferguson, H. C., Dickinson, M. E., Giavalisco, M., Steidel, C. C., Fruchter, A. 1996, MNRAS, 283, 1388
- (37) Marlowe, A. T., Heckman, T. M., Wyse, R. M., & Schommer, R. 1995, ApJ, 438, 563
- (38) Martin, C. L. 2005, ApJ, submitted (astro-ph/0410247)
- (39) Maier, C., Meisenheimer, K., & Hippelein, H. 2004, A&A, 418, 475
- (40) Mehlert, D., et al. 2002, A&A, 393, 809
- (41) Nagamine, K., Fukugita, M., Cen, R., & Ostriker, J. P. 2001, ApJ, 558, 497
- (42) Pascarelle, S. M., Lanzetta, K. M., Fern ndez-Soto, A. 1998, ApJ, 508, 1
- (43) Pei, Y. C., Fall, S. M., & Hauser, M. G. 1999, ApJ, 522, 604
- (44) Pettini, M., Kellogg, M., Steidel, C. C., Dickinson, M., Adelberger, K. L., Giavalisco, M. 1998, ApJ, 508, 539
- (45) Pettini, M., Shapley, A. E., Steidel, C. C., Cuby, J.-G., Dickinson, M., Moorwood, A. F. M., Adelberger, K. L., Giavalisco, M. 2001, ApJ, 554, 981
- (46) Pisano, D. J., Kobulnicky, H. A., Guzmán, R., Gallego, J., & Bershady, M. A. 2001, AJ, 122, 1194
- (47) Prochaska, J. X., Gawiser, E., Wolfe, A. M., Castro, S., & Djorgovski, S. G. 2003, ApJL, 595, L9
- (48) Reddy, B. E., Tomkin, J., Lambert, D. L., & Allende Prieto, C. 2003, MNRAS, 340, 304
- (49) Rhoads, J. E., Dey, A., Malhotra, S., Stern, D., Spinrad, H., Jannuzi, B. T., Dawson, S., Brown, M. J. I., & Landes, E. 2003, AJ, 125, 1006
- (50) Rhoads, J. E., Xu, C., Dawson, S., Dey, A., Malhotra, S., Wang, J., Jannuzi, B. T., Spinrad, H., & Stern, D. 2004, ApJ, 611, 59
- (51) Rix, H., Guhathakurta, P., Colless, M., & Ing, K. 1997, MNRAS, 285, 779
- (52) Sawicki, M. J., Lin, H., Yee, H. K. C. 1997, AJ, 113, 1
- (53) Shapley, A. E., Erb, D. K., Pettini, M., Steidel, C. C., & Adelberger, K. L. 2004, ApJ, 612, 108
- (54) Simard, L. & Pritchet, C. J. 1998, ApJ, 505, 96
- (55) Skillman, E. D., Kennicutt, R. C., & Hodge, P. 1989, ApJ, 347, 875
- (56) Somerville, R. S., Primack, J. R., & Faber, S. M. 2001, MNRAS, 320, 504
- (57) Strauss, M. A., et al. 2002, AJ, 124, 1810
- (58) Steidel, C. C., Adelberger, K. L., Giavalisco, M., Dickinson, M., Pettini, M. 1999, ApJ, 519, 1
- (59) Steidel, C. C., Adelberger, K. L., Shapley, A. E., Pettini, M., Dickinson, M., & Giavalisco, M. 2003, ApJ, 592, 728
- (60) Taniguchi, Y., Ajiki, M., Nagao, T., Shioya, Y., Kashikawa, N., Kodaira, K., & Kaifu, N. 2004, astro-ph/0407542
- (61) Thompson, D. J., & Djorgovski, S. 1991, ApJ, 371, L55
- (62) Turner, E. 1991, AJ, 101, 5
- (63) Turnshek, D. A., Macchetto, F., Bencke, M. V., Hazard, C., Sparks, W. B., & McMahon, R. G., 1991, ApJ, 382, 26
- (64) Teplitz, H. I., McLean, I. S., Becklin, E. E., Figer, D. F., Gilbert, A. M., Graham, J. R., Larkin, J. E., Levenson, N. A., Wilcox, M. K. 2000, ApJ, 533, L65
- (65) Vogt, N. P., Forbes, D. A., Phillips, A. C., Gronwall, C., Faber, S. M., Illingworth, G. D., & Koo, D. C. 1996, ApJL, 465, L15
- (66) Wampler, E. J., Williger, G. M., Baldwin, J. A., Carswell, R. F., Hazard, C., & McMahon, R. G. 1996, A&A, 316, 33
- (67) Webb, T. M., Eales, S., Foucaud, S., Lilly, S. J., McCracken, H., Adelberger, K., Steidel, C., Shapley, A., Clements, D. L., Dunne, L. 2003, ApJ, 582, 6
- (68) Yan, L., McCarthy, P. J., Freudling, W., Teplitz, H. I., Malumuth, E. M., Weymann, R. J., Malkan, M. A. 1999, ApJ, 519, 47
- (69) Ziegler, B. L., et al. 2002, ApJL, 564, L69