High Resolution Mid - Infrared Imaging of the AGB Star RV Boo with the Steward Observatory Adaptive Optics System
Abstract
We present high resolution (0.1), very high Strehl ratio (0.970.03) mid-infrared (IR) adaptive optics (AO) images of the AGB star RV Boo utilizing the MMT adaptive secondary AO system. RV Boo was observed at a number of wavelengths over two epochs (9.8 m in May 2003, 8.8, 9.8 and 11.7 m in February 2004) and appeared slightly extended at all wavelengths. While the extension is very slight at 8.8 and 11.7 m data, the extension is somewhat more pronounced at 9.8 m. With such high Strehls we can achieve super-resolutions of 0.1 by deconvolving RV Boo with a point-spread function (PSF) derived from an unresolved star. We tentatively resolve RV Boo into a 0.16 FWHM extension at a position angle of 120 degrees. At a distance of 390 pc, this corresponds to a FWHM of 60 AU. We measure a total flux at 9.8 m of 14524 Jy for the disk and star. Based on a dust thermal emission model for the observed IR spectral energy distribution and the 9.8 m AO image, we derive a disk dust mass of 1.610-6 M☉ and an inclination of 30 to 45∘ from edge-on. We discuss whether the dust disk observed around RV Boo is an example of the early stages in the formation of asymmetric structure in planetary nebula.
1 Introduction
Extensive mass loss in the asymptotic giant branch (AGB) phase has been well established. However, the mode (or modes) by which this mass loss occurs is less well known. While some objects present CO lines indicative of spherically symmetric mass loss, other objects display much more complicated mass loss line profiles (Knapp et al., 1998; Kerschbaum Olofsson, 1999). A small number of AGB and post-AGB stars display a particular type of anomalous CO features: a very narrow peak (as narrow as 1 km s-1, see Kahane et al. 1998, but generally 5 km s-1), with or without a broader underlying pedestal feature (with widths of 10-20 km s-1). Stars which display just the narrow peak include AC Her, BM Gem, and the Red Rectangle. X Her (Kahane Jura, 1996), RV Boo (Bergman, Kerschbaum, & Oloffson 2000), EP Aqr, RS Cnc, and IRC +50049 display narrow peaks as well as underlying broader components. Jura Kahane (1999) interpret the narrow features in these objects as reservoirs of dust and molecular gas which are nearly at rest with respect to the central AGB stars. They suggest that a binary companion is necessary in these cases in order to entrain gas and dust into a circumbinary disk (Morris, 1987; Mastrodemos & Morris, 1998, 1999); both AC Her and the Red Rectangle have companions. The broader CO line components are interpreted as spherical outflows or in some cases (RS Cnc and X Her) as bipolar outflows (Kahane Jura, 1996). RV Boo is unusual since interferometric images of its CO emission suggest the presence of a large disk in Keplerian rotation (Bergman et al., 2000). Interestingly, Vinkovic et al. (2004) has also recently imaged another sort of asymmetry in AGB star envelopes – a small bipolar outflow observed in the near-IR around the AGB star IRC+10011.
Determining the spatial structure of winds around AGB stars is important for constraining models of bipolar planetary nebulae. Generalized Interacting Stellar Winds (GISW) models of planetary nebulae invoke some initial structure which can collimate and shape the fast winds produced by these objects. In these models, the existence or non-existence of this structure regulates whether the forming planetary nebula acquires a round, elliptical, or bipolar morphology (Balick Frank, 2002). This pre-existing structure is likely to have formed by the end of the central object’s AGB stage, since a sizable percentage of proto-planetary nebulae display bipolar reflection nebulae. Could the disks and molecular reservoirs observed in CO around AGB stars be the initial stages in the formation of such pre-existing structure? The molecular reservoirs observed by Kahane et al. (1998) may be the diffuse precursors to the formation of a denser disk or torus around the star at the end of the AGB phase. Such dense disks might be capable of collimating the fast winds produced when these objects evolve to the PN phase.
At mid-IR wavelengths, we expect dusty disks around AGB and post-AGB stars to be detected in thermal emission. Do we observe the disks implied by CO observations at these wavelengths? Meixner et al. (1999) observed a number of protoplanetary nebulae (pPNe) in the mid-IR. In those which were resolved, they found two primary mid-IR morphologies – core/elliptical and toroidal. Ueta, Meixner, & Bobrowsky (2000) found that each of these mid-IR morphologies also corresponds to a specific optical morphology. The optically thick core/elliptical mid-IR morphologies possessed bipolar reflection nebulae and heavily obscured central stars. The optically thin toroidal mid-IR morphologies possessed elliptical reflection nebulae and non-obscured central stars. In a number of cases dusty disks have not been observed directly but may collimate reflection nebulae – for instance, Roddier et al. (1995) observe double lobed reflection in the NIR (J and K bands) around the Red Rectangle (IRAS 06176-1036) and Frosty Leo (IRAS 09371+1212). Meixner et al. (1999) resolved the Red Rectangle into an unresolved core and an extended elliptical nebulosity but found Frosty Leo to be unresolved.
RV Boo is an O-rich type b semiregular variable. It varies in luminosity and in spectral class between M5III and M7III with a period of 140 days. Previously, Bergman et al. (2000) observed a 4 diameter disk in CO around RV Boo. They interpret this disk as possibly the first known Keplerian disk around an AGB star. The resolution in CO radio lines is limited to 1-2 even using interferometry; by observing at high resolution in the mid-IR, we can probe the structure of this disk on much finer scales.
Using the unique adaptive secondary mirror AO system at the 6.5m MMT (Wildi et al. 2003, Brusa et al. 2003), we can observe AGB stars at mid-IR wavelengths with 0.1″resolution (Close et al., 2003). Through deconvolution, the nearly perfect images (Strehl ratio0.970.03) produced with AO at the MMT allow resolutions better than that of the FWHM of the diffraction limit of the telescope. With such resolutions, we can probe AGB star and PPN morphologies on finer scales than ever before possible in the mid-IR. Here, we present the first adaptive optics high resolution images of RV Boo.
2 Observations and Data Reduction
Data were taken on the night of 2003 May 13 (UT) at the 6.5m MMT using the adaptive secondary mirror AO system with the BLINC-MIRAC3 camera (Hoffman et al., 1998; Hinz et al., 2000). The adaptive secondary corrected the first 52 system modes at 550 Hz and achieved Strehl ratios as high as 0.97 from 8.8 - 18 m. These Strehl ratios are the highest ever presented in the literature; previous Strehl ratios for large telescopes have rarely exceeded 0.7 at any wavelength. Our unique ability to do AO correction at 10 m leads to very high Strehl ratios regardless of the seeing, airmass, or wind (Close et al., 2003). With the very stable PSFs that result from such high Strehls it is possible to detect structures with spatial scales smaller than the diffraction-limited FWHM (0.98 rad) through the use of deconvolution.
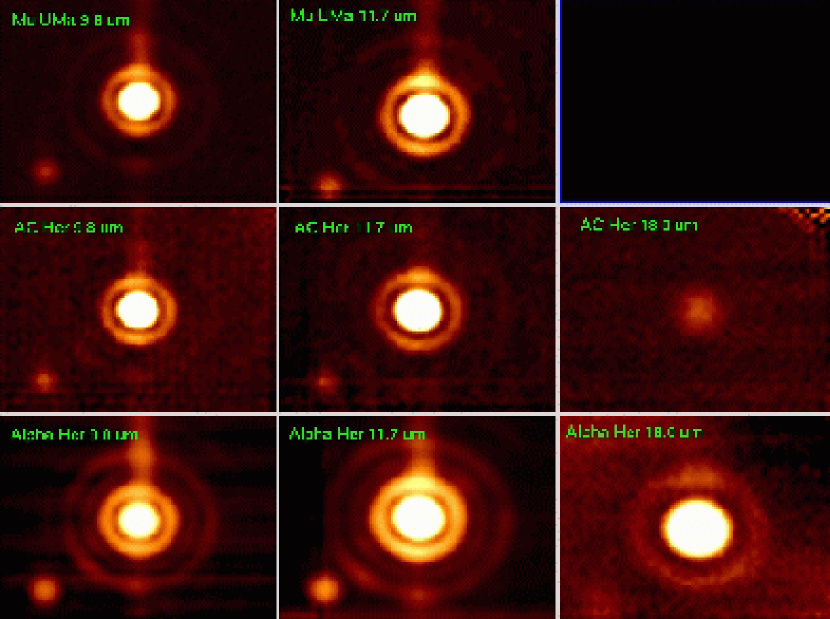
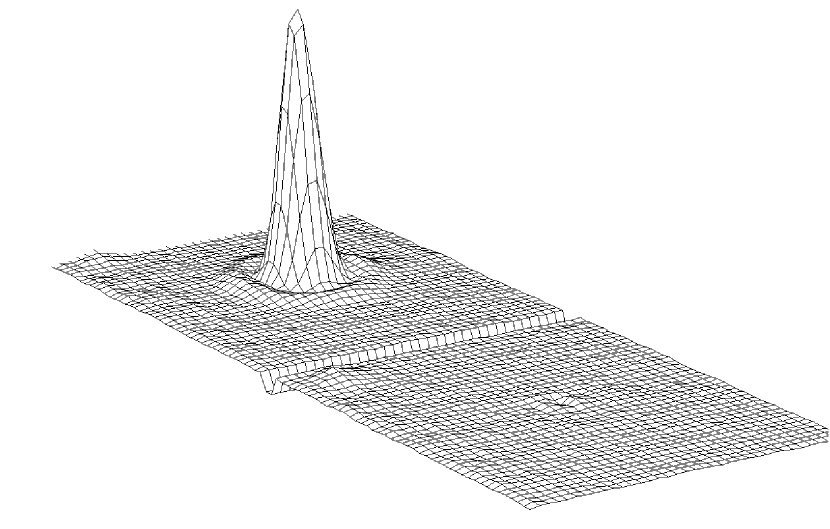
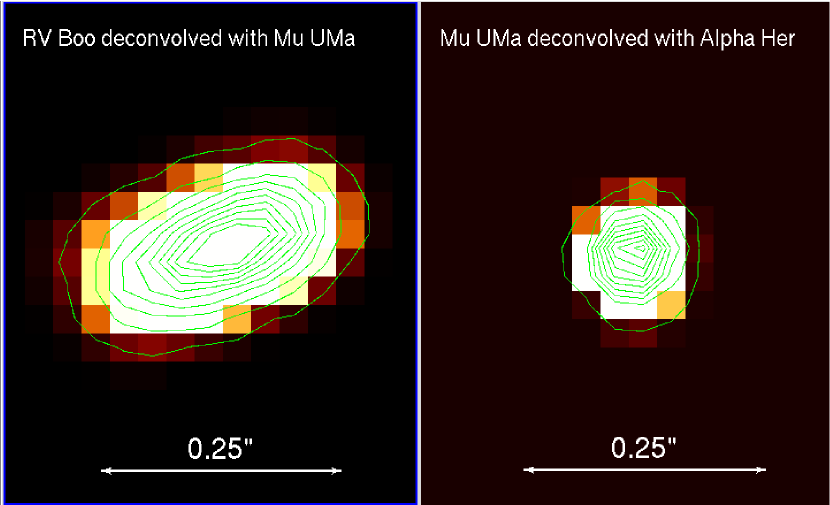
Images of all the PSF stars observed on 2003 May 13 are displayed in Fig. 1. To further illustrate stability, we subtracted one PSF star ( Her) from another observed later in the evening (AC Her). The residuals are displayed in Fig. 2. The residual flux after PSF subtraction is of AC Her’s original flux. Similar residuals resulted from PSF subtractions at 9.8 m and 18 m. Based on these excellent subtractions, we conclude that the PSF obtained from the MIRAC3 camera with the MMT adaptive secondary AO system is extremely stable.
RV Boo was observed in the 9.8 m wavelength band. Point sources UMa and Her were observed in this band before and after RV Boo to use as PSF calibrators. Her is a relatively wide binary with a separation of 4.7 (Jeffers and Vasilevskis, 1978); the brighter component was used as a PSF while the fainter component falls outside our field of view. We note that Her also does not possess a dust shell or other extended structure (Close et al., 2003). To eliminate the high sky background at mid-IR wavelengths, we used a standard chopping/nodding scheme and flat-fielded our data. A chopping frequency of 1 Hz (throw20) was used with a nodding cycle of 60 sec (throw6-8). To avoid saturation of the high sky background, a base integration time of 29 msec was used. These images were coadded to produce an output frame every 15 seconds. For RV Boo, 4 15-second integrations were taken at each of 8 nod positions, giving a total exposure time of 8 minutes. UMa was observed using 8 nod positions, for a total exposure time of 8 minutes. Her was observed using 4 nod positions, for a total exposure time of 4 minutes. We used the internal BLINC cold chopper and kept the AO in closed loop for both chop and nod beam positions.
Flat fields were taken the night of 2003 May 15 (UT). The base integration time was set to 10 msec. These images were coadded every 2 seconds. Flats were taken of the inside of the dome (hot) and the sky (cold). The sky flats were subtracted from the dome flats. The resulting flat fields were normalized by the mean.
To determine an astrometric calibration, we used our 25 November 2002 (UT) observations of the binary star WDS 02589+2137 BU. These data were taken in the M band using MIRAC with the MMT adaptive secondary AO system. At the time of observation, the binary had a position angle of 269∘ and a separation of 0.509 (Mason et al., 2001). To align our RV Boo data with North, we must rotate it by (270∘ – the parallactic angle) at the time of observation. We also determine a plate scale of 88 milliarcsec/pixel from this standard.
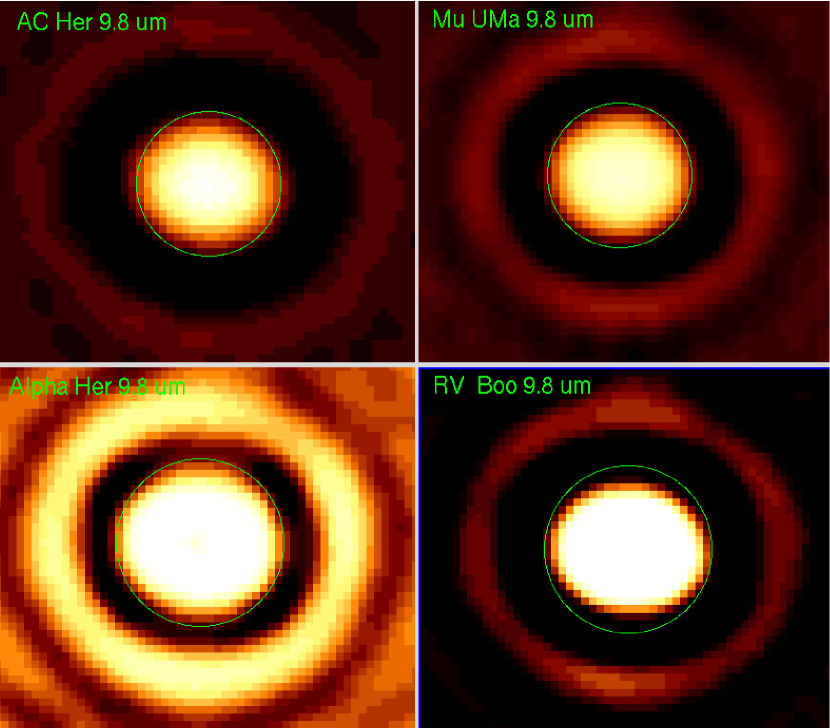
Data were reduced using a custom IRAF pipeline which first flat fields and removes bad pixels. After the pipeline completes these basic data reduction tasks, it then rotates the nod images by (270∘– the parallactic angle) and coadds them so that North is up and East is left. A coadded image of RV Boo alongside similar images of the PSF stars Uma and Her as well as the AGB star AC Her (Close et al., 2003) is presented in Fig. 3. The vertical axis is telescope altitude while the horizontal axis is telescope azimuth. RV Boo appears slightly extended (FWHM4 pixels) relative to the PSF stars (FWHM3.8 pixels.) All three PSF stars are very slightly (eccentricity2) elliptical along the horizontal (azimuthal) direction – this is a systematic instrumental feature of the PSF. However, RV Boo appears somewhat more elliptical (eccentricity5) than the other three stars. We argue that this extension and slight ellipticity is indicative of actual physical structure. The observed extension lies near the limit of resolution of the telescope, however, and is broadened by diffraction. To discern the actual small scale structure of the extension around RV Boo, we must deconvolve it with a PSF star.
In order to determine if the extension we see is real (and not just the result of a vibration in the telescope mount, for instance), we deconvolved each of the 8 RV Boo nod images with the UMa PSF. After subpixel interpolation by 3x (to a new platescale of 29.3 milliarcsec/pixel), we used the Lucy deconvolution algorithm in IRAF with 1000 iterations. We chose to deconvolve for 1000 iterations for two reasons – first, object properties (position angle and deconvolution) vary rapidly up until the 800th iteration. By the 1000th iteration, properties have converged. Secondly, we convolved a set of thermal disk models at inclination angles from edge on of 5, 15, and 30∘ (see §4 for details on our modeling) with the UMa PSF, then deconvolved for 100, 500, 1000, 1500, and 2000 iterations using AC Her (Close et al., 2003) as the PSF. The 1000 iteration deconvolutions best recreated the position angles and eccentricities of our models.
If the extension is real we expect the position angle of the deconvolved semi-major axis to track the parallactic angle as the sky rotates between exposures. We measured position angle and eccentricity for each deconvolution of the 8 individual RV Boo nod images using the tool in IRAF. The tool is only accurate for measuring isophote semi-major position angles to within 6∘ of accuracy. We calculate =5.65∘ as our error in position angle measurements. This error was determined by stretching an image of UMa to 5 eccentricity (about the eccentricity of RV Boo previous to deconvolution), rotating it through a number of angles, and then taking the standard deviation of (measured angle - actual angle) as the error.
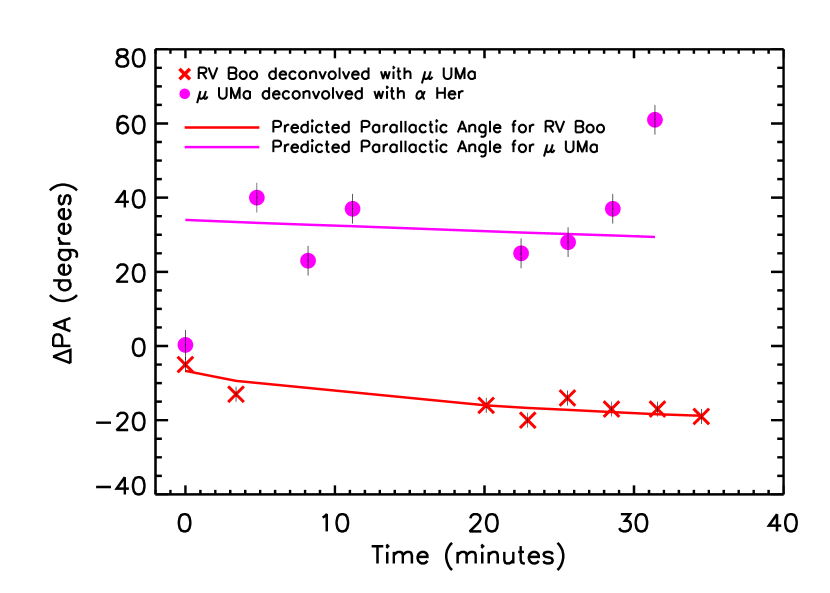
We plot the behavior of the major axis position angle of the deconvolved image (henceforth PA) and parallactic angle with time in Figure 4. We fit the expected parallactic angles (calculated using the SKYCALC software package – Thorstensen (2001)) to the position angle data for each star with a minimized . Thus, PA measures how much the trend in position angle deviates from the trend in parallactic angle. Expected parallactic angles are plotted as solid lines; observed values of PA are plotted using a variety of points. We plot the behavior of PA for RV Boo deconvolved with UMa as the PSF. As a comparison, we plot PA for UMa deconvolved with Her, a PSF deconvolving a PSF (both apparent point sources). The PA values measured from the RV Boo deconvolutions follow the correct rotation of the sky with a reduced of 0.207 for the deconvolution with UMa. Thus, RV Boo’s extension is rotating on the sky to within a probability of 98. In contrast, the PA values measured from the PSF and PSF deconvolution show much more scatter and have a best fit to the parallactic angles with a reduced of 13.2. Hence, the extension of a PSF deconvolved with a PSF is purely an artifact; the probability that PA for UMa deconvolved with Her rotates on the sky is less than 0.1 as one would expect.
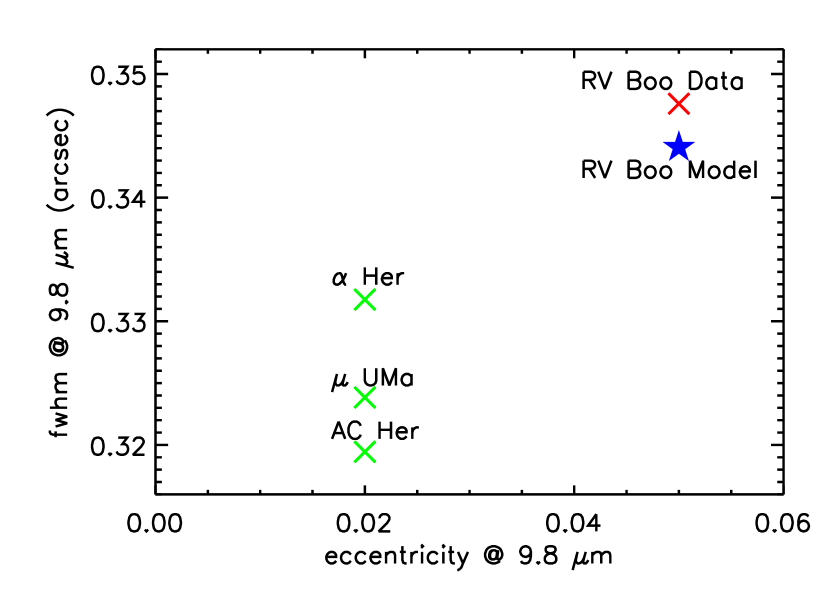
The variation of PSF FWHM with source eccentricity for RV Boo, UMa, Her, and AC Her is presented in Fig. 5. These quantities are also presented in Fig. 5 for the best fit thermal emission model of the RV Boo disk convolved with the UMa PSF (see §4). An extended source should have a larger FWHM and possibly a higher eccentricity (depending on position angle, source shape, etc.) than a point source; RV Boo indeed shows this trend. The RV Boo disk models accurately recreate the FWHM and eccentricity of the RV Boo data. Models were fit to the deconvolved data; the match between convolved model and undeconvolved data implies that 1000 iterations of the Lucy algorithm produces an accurate deconvolution of the RV Boo data. Based on the rotation of the extension with the sky and its non-PSF FWHM and eccentricity, we tentatively conclude that the extension we observe around RV Boo is indeed real and not an artifact of the telescope. However, to strengthen this conclusion, we reobserved RV Boo at a variety of wavelengths at another epoch.
3 Followup Observations
RV Boo was reobserved on the night of 2004 February 2 (UT) at the 6.5m MMT using the adaptive secondary mirror AO system with the BLINC-MIRAC3 camera (Hoffman et al., 1998; Hinz et al., 2000). Similar Strehl Ratios were observed as during the first observations, however, the MIRAC camera was used with a platescale of 0.079 (as opposed to 0.088 during the previous run.) These data was taken during an engineering test and are of considerably lower quality (engineering grade rather than science grade) than the May 2003 dataset.
As before, we used a standard chopping/nodding scheme. A chopping frequency of 1 Hz (throw20) was used. Each object was observed at three different wavelengths (8.8 m, 9.8 m and 11.7 m) and two different nod positions (throw4-5). To avoid saturation of the high sky background, a base integration time of 30-70 msec was used. These images were coadded to produce an output frame every 10 seconds. For RV Boo, 10x10s integrations were taken at 2 nod positions for each wavelength, giving a total exposure time of 200 seconds per wavelength. Boo was observed at 2 nod positions per wavelength, for a total exposure time of 200 seconds per wavelength. We used the internal BLINC cold chopper and kept the AO in closed loop for all chop and nod beam positions. The data were reduced with the same custom IRAF pipeline as before. With shorter total integration times (200 s per wavelength for RV Boo during reobservations vs. 480 s at 9.8 m during the initial observations), our signal to noise during the followup observations is only 65 that achieved during the initial observations.
PSF and data FWHMs for both the May 2003 and February 2004 datasets are presented in Table 1. We estimate an uncertainty in our measurements of 6 milliarcsec from the scatter of the PSF FWHMs in the May data. The FWHM of RV Boo was slightly larger than that of the PSF in all wavelengths in February, however, the extension is within the measurement error for the 8.8 and 11.7 m data. The February RV Boo 9.8 m data possesses a FWHM comparable to that of the May RV Boo data – thus, we reobserve the slight extension found in May in our February dataset. Perhaps it is not surprising that the object appears most extended at 9.8 m – right at the center of a prominent silicon emission feature seen in the ISO spectrum (see 4 and Fig. 7). For RV Boo, we measured eccentricities of 2 in February vs. 5 in May. This may have simply been a function of position angle during the observations. Unfortunately, the engineering grade observations of the only PSF star ( Boo) were found to have low spatial frequency noise and were unsuitable to be used as a PSF for deconvolution. As a test, we deconvolved these observations using the UMa PSF from the previous observations. The February data possessed similar deconvolved source properties (FWHM, position angle, etc.) compared to the May data.
| May 2003 | February 2004 | ||||||
|---|---|---|---|---|---|---|---|
| UMa (PSF)∗ | Her (PSF) | AC Her (PSF) | RV Boo | Boo (PSF) | RV Boo | ||
| 8.8 m | 0.292 | 0.297 | |||||
| 9.8 m | 0.324 | 0.332 | 0.319 | 0.348 | 0.322 | 0.338 | |
| 11.7 m | 0.382 | 0.393 | |||||
∗The uncertainty for all of the FWHMs is 6 milliarcsec.
4 Analysis
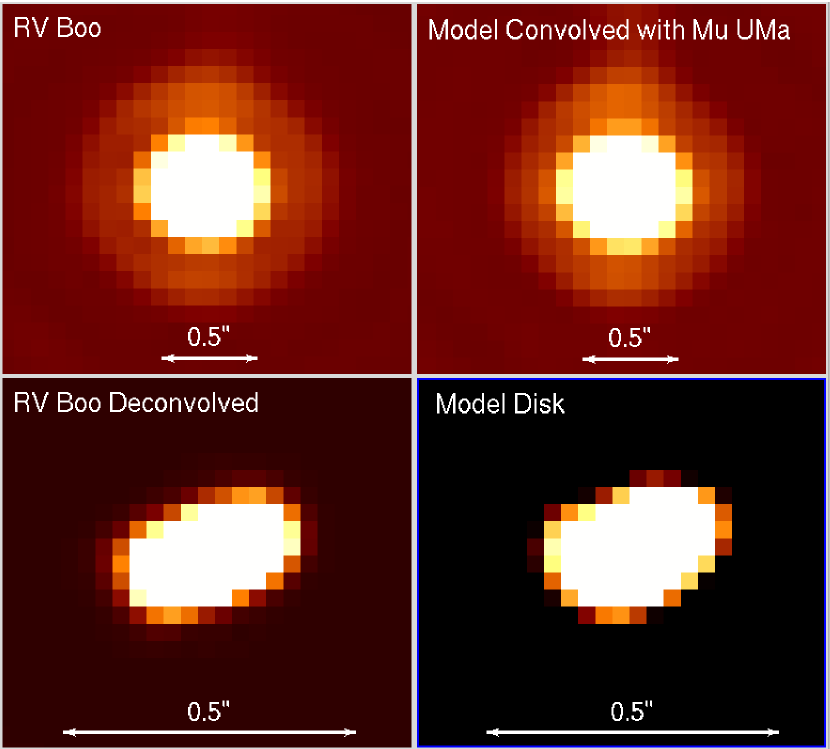
The deconvolved image of RV Boo is presented in Fig. 6. This image was produced by coadding all of the RV Boo nod images which had been deconvolved for 1000 iterations using the Lucy algorithm with UMa as the PSF. (Due to the slight saturation of the Her image, UMa was chosen as the PSF over Her for this analysis.) After deconvolution, the extended structure appears to be a disk seen at an inclination angle between 20 to 30∘ from edge-on (inclination estimated from modeling; see below). From their CO J=2-1 interferometric data, Bergman et al. (2000) found evidence of a rotating disk around RV Boo in the form of a 4 diameter disk with a position angle of 150∘. Using the tool in IRAF, we measured a FWHM at =9.8 m of 0.16 along the major axis and a PA of 120∘. The 9.8 m emission traces dust thermal re-emission; RV Boo heats only a fraction of the dust in the entire CO disk to temperatures where dust is luminous in the mid-IR. If circumstellar gas and dust are well-mixed around RV Boo, we would expect to find a much smaller disk extent at 9.8 m than in CO, since all of the CO will emit, but only the dust near enough to the star to be heated to temperatures of 300 K will emit at 9.8 m. To map out more extension in the dust disk, observations at longer wavelengths (which trace a larger region of dust re-emission) are necessary. We measure a total flux for RV Boo at 9.8 m of 14524 Jy.
At a distance of 390 pc (Perryman et al., 1997), the mid-IR disk of RV Boo subtends a FWHM of 60 AU. RV Boo is a relatively nearby AGB star; it would be more difficult to observe a similar disk around a more distant star like AC Her which is 2 times more distant. Since RV Boo is so nearby relative to the distance of the average AGB star, it is not surprising that such small scale structure usually is unresolved in other systems. Small mid-IR disks around AGB stars could be common but difficult to resolve.
We model the IR emission of RV Boo as an optically thin disk passively heated by the star.111RV Boo has a – color of 1.47 mag; this low reddening implies that the mid-IR emitting region is not obscuring the entire star (as it would be if the dust was spherically distributed around the star) and is largely concentrated along one plane. Thus, we have explicitly modeled the IR emission around RV Boo as a disk. Since we have apriori considered a disk morphology, our model cannot constrain the vertical geometry of the emission. We approximate the stellar photosphere by the Kurucz (1979) model spectrum for M6IIIe stars with an effective temperature of . The dust is taken to be amorphous silicate since RV Boo is an M star. We assume a power-law dust size distribution which is characterized by a lower-cutoff , upper-cutoff and power-law index .222We assume all grains are spherical in shape with being their spherical radius. We take since grains smaller than this will undergo single-photon heating (Draine and Li, 2001) while the observed IR spectral energy distribution of RV Boo does not appear to show evidence for stochastically heated dust, and since larger grains are not well constrained by the currently available IR photometry.
The dust spatial distribution is taken to be a modified power-law where is the inner boundary of the disk which we take to be the location where silicate dust sublimates. For RV Boo with a luminosity (Bergman et al., 2000) submicron-sized silicate dust achieves an equilibrium temperature of and starts to sublimate at . Therefore we take . This functional form has the advantage that on one hand, it behaves like a power-law at larger distances (), and on the other hand it peaks at , unlike the simple power-law which peaks at . The latter is unphysical since one should not expect dust to pile up at where dust sublimates! We take as expected from a stationary outflow. We take which is large enough for our dust IR emission modeling purpose since there is very little dust beyond this outer boundary. Therefore, we have only two free parameters: – the power-law exponent for the dust size distribution and – the dust spatial distribution parameter which determines where the dust peaks.
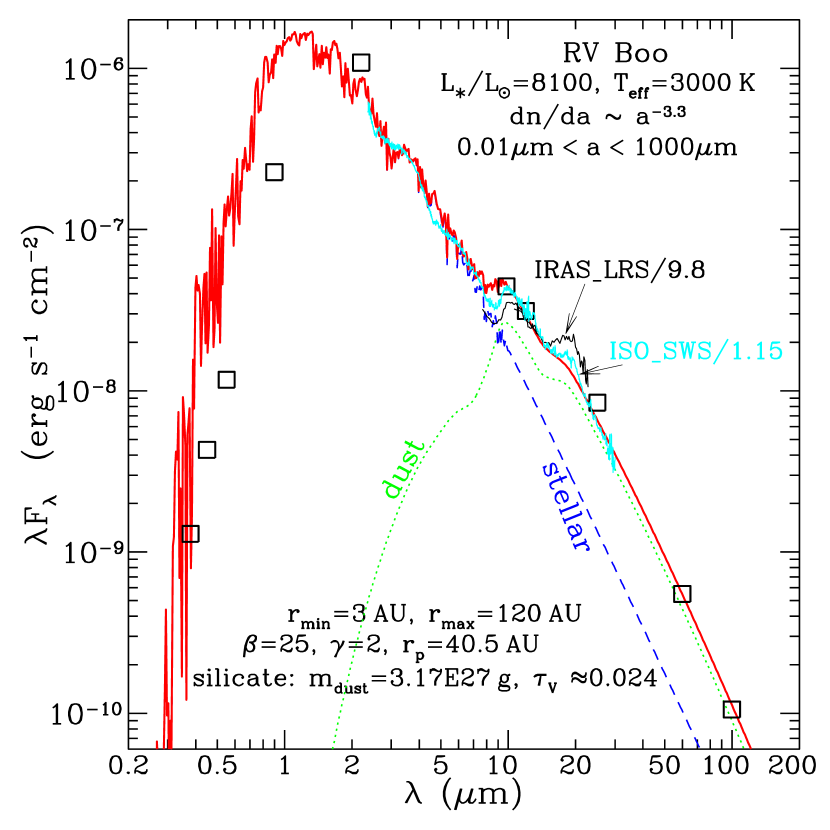
Using the dielectric functions of Draine and Lee (1984) for “astronomical silicates” and Mie theory (Bohren Huffman, 1983), we calculate the absorption cross sections of amorphous silicate grains as a function of size and their steady-state temperatures (as a function of radial distance from the central star) in thermal equilibrium with the illuminating starlight intensity. We then obtain the dust model IR emission spectrum by integrating the dust emission over the entire size range and the entire disk and compare with the 12, 25, 60, and 100 IRAS (Infrared Astronomical Satellite) broadband photometry, the 7.7–22.7 low resolution spectrum obtained with the IRAS Low Resolution Spectrometer (LRS; with a resolution of ), the 2.5–45 high resolution spectrum obtained with the Short-Wavelength Spectrometer (SWS) instrument (with a resolution of ) on board the Infrared Space Observatory,333The IRAS LRS spectrum integrated with the IRAS 12 band filter function results in a factor of higher than the IRAS 12 photometric flux. This is not surprising in view of the fact that RV Boo is a variable star. We have therefore reduced the flux level of the IRAS LRS spectrum by a factor of 9.8 to bring it into agreement with the IRAS 12 broadband photometric data. Similarly, the flux level of the ISO SWS spectrum has also been reduced by a factor of , in order to agree with the IRAS 12 photometry. and the 9.8 photometry presented in this work. We also compare the dust model image at 9.8 convolved with the AO instrument PSF with the AO image of RV Boo and inclined at a variety of inclinations from edge on. A number of models with and inclinations from edge on of 30-45∘ fit the data to within 20 accuracy. In Figures 7 and 8, we respectively show the best-fit IR emission spectrum and disk image. The disk image is also shown convolved with the instrument PSF. spectrum (see Fig. 7) and the AO image (see Fig. 8). The source properties (eccentricity, FWHM) for this model are plotted alongside source properties for the telescope data and PSF stars in Fig. 5. This model, with and , has a total dust mass and an inclination from edge on of 40∘. The dust spatial distribution peaks at . The maximum vertical visual optical depth is , confirming the validity of the optical-thin assumption made at the beginning of this modeling effort.
5 Discussion
Where do the wide variety of PNe shapes come from? Mass loss has practically ended by the PPN stage; therefore, any underlying structure which produces the shape of PN (via theories such as the Generalized Interacting Stellar Wind models) must form by the end of the AGB stage. While PNe possess an extremely wide range of morphologies, Meixner et al. (1999) found two primary mid-IR morphologies for PPNe corresponding to different values of optical depth – optically thick core/elliptical morphologies and optically thin toroidal morphologies. Ueta et al. (2000) found that each of these mid-IR morphologies also corresponds to a specific optical morphology. Optically thick core/elliptical mid-IR morphologies possess bipolar reflection nebulae and heavily obscured central stars (called DUPLEX by Ueta et al. (2000)) while optically thin toroidal mid-IR morphologies possess elliptical reflection nebulae and non-obscured central stars (called SOLE by Ueta et al. (2000)).
The PPNe observed by Meixner et al. (1999) are more evolved objects than AGB stars. Since mass loss has ceased by the PPN stage, the dense core/elliptical dust structures which produce DUPLEX sources (and are the precursors to structures formed during the PN stage) must have formed during the end of the AGB phases. AGB mass loss can be divided into two separate phases: an initial, spherically symmetric AGB wind (10 km s-1), supplanted by a faster superwind (20 km s-1) for a brief period at the end of the AGB phase (Ueta et al. (2000), Renzini et al. (1981)). With the onset of the superwind, mass loss rates are expected to rise by factors of 10 (Steffen et al., 1998). Ueta et al. (2000) propose that this superwind at the end of the AGB phases is intrinsically asymmetric, producing an equatorially flattened toroid which collimates later bipolar structure. However, it is not clear what mechanism could produce the asymmetry.
An AGB star like RV Boo which displays asymmetric structure is an excellent laboratory for studying the very beginnings of PN and PPN structure formation. RV Boo is one member of a set of AGB stars which display hallmarks of asymmetric structure. This small group of AGB stars (20) display very narrow CO linewidths (as narrow as 1 km s-1, see Kahane et al. 1998, but generally 5 km s-1), with or without a broader underlying pedestal feature (with widths of 10-20 km/s). BM Gem displays just a narrow peak, while X Her (Kahane Jura, 1996), RV Boo (Bergman et al., 2000), EP Aqr, RS Cnc, and IRC +50049 display narrow peaks as well as an underlying broader component. Jura Kahane (1999) interpret the narrow features in these objects as reservoirs of dust and molecular gas which are nearly at rest with respect to the central AGB stars. The broader CO line components are interpreted as spherical outflows or in some cases (RS Cnc and X Her) as bipolar outflows (Kahane Jura, 1996).
RV Boo is unusual among these stars since images of its CO emission suggest the presence of a large disk in Keplerian rotation (Bergman et al., 2000). One possible explanation for the presence of the disk is that mass loss from the AGB star has become equatorially enhanced through entrainment by a binary companion (Jura Kahane, 1999; Morris, 1987; Mastrodemos & Morris, 1998, 1999). Could this be the mechanism (in progress) which produces the dense collimating toroid of material invoked by Ueta et al. (2000) – essentially, Ueta’s equatorial superwind? While RV Boo does not have a known companion, a close companion (100 AU) may be currently undetectable.
Interestingly, similar narrow CO line structure has been observed around a number of evolved post-AGB systems – two RV Tauri stars, AC Her (which has only a narrow line without a broad pedestal, suggesting perhaps that mass loss has ceased and only a molecular reservoir remains) and IRAS 08544-4431 (Maas et al., 2003) and the PPN Red Rectangle (Jura et al., 1995). Additionally, a dusty disk has been detected around IRAS 08544-4431 and a Keplerian disk has been detected in CO around the PPN Red Rectangle (Bujarrabal et al., 2003). Are the disks around IRAS 08544-4431 and the Red Rectangle similar to that around RV Boo, but at the corresponding later stages of evolution? All three of these objects have known companions, a fact which supports theories of binary entrainment for disk formation.
If RV Boo is nearing the end of its AGB phase, the disk structure observed in CO and in the mid-IR may be the beginning of a denser disk/torus capable of collimating the fast winds produced during the PN phase. However, to determine whether the structure around RV Boo is the precursor of PPN and PN structure requires knowledge of the evolutionary status of RV Boo and also whether objects of a similar evolutionary status possess similar CO and mid-IR structure. RV Boo is a “red” SRb, according to the classification system of Kerschbaum Hron (1992). They interpret the red SRb’s as a transitional stage between the blue SRb’s, which sit near the tip of the Red Giant branch, and Miras, which mark the tail end of the AGB phase. With a moderate mass loss rate of 10-7 M⊙ yr-1, RV Boo is probably not at the very tail end of AGB evolution. However, Kerschbaum Hron (1992) use single-star stellar models to constrain evolutionary state. If disk formation does require a binary companion, estimates of evolutionary state from such models may be inaccurate for RV Boo and similar objects.
While narrow CO lines have been found in 20 of AGB stars, it remains to be seen how common extended mid-IR structure such as that observed around RV Boo occurs in AGB stars. Indeed, even if mid-IR structure around narrow CO line AGB stars is common, it remains to be seen how similar RV Boo’s CO and mid-IR structures are to those of other AGB stars with narrow CO lines. This is a comparison we can not yet make, since no other similar object has both been mapped interferometrically in CO and imaged at high resolution in the mid-IR. Several of these objects share very similar observational properties with RV Boo – in particular, X Her, EP Aqr, RS CNc, BM Gem, and EU And. It would be worthwhile observe these objects both at high resolution in the mid-IR and also interferometrically in CO.
6 Conclusions
We present the first high resolution (0.1″) very high Strehl ratio (0.970.03) mid-IR images of RV Boo utilizing the MMT adaptive secondary AO system. These are the first IR images presented in the literature with such high Strehl ratios; previous Strehl ratios for large telescopes have hardly exceeded 70 at any wavelength. RV Boo was observed at a number of wavelengths over two epochs (9.8 m in May 2003, 8.8, 9.8 and 11.7 m in February 2004) and appeared slightly extended at all wavelengths. While the extension is within the measurement error for the 8.8 and 11.7 m data, the extension is more pronounced in the 9.8 m data. The slight extension seen in the 9.8 m data from both May 2003 and February 2004 suggests that the mid-infrared structure around RV Boo is marginally resolved at 9.8 m.
Because of our high Strehl ratios which leads to extremely stable PSFs, we can deconvolve our images with those of PSF stars for a super-resolution of 0.1″. Based on the rotation of the extension with the sky and its non-PSF FWHM (at 8.8-11.7 m) and eccentricity, we conclude that the extension around RV Boo is indeed real and not an artifact of the telescope.
We tentatively detect a 60 AU FWHM (0.16 at 390 pc) disk at 9.8 m around RV Boo. Previously, Bergman et al. (2000) found a 4 disk in CO with a position angle of 150∘; we find a position angle of 1206∘ for the 9.8 m disk. We measure a total disk flux of 14524 Jy at 9.8 m. We closely reproduce the observed IR spectral energy distribution and the AO image in terms of an optically thin dust disk consisting of amorphous silicates with a power-law size distribution. We estimate a disk inclination angle of 30 to 45∘ from edge on and a disk dust mass of 1.610-6 M☉.
References
- Balick Frank (2002) Balick, B., & Frank, A. 2002, ARA&A, 40, 439
- Bergman et al. (2000) Bergman, P., Kerschbaum, F., & Olofsson, H. 2000, A&A, 353, 257
- Bohren Huffman (1983) Bohren, C.F., & Huffman, D.R. 1983, Absorption and Scattering of Light by Small Particles (New York: Wiley)
- Brusa et al. (2003) Brusa, G. et al. 2003, Proc. SPIE 4839, 691
- Bujarrabal et al. (2003) Bujarrabal, V., Neri, R., Alcolea, J., & Kahane, C. 2003, A&A, 409, 573
- Close et al. (2003) Close, L.M., Biller, B.A., Hoffmann, W., Hinz, P.M., Bieging, J., Wildi, F., Lloyd-Hart, M., Brusa, G., Fisher, D., Miller, D., & Angel, R. 2003, ApJ, 598, L35
- Draine and Lee (1984) Draine, B.T., & Lee, H.M. 1984, ApJ, 285, 89
- Draine and Li (2001) Draine, B.T., & Li, A. 2001, ApJ, 551, 807
- Hoffman et al. (1998) Hoffman, W. et al. 1998, SPIE 3354, 647
- Hinz et al. (2000) Hinz, P.M. et al. 2000, SPIE 4006, 349
- Jeffers and Vasilevskis (1978) Jeffers, H.M. & Vasilevskis, S. 1978, AJ, 83, 411
- Jura et al. (1995) Jura, M., Balm, S.P., & Kahane, C. 1995, ApJ, 453, 721
- Jura Kahane (1999) Jura, M., & Kahane, C. 1999, ApJ, 521,302
- Kahane Jura (1996) Kahane, C., & Jura, M. 1996, A&A, 310, 952
- Kahane et al. (1998) Kahane, C., Barnbaum, C., Uchida, K., Balm, S.P., & Jura, M. 1998, ApJ, 500, 466
- Kerschbaum Hron (1992) Kerschbaum, F., & Hron, J. 1992, A&A, 263, 97
- Kerschbaum Olofsson (1999) Kerschbaum, F., & Oloffson, H. 1999, A&AS, 138, 299
- Knapp et al. (1998) Knapp, G.R., Young, K., Lee, E., & Jorissen, A. 1998, ApJS, 210, 231
- Kurucz (1979) Kurucz, R.L. 1979, ApJS, 40, 1
- Maas et al. (2003) Maas, T., Van Winckel, H., Lloyd Evans, T., Nyman, L.-A., Kilkenny, D., Martinez, P., Marang, F., & van Wyk, F. 2003, A&A, 405, 271
- Mason et al. (2001) Mason, B.D., Wycoff, G.L., Hartkopf, W.I., Douglass, G.G., & Worley, C.E. 2001, AJ, 122, 3466
- Mastrodemos & Morris (1998) Mastrodemos, N. & Morris, M. 1998, ApJ, 497, 303
- Mastrodemos & Morris (1999) Mastrodemos, N. & Morris, M. 1998, ApJ, 523, 357
- Meixner et al. (1999) Meixner, M., Ueta, T., Dayal, A., Hora, J.L., Fazio, G., Hrivnak, B.J., Skinner, C.J., Hoffman, W., & Deutsch, L.K.)] 1999, ApJS, 122, 221
- Morris (1987) Morris, M. 1987,PASP,99,1115
- Olofsson et al. (2002) Olofsson, H., Gonzalez Delgado, D., Kerschbaum, K., & Shöier, F.L. 2002, A&A, 391, 1053
- Perryman et al. (1997) Perryman, M.A.C., Lindegren, L., Kovalevsky, J., Hog, E., Bastian, U., Bernacca, P.L., Creze, M., Donati, F., Grenon, M., Grewing, M., Van Leeuwen, F., Van Der Marel, H., Mignard, F., Murray, C.A., Le Poole, R.S., Shrijver, H., Turon, C., Arenou, F., Froeschle, M., & Petersen, C.S. 1997, A&A, 323, L49
- Renzini et al. (1981) Renzini, A. 1981, in Physical Processes in Red Giants, ed. I. Iben & A. Renzini (Dordrecht: Reidel), 431
- Roddier et al. (1995) Roddier, F., Roddier, C., Graves, J.E., & Northcott, M.J. 1995, ApJ, 443, 249
- Steffen et al. (1998) Steffen, M., Szczerba, R., & Schönberner, D. 1998, A&A, 337, 149
- Thorstensen (2001) Thorstensen, J.R. 2001, Skycalc User’s Manual, (Tucson:NOAO, contributed software)
- Ueta et al. (2000) Ueta, T., Meixner, M., & Bobrowsky, M. 2000, ApJ, 528, 861
- Van Winckel et al. (1998) Van Winckel, H., Waelkens, C., Waters, L.B.F.M., Molster, F.J., Udry, S. & Bakker, E.J. 1998, A&A, 336, L17
- Vinkovic et al. (2004) Vinkovic, D., Blocker, T., Hofmann, K.-H., Elitzur, M., & Weigelt, G. 2004, MNRAS, 352, 852
- Wildi et al. (2003) Wildi, F., Brusa, G., Riccardi, A., Lloyd-Hart, M., Martin, H.M., & Close, L.M. 2003, proc. SPIE 4839, 155