Multi-density model of the ionised gas in NGC 253 using radio recombination lines
We have imaged the H92 (8.3 GHz), H75 (15 GHz), and H166 (1.4 GHz) Radio Recombination Lines (RRLs) from NGC 253 at resolutions of 4.5 pc (0.4′′) , 2.5 pc (0.2′′) and 53 pc (4.5′′) respectively. The H92 line arises from individual compact sources, most of which possess radio continuum counterparts. The line widths range from 200 km s-1 for the sources near the radio nucleus to 70-100 km s-1 for the extranuclear ones. These lines are emitted by gas at a density 104 cm-3. The remainder of the cm-wave RRLs arise in lower density gas (500 cm-3) with a higher area filling factor and with ten times higher mass. A third component of higher density gas (104 cm-3) is required to explain the mm-wave RRLs.
Key Words.:
Galaxies: individual: NGC 253 – Galaxies: ISM – Galaxies: starburst – Radio lines: galaxies – Radio lines: ISM1 Introduction
NGC 253 is a nearby (D=2.5 Mpc; 1′′=12 pc) highly inclined spiral galaxy, undergoing a vigorous starburst (LFIR=31010 ; Telesco & Harper 1980) in the central 100 pc region. The ongoing star formation is concentrated along an inclined ring. A number of compact near and mid-IR (NIR and MIR) sources have been discovered in this region (Forbes, Ward, and Depoy 1991; Forbes et al. 1993; Piña et al. 1992; Keto et al. 1993; Sams et al. 1994). Optical imaging by Watson et al. (1996) revealed the presence of four star clusters, which were identified with individual MIR/NIR sources (see also Forbes et al. 2000). The morphology of the radio continuum emission, which is unaffected by dust extinction, is quite different. Turner and Ho (1985) discovered a linear chain of compact sources at 15 GHz, which were studied in detail by Antonucci and Ulvestad (1988) and Ulvestad and Antonucci (1997; hereafter UA97). The latter were able to classify the brighter compact sources as synchrotron or free-free dominated, based on the derived spectral indices. Kalas and Wynn-Williams (1994) and Sams et al (1994) showed that most of the infrared sources are regions of low dust extinction and are not coincident with the radio sources. Hence, the radio sources and the infrared-optical sources seem to trace very different types of objects. In particular, the peak of the NIR emission is offset by about 3.5′′ southwest from the peak of the radio continuum emission (the radio nucleus). There is no associated radio emission towards the NIR peak and only weak NIR emission is observed near the radio nucleus. High resolution radio continuum observations with the Very Large Array (VLA) suggest that the radio nucleus hosts an Active Galactic Nucleus (AGN; Turner & Ho 1985, UA97), which was subsequently confirmed (Mohan et al. 2002, Weaver et al. 2002). The NIR continuum peak, identified as a region of active star formation, also coincides with the position of the emission peaks of various ionised gas tracers ([NeII]: Böker, Krabbe and Storey 1998; Keto et al. 1999; Br : Forbes et al. 1993; optical continuum and line emission: Engelbracht et al. 1998; Watson et al. 1996; Forbes et al. 2000).
The immediate product of the starburst process, with its associated high star formation rate and efficiency, is a young massive stellar population. This population can studied through its surrounding ionised gas, the properties of which are determined partly by the ionising stars themselves, and partly by gas dynamics. Recent star formation is well traced by NIR emission, except in regions of high dust extinction. However, such highly obscured star formation can be probed by radio continuum and hydrogen radio recombination line (RRL) emission (except in cases where the continuum optical depth due to free-free emission is much larger than unity). RRL emission is insensitive to dust extinction, arises only in thermal gas, and can be imaged at arcsecond resolution. NGC 253 was the first extragalactic object (excluding the Magellanic Clouds) to have been detected in RRLs (Seaquist & Bell, 1977). This line emission was initially modelled as being stimulated by the background nuclear emission (Shaver, Churchwell & Walmsley, 1978; Mebold et al., 1980). The first interferometric observations of RRLs from NGC 253 were carried out by Anantharamaiah & Goss (1990) at higher frequencies (the H166, H110 and the H92 lines at 1.4 GHz, 4.8 GHz and 8.3 GHz respectively) using the VLA. Models indicated that these lines arise due to internal emission from high density gas (ne104 cm-3; similar to compact HII regions). Puxley et al. (1997) observed mm-wave RRLs from this galaxy and suggested that the origin of the RRL emission at all frequencies is spontaneous emission from optically thin HII regions. A total ionisation rate of (3.7 0.8)1053 s-1 was derived, an order of magnitude higher than that derived from infrared emission lines. The ionisation budget and hence the star formation rate as determined by RRLs depends on the nature of the line emission, which is not yet fully understood. High resolution observations (1.3′′ or 16 pc) of the 8.3 GHz RRL from NGC 253 were carried out by Anantharamaiah & Goss (1996). They showed that the line emission peaks at the radio nucleus (as do the higher frequency RRLs as well; Zhao et al. 2001). They detected much weaker line emission near the NIR peak, which is unexpected, since the infrared peak is probably the most active star forming site in this galaxy. Using the high resolution H92 and H75 data presented in this work, the RRL emission from the radio nucleus alone was studied separately and the results were presented by Mohan et al. 2002. Based on the results of the line emission models, it was concluded that the ionising source for the RRL emitting gas is probably a central low luminosity AGN with weak X-ray emission, which was subsequently confirmed through observations (Weaver et al., 2002).
In order to investigate the nature of RRL emission in this galaxy, and hence the nature of obscured star formation, we have performed high resolution observations of RRLs in NGC 253 at multiple frequencies using the VLA. The 8.3 GHz H92 line and the 15 GHz H75 line were observed using the VLA in the A configuration, which constitute the highest resolution RRL observations to date (0.4′′ and 0.2′′ respectively). These line emissions from the radio nucleus were studied separately and have been described in detail in Mohan et al. (2002). The current paper deals with the remainder of this cm-wave RRL emission. We have carried out these observations in order to (1) locate the sites of high frequency RRL emission and identify radio continuum counterparts to the line emitting sources, (2) to investigate the nature of the radio nucleus and the IR peak, based on their RRL emission, and (3) separate the diffuse and compact RRL emission in an attempt to construct a multi-density model of the ionised gas in NGC 253, using multi-frequency RRL data, similar to Arp 220 (Anantharamaiah et al., 2000). The 1.4 GHz H166 line emission was observed at a resolution of 4′′ using the VLA in the BnA configuration and the C configuration data presented in Anantharamaiah & Goss (1990) were re-analysed. The aim was to better localise the large-scale line emission and hence (1) constrain the projected lateral size of the line emitting gas and thus obtain more accurate models, (2) investigate the relative importance of externally stimulated emission versus internal (spontaneous) emission at 1.4 GHz compared to higher frequencies and (3) check the reality of the observed position offset between the low frequency and high frequency RRL emission found by Anantharamaiah & Goss (1990) using the C and D configuration data.
2 Observations
| Parameter | 1.4 GHz | 8.3 GHz | 15 GHz |
|---|---|---|---|
| VLA configuration | BnA | A | A |
| Date of observation | 01 Oct 95 | 9 & 12 Jul, | 26 Jun 99 |
| 9 Oct 99 | |||
| of RRL (MHz) | 1424.7(H166) | 8309.4 | 15281.5 |
| 1374.6(H168) | (H92) | (H75) | |
| Bandwidth (MHz) | 3.03 | 24.2 | 46.9 |
| # of channels, # IF | 31, 4 | 31, 1 | 15, 1 |
| Spectral resolutiona (km s-1) | 41.1 | 56.4 | 122.6 |
| Shortest baseline (k) | 2.4 | 7 | 12 |
| Synthesized beam (′′′′) | 5.073.79 | 0.500.28 | 0.310.14 |
| Phase calibrator | 0023-263 | 0116-219 | 0118-272 |
| Bandpass calibrator | 0023-263,3C48 | 2251+158 | 2251+158 |
| Peak continuum (mJy/beam) | 675 | 40 | 37 |
| Continuum noise (mJy/beam) | 0.13 | 0.04 | 0.13 |
| Noise per channel (mJy/beam) | 0.26 | 0.12 | 0.35 |
| aThe spectral resolution after off-line Hanning smoothing. | |||
2.1 Centimetre-wave RRLs: 8.3 GHz and 15 GHz observations
The 8.3 GHz H92 and the 15 GHz H75 recombination lines from NGC 253 were observed using the VLA in the A configuration and the observational parameters are listed in Table 1. Only part of the 8.3 GHz dataset was used to study the weak line emission since the remaining data were affected by the 3 MHz ripple in the VLA waveguide system111See VLA Test Memorandum 158 by C.L. Carilli. (however, Mohan et al. 2002 used all of the data since the much stronger nuclear line emission is far less affected by the ripple). All data analysis were made using standard algorithms available within the software AIPS. The continuum emission at 8.3 GHz and 15 GHz was imaged. Offline Hanning smoothing was applied to the line data to reduce the effects of Gibb’s ringing (Taylor et al., 1999). The line emission at both frequencies were imaged after applying corrections for the observed positional offsets (see Sect. 3.1).
2.2 Decimetre-wave RRLs: 1.4 GHz data
NGC 253 was observed at 1.4 GHz using the VLA in the BnA configuration and the observational details are listed in Table 1. The archival C configuration data were reprocessed and are described in the appendix. The BnA array observations were performed in the 4 IF mode of the correlator in order to observe both the H166 and the H168 lines simultaneously. The continuum emission was imaged and deconvolved simultaneously with emission from strong sources within the primary beam of 30′. The continuum emission from NGC 253 is surrounded by negative bowls of emission due to missing short spacing visibilities. Bandpass calibration every half hour proved adequate to track the time variation of the bandshape to an accuracy of 1 %. Both the H166 and the H168 lines were detected in the line cubes and the line parameters were found to be consistent in the two datasets.
3 Results
3.1 Centimetre-wave RRLs: 8.3 GHz and 15 GHz observations

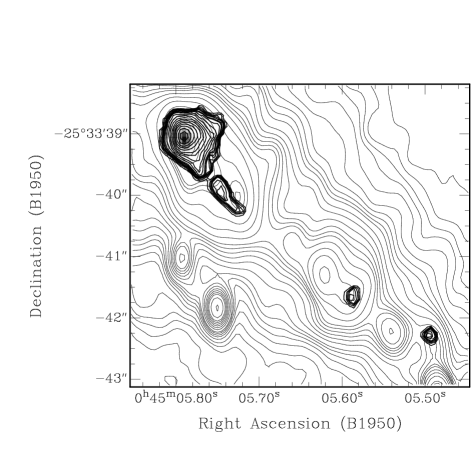
The continuum images made at both 8.3 GHz and 15 GHz are consistent with the images published by UA97; the continuum flux densities of individual compact sources agree to within 10 %. However, the positions of these sources in the 8.3 GHz and 15 GHz continuum images do not coincide. This positional discrepancy can be modelled as a relative global offset, indicating the uncertainty in the positions of the phase calibrators as a probable cause. Adopting the positions of compact sources in the A configuration 15 GHz image of UA97, the positional offsets were derived to be +0.036′′0.01′′ in R.A. and +0.14′′0.01′′ in Dec for the 8.3 GHz data, and +0.021′′0.007′′ in R.A. and +0.012′′0.006′′ in Dec for the 15 GHz data, which were then applied to the data. All positions quoted in this paper are relative to 5.7541.8222The corrected (B1950.0) coordinates of 5.7541.8 are 00h45m05s.751, 25∘33′41′′.85 at 8.3 GHz and 00h45m05s.750; 25∘33′41′′.86 at 15 GHz.. The images of continuum emission at the two frequencies are shown in Fig. 1 and Fig. 2.

The integrated H92 emission image using the full resolution dataset is shown in Fig. 3a overlaid on an image of the continuum emission from the region. The emission from the inner 25 pc region is shown in Fig. 3b, overlaid on a higher resolution 15 GHz continuum image. The line emission is spatially extended, with the peak of the emission coinciding with the peak of the radio continuum (radio nucleus). This nuclear line emission was discussed in detail in Mohan et al. (2002). The strongest line emission arises in an extended region surrounding the nucleus, spread over 15 pc. In addition, multiple compact line emitting sources were found to lie along the larger continuum disk. The morphology of the H92 line emission is quite complex and is discussed in detail in Sect. 4. The velocity field of the ionised gas in the 15 pc region indicates that the velocity gradient is almost in the east-west direction and the value increased from 200 to 230 km s-1 from east to west, consistent with the observations of Anantharamaiah & Goss (1996). The analysis of the velocity field is not undertaken in this paper.
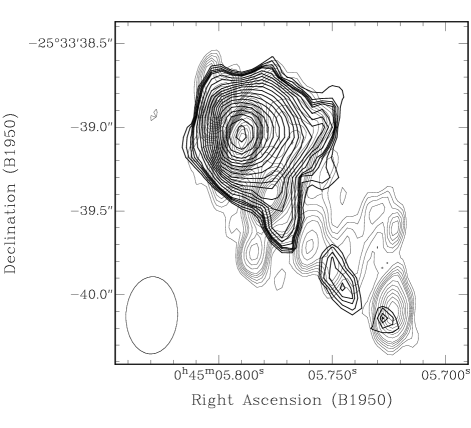
The 15 GHz line cube was used to search for sources of H75 line emission. The channel images of the H75 line emission as well the H75 spectra towards the two sources are shown in Fig. 4. The peak of the line emission is coincident with the radio nucleus and the only other source of RRL emission arises from a compact source 0.35′′ northwest of the nucleus. This source seems to have corresponding H92 line emission at 8.3 GHz, associated with the continuum source 5.7638.9 (Sect. 4), and is the second strongest line emitting source at the latter frequency.


3.2 Decimetre-wave RRLs: 1.4 GHz data
The 1.4 GHz continuum image is shown in Fig. 5. The data for both the RRLs were combined and the line emission was imaged after offline Hanning smoothing. The line emission coincides with the position of the peak of the continuum emission and is marginally spatially resolved. The line does not increase in strength by more than 10 % in images made at lower resolution. Hence the synthesized beam (5.1′′3.8′′) covers almost all of the line emitting region. The spectrum obtained from the combined dataset towards the continuum peak is shown in Fig. 6. The line parameters are listed in Table 2.
| Source | Peak flux | Central velocitya | FWHMb | Integrated flux |
|---|---|---|---|---|
| density (mJy/beam) | (km s-1) | (km s-1) | (10-23 W m-2) | |
| 1.4 GHz H168 line emission (BnA configuration) | ||||
| 7.4′′5.2′′ area | 1.8 0.1 | 200 20 | 160 14 | 1.6 0.25 |
| 8.3 GHz H92 line emissionc (A configuration) | ||||
| 5.4942.3 | 0.5 0.1 | 201 7 | 73 17 | 1.2 0.3 |
| 5.5941.6 | 0.5 0.1 | 172 7 | 65 16 | 1.0 0.3 |
| 5.7240.1 | 0.46 0.09 | 170 15 | 101 23 | 1.4 0.3 |
| 5.7539.9 | 0.54 0.09 | 175 10 | 112 20 | 1.8 0.3 |
| ‘15 pc region’ | 3.2 0.15 | 194 5 | 211 12 | 20 2 |
| 15 GHz H75 line emissionc (A configuration) | ||||
| Nucleus | 1.8 0.3 | 224 17 | 230 40 | 23 3 |
| 5.7638.9 | 1.6 0.3 | 205 18 | 230 43 | 20 3 |
| a Heliocentric velocity, optical definition. | ||||
| b Corrections for finite velocity resolution not applied. | ||||
| c All sources identified by coordinates are spatially unresolved. See Table 1 for synthesized beam sizes. | ||||


The RRL emission from NGC 253 was imaged by Anantharamaiah & Goss (1990) at low resolution, using the VLA in the C and D configurations. The 1.4 GHz line emission was found to be shifted SE from the peak of the continuum and the 4.8 GHz and 8.3 GHz line emissions. Subsequently, the D configuration data were found to exhibit problems in the spectral domain and was hence unusable. The reanalysed C configuration data (appendix) shows the line emission to be centred on the continuum peak. Hence the positional offset for the 1.4 GHz line emission presented earlier by Anantharamaiah & Goss (1990) is not confirmed.
4 The morphology and analysis of the extended H92 RRL emission
In this section, the morphology of the extended H92 line emission is analysed in order to identify the individual line emitting sources and derive their properties. Continuum counterparts can be associated with most, but not all, of the line emitting sources. We identify each of the RRL sources by the continuum counterpart or the nearest continuum source. There are two compact line sources to the SW (Fig. 3a), and the central region consists of two additional compact sources along with the extended 15 pc sized nuclear emission (Fig. 3b). These four extranuclear line sources are described in the next section, followed by a discussion of the emission from the central 15 pc region.
4.1 The extranuclear H92 sources


The western most line source (seen in Fig. 3a) is nearly coincident with the continuum source 5.4942.3. A significant fraction of its continuum emission is thermal (the 8.3 GHz–23 GHz spectral index is 0.28 0.36; UA97), supporting its association with the line emission. The line emitting region 1.5′′ east of this source (Fig. 3a) is displaced 0.1′′ southwest of the compact continuum source 5.5941.6. This object is the second most prominent RRL source in the lower resolution image of Anantharamaiah & Goss (1996) and is probably associated with the IR peak (see Sect.s 5.2 and 6.1). Two additional sources of compact H92 line emission are detected in the central region (Fig. 3b). The western source is close to the continuum source 5.7240.1. The latter exhibits a flat spectral index from 4.8 GHz up to 23 GHz and was identified by UA97 as the brightest thermal source in NGC 253. The eastern source, however, has no obvious continuum counterpart, and in fact lies in a region of minimum continuum emission. Nevertheless, the nearest continuum source 5.7539.9 will be used to refer to this line emitting source. The H92 spectra towards these extranuclear line sources are presented in Fig. 7. These line sources are spatially unresolved and the spectral parameters are listed in Table 2.
4.2 The H92 emission in the central 15 pc region
Anantharamaiah & Goss (1996) found that the strongest H92 emission arises from the region surrounding the nucleus. Our observations, which have three times improved angular resolution, can spatially resolve this central emission, which peaks at the radio nucleus. High resolution channel images of this 15 pc region are shown in Fig. 8. The line emission in this region can be resolved into four discrete components, as can be seen in Fig. 8, though the identification of the individual sources is uncertain due to the complex morphology and the low signal to noise. However, each of the sources can be best identified in different channel images. One or more channels were identified where the sources can be distinguished from the surrounding emission (the southern source at a velocity of 119.0 and 90.8 km s-1, the westernmost at 203.6 km s-1 and the two northern sources at 231.9 and 260.1 km s-1). These channels were used to derive the peak positions by fitting spatially unresolved gaussians using the AIPS task JMFIT. The errors in the positions were determined by the fitting procedure. Given the low signal-to-noise of the emission (the peak emission is in the range of 5-9 ), a simultaneous 3-d deconvolution of all four line sources was not attempted.
| Source | RA | Dec |
| (B1950.0) | (B1950.0) | |
| The four H92 sources (see Fig. 9) | ||
| 1 | 0s.002 (2) | 2′′.90 (5) |
| 2 | 0s.022 (2) | 2′′.31 (5) |
| 3 | 0s.026 (1) | 2′′.87 (2) |
| 4 | 0s.044 (1) | 2′′.80 (2) |
| The second H75 source | ||
| 5.7638.9 | 0s.019 (2) | -2′′.94 (5) |
| NOTE: The coordinates are with respect to 00h45m05s.751; 25∘33′41′′.85, which is the (B1950.0) position of 5.7541.8 in the 8.3 GHz image after applying positional corrections (Sect. 3.1). Positive offsets are for eastward and northward directions. The gaussian fitting errors in the final decimal place are given in parenthesis. | ||
The derived positions of these four sources are listed in Table 3 and are also marked in Fig. 9a, which shows a high resolution image of the integrated line emission from this region. The offsets between the marked positions and those of the line peaks in the figure are due to blending of emission from the four sources. In Fig. 9b, the integrated line emission is overlaid on a high resolution 15 GHz continuum image. Apart from the nucleus, the source immediately to the west coincides with a strong continuum source that is not listed in the catalogues of UA97. This H92 line source also has a H75 line emission counterpart (Fig. 4). The remaining two H92 sources do not have obvious continuum counterparts. The H92 spectra towards each of the four sources are shown in Fig. 10 and their line parameters are summarised in Table 4. The sum of the H92 emissions from the four sources is (181)10-23 W m-2, comparable to the total emission of (20 2)10-23 W m-2 from the entire region. Hence all of the extended emission observed within the 15 pc region can indeed be accounted for in terms of four individual compact sources.
| Source | Peak line | Central | FWHMb | Integrated flux | Continuumc | Sourced | ||
| name | flux density | velocitya | (10-23 W m-2) | (mJy/beam) | size | |||
| (mJy/beam) | (km s-1) | (km s-1) | H92 | H75 | 8.3 GHz | 15 GHz | ||
| source 1e | 0.5 0.1 | 220 | 150 | 2 | 9.1 | 10.5 | 9.5 | unres. |
| source 2 | 0.6 0.1 | 180 10 | 220 20 | 3.9 0.4 | 9.1 | 30 | 26 | unres. |
| source 3 | 0.75 0.06 | 200 10 | 240 22 | 5.1 0.9 | 20 3 | 34 | 35 | unres. |
| source 4 | 1.15 0.06 | 192 6 | 198 13 | 6.7 0.5 | 23 3 | 64 | 59 | unres. |
| a Heliocentric velocity, optical definition. | ||||||||
| b Corrections for finite velocity resolution not applied. | ||||||||
| c Continuum flux per synthesized beam measured at the position of the line emission. | ||||||||
| d Spatially unresolved, angular size 0.35′′. | ||||||||
| e The H92 parameters of source 1 are less certain. | ||||||||


Anantharamaiah & Goss (1990) imaged the H92 emission at a resolution of 7.4′′5.2′′ and detected a total line emission of 4410-23 W m-2, whereas our observations account for only 25.510-23 W m-2 over the entire disk. The remainder must be spatially extended so as to fall below the surface brightness sensitivity of the current observations. In this section, we have decomposed the observed H92 emission into eight distinct compact sources. The positional offsets between these line sources and the associated continuum sources are typically 0.1′′. These offsets are therefore significant when compared to the size of the synthesized beam. The continuum emission in NGC 253 is dominated by non-thermal radiation, whereas RRLs arise in thermal gas. Hence a spatial offset between the two emission regions could well exist, as in the case of NGC 1808 at high resolution (Kotilainen et al., 1996). These offsets are probably due to lower surface brightness of thermal compared to nonthermal emission, coupled with source confusion due to the high surface density of compact sources. Continuum emission imaged at a resolution higher than that of the current images should be able to delineate the actual continuum counterparts of the RRL sources.
5 A multi-density model for the ionised gas in NGC 253
RRL data can be used, along with the associated radio continuum measurements, to model the physical properties of the line emitting (photo-)ionised gas. The atomic level populations are derived333The departure coefficients are taken from a program by Salem & Brocklehurst (1979), modified by Walmsley & Watson (1982) and Payne, Anantharamaiah & Erickson (1994). assuming they are not in local thermodynamic equilibrium (LTE). The ionized gas is modelled either as a uniform sphere, a slab or a collection of spherical HII regions, all of constant density. Density, electron temperature, size (radius for spherical models and lateral size and thickness for slab models) and the number of HII regions (for the collection of HII regions model) are free parameters. The temperature of the photo-ionized gas in all the models is taken to be 7500 K, a value typical of galactic HII regions, since the results of the models do not depend significantly on the temperature. The values for the continuum and line flux densities are calculated for a grid of values of the free parameters and the observed flux densities are used to constrain the solution space. The range of derived values of the free parameters is determined primarily by the observational errors in the flux densities. Externally stimulated emission is also considered (in addition to internally stimulated emission, see Anantharamaiah et al. 1993) using the observed value of the continuum flux density. It is found that the derived range of the free parameters allow for substantial externally stimulated emission as well, but the values of these parameters are not affected significantly due to limits to the continuum brightness temperature. Further details of the modelling procedure have been described in Mohan et al. (2001), and references therein. In Sect. 5.1, we attempt to model the entire low-resolution multi-frequency RRL data as arising from a single component of ionised gas with uniform properties. In Sect. 5.2, we use our higher resolution observations of cm-wave RRLs to derive the properties of the individual line emitting regions, and finally, in Sect. 4.3, we propose a multi-density model for the ionised gas component in NGC 253.
5.1 Modelling the low-resolution RRL data
Puxley et al. (1997) detected the 99 GHz H40 line in NGC 253 using single-dish observations and also compiled low resolution interferometric RRL observations at 1.4 GHz, 4.8 GHz and 8.3 GHz (Anantharamaiah & Goss, 1990). They show that the RRL data from 1.4 GHz up to 99 GHz is well fit by a Fν curve (that is, the line spectral index =2) . In fact, our revised estimate of the 1.4 GHz line flux density lies much closer to the best fit line than the earlier measurement. These data are plotted in Fig. 11. A function of the form Fν is fit to the data and the best fit value of is 1.93 0.04. The theoretically expected dependence of Fν on frequency when 1, 1, assuming LTE conditions and neglecting pressure broadening, is indeed Fν , as noted by Puxley et al. (1997). They therefore suggest that all of the RRL emission from 1.4 GHz up to 99 GHz arises in LTE gas which is optically thin. This result is surprising since we do not expect either LTE conditions or optically thin conditions to hold for ionised gas over this range of frequencies.

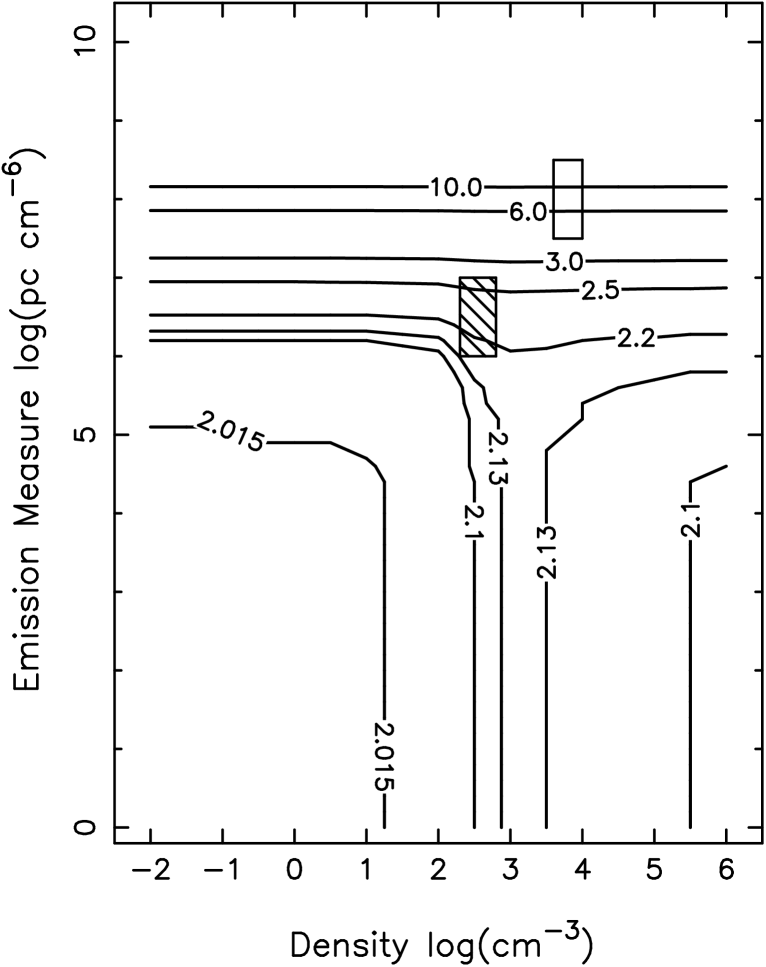
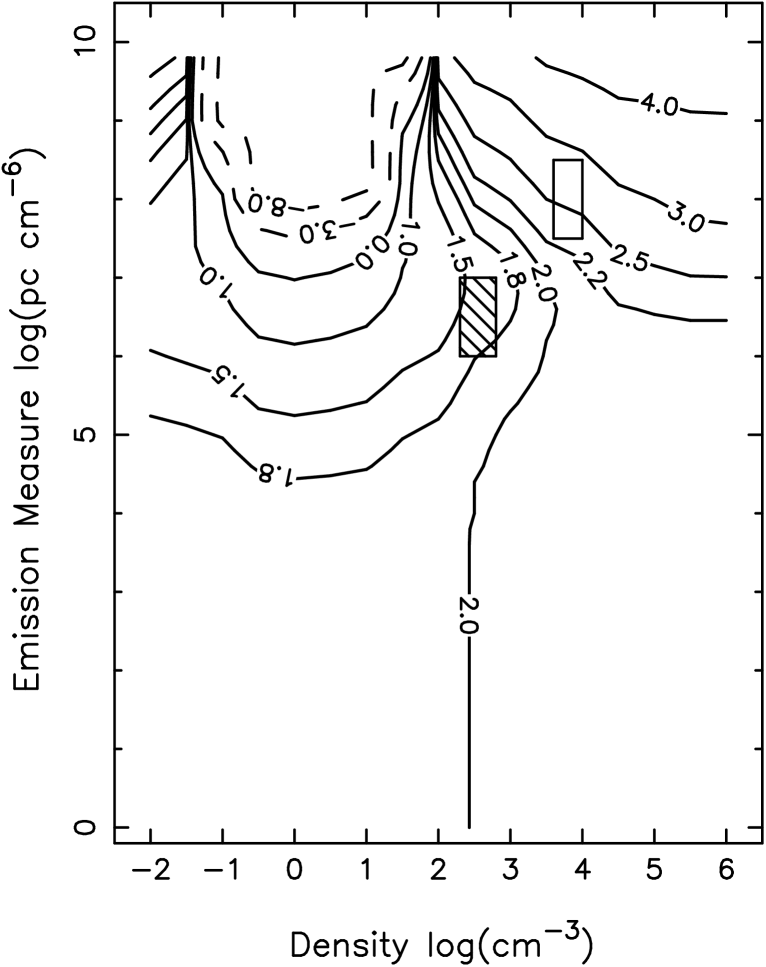
In Fig. 12 we show the theoretical contours of the spectral index between 1.4 GHz and 99 GHz as a function of electron density and emission measure EM, including pressure broadening, for LTE as well as for non-LTE conditions. In the LTE case, is quite close to 2.0 for EM106 pc cm-6 (or at 1.4 GHz 0.4) and increases for higher values of EM due to optical depth effects. The weak dependence of on density for low values of EM is due to pressure broadening. However, the behaviour of is very different for the non-LTE case. The value of is closer to 2.0 for certain high-EM regions in the density-EM plane compared to the LTE case. The ratio between the non-LTE and LTE flux densities is 1/bn (bn is the departure coefficient for level ), and is hence close to unity, only for optically thin regimes. Hence, an LTE analysis of the line emission, as performed by Puxley et al. (1997), based on the observed dependence, will not be valid if the optical depth is 0.5.
Therefore we investigate whether the observed line flux densities and the dependence of the integrated RRL flux from NGC 253 can indeed be modelled as emission arising from a single parcel of gas. The ionised gas is modelled as a rectangular slab at Te=5000 K, with the density ne, lateral extent and thickness being the free parameters. The gas is required to produce the observed integrated line flux densities at the four frequencies. The valid solutions obtained violate two observational constraints. The minimum lateral angular extent (10′′) is larger than the observed value (6′′). Additionally, the predicted thermal continuum at 99 GHz is much higher than the estimated value from the observations of Carlstrom (1990) and Peng et al. (1996). In a model where the calculated flux densities are normalised, and only the calculated line spectral index is constrained to be consistent with the observed value of =1.93 0.04, no solutions are obtained for LTE emission within 2. The acceptable non-LTE models in this case are confined to ne100 cmand EM104 with some isolated high density solutions as well. An observed spectral index of two, therefore, cannot be used to infer emission measures assuming LTE conditions.
Hence, all of the RRL emission from 1.4 GHz up to 99 GHz cannot arise in the same component of ionised gas. However, the morphology of the line emission in the H92 line images is observed to be complex and consists of individual sources, which may have different properties (for example, the line from the radio nucleus arises in gas at a density 10 times higher than derived in the above models and contributes about 10 % of the total ionisation derived; Mohan et al. 2002). Therefore each of the compact line emitting sources must be modelled separately, as is done in the following section.
5.2 Modelling the cm-wave RRLs: High density ionised gas
The physical properties of the compact H92 emitting sources can be modelled in a more realistic fashion with our high resolution data since the smaller synthesized beam size strongly constrains the projected lateral size of the ionised gas. The four extranuclear line sources and the four sources inside the central 15 pc region are modelled individually. The models are constrained to produce the observed H92 and H75 flux densities. The free-free emission at 8.3 GHz and 15 GHz is also constrained to be less than the measured continuum flux densities. Further, the angular size of the gas in these spatially unresolved sources is constrained to be 0.35′′, corresponding to the size of the synthesized beam. The observational constraints used in the modelling are summarised in Table 2 for the extranuclear sources and in Table 4 for the sources in the 15 pc region. The valid solutions obtained for the extranuclear sources are listed in Table 5 and notes on each object are given below.
| Parameter | 5.4942.3 | 5.5941.6 | 5.7240.1 | 5.7539.9 |
|---|---|---|---|---|
| Density (103 cm-3) | 4-10 | 2-20 | 2-10 | 2-10 |
| Effective size (pc) | 2-3.5a | 1-5 | 1.4-2.7 | 1.7-2.9 |
| at 8.3 GHz | 0.2-1.5 | 0.2-3 | 0.2-1.2 | 0.1-1.5 |
| Sff at 8.3 GHz (mJy) | 0.5-0.7 | 1-2.5 | 2-3 | 2-3 |
| NLyc (1051 ph. s-1) | 1 | 2 | 1-10 | 2-5 |
| Mass (103 ) | 0.16-0.36 | 0.3-1 | 0.35-1.3 | 2 |
| 4.8 GHz free-free flux density (mJy) | 0.2-0.4 | 0.7-2 | 1-4 | 1-2.5 |
| 99 GHz free-free flux density (mJy) | 0.7-0.9 | 1.3-2 | 2-3.5 | 2-4 |
| 1.4 GHz line flux ratiob (%) | 0 | 0.1 | 1 | 0.05 |
| 4.8 GHz line flux ratiob (%) | 0.2-0.8 | 0.7-1.8 | 1-4 | 1-2.5 |
| 99 GHz line flux ratiob (%) | 0.2-0.3 | 0.4-0.7 | 0.7 | 0.7 |
| a Only thin slab solutions with thickness between 0.01-0.04 pc. | ||||
| b Ratio of predicted RRL flux of the eight H92 sources to the observed value. | ||||
| Parameter | Source 1a | Source 2a | Source 3 | Source 4 | ||
|---|---|---|---|---|---|---|
| Low | High | Low | High | |||
| Density (103 cm-3) | 2 | 10 | 0.9 | 6 | 8-10 | 7-10 |
| Effective size (pc) | 5 | 1.8 | 6.4 | 2.6-3.7 | 2-2.5 | 2.5 |
| at 8.3 GHz | 0.2 | 1.7 | 0.05 | 0.8 | 1-2.5 | 1-2 |
| Sff at 8.3 GHz (mJy) | 0.4 | 0.3 | 2 | 4 | 6 | 5.5 |
| NLyc (1051 ph. s-1) | 2.5-5 | 4-5 | 1.5 | 4 | 8-15 | 6-14 |
| Mass (103 ) | 3-5 | 0.8 | 3.2 | 1.3 | 1.5-2.5 | 1.3-2 |
| 4.8 GHz free-free flux density (mJy) | 3-5 | 1.6 | 1.2 | 3-5 | 2.7 | 2.5-5 |
| 99 GHz free-free flux density (mJy) | 2.3-4.3 | 4 | 1.8 | 2-7 | 6-10 | 6-12 |
| 1.4 GHz line flux ratiob (%) | 1 | 0.05 | 19 | 0.1 | 0.05 | 0.05 |
| 4.8 GHz line flux ratiob (%) | 5 | 1.6 | 13 | 5 | 3.5 | 5 |
| 99 GHz line flux ratiob (%) | 0.8 | 1.1 | 0.3 | 1 | 2.5 | 2.5 |
| a For sources 1 and 2, the density range is large; typical low and high density solutions are listed. | ||||||
| b Ratio of predicted RRL flux of the eight H92 sources to the observed value. | ||||||
(1) 5.4942.3: No solutions are obtained for a spherical HII region
model; uniform slab models yield solutions corresponding to thin slabs. Since this source is
not listed as a H emitter by Forbes et al. (2000), the integrated H flux of 210-15 W m-2
derived from the ionisation rate implies a (foreground) extinction of AV 10.
(2) 5.5941.6 (= IR peak ?): Piña et al. (1992), Sams et al. (1994) and others
have shown that the radio nucleus and the IR peak are two separate objects, and
that astrometric errors do not allow an unambiguous association of any other radio
source with the IR peak. The closest radio sources are 5.5941.6 and 5.6241.3,
which have spectral indices of +0.61 0.15 and 0.21 0.14 respectively,
and are hence dominated by thermal gas. However, the detection of recombination lines from
5.5941.6 leads us to suggest that this is indeed the IR peak. This issue is discussed further
in Sect. 6.1.
(3) 5.7240.1: We model the line emission from this thermal object along
with the continuum constraints derived by UA97. The derived gas mass,
density, and size are similar to the UA97 values. However, only an insignificant fraction
of the continuum at 8.3 GHz is thermal, whereas the continuum spectral
index is observed to be flat at frequencies 4.8 GHz. Hence, a single-density model cannot explain the
observed flat spectral index as well as the RRL emission. Using the estimated
H strength of 1.210-14 W m-2 and identifying the source with
a H knot in Forbes et al. (2000) 0.4′′ eastwards, the (foreground)
extinction AV is estimated to be 13.
(4) 5.7539.9: The line emitting gas is modelled assuming that the
free-free flux density of the thermal gas does not exceed the measured continuum
of 5.5 mJy at 8.3 GHz. No H or IR emission knots are observed in this region (Forbes et al., 2000) and hence
the extinction AV must be 9.
The solutions obtained for the sources in the central 15 pc region are similar for a uniform sphere as well as a rectangular slab geometry, and are described in Table 6. The derived range of densities for sources 1 and 2 are wider than those for sources 3 and 4 since only upper limits to the H75 line flux density are available for the former two. The spectral indices of RRL flux density between pairs of frequencies from 1.4 GHz to 99 GHz derived from the models range between 0.5 and 5.0 which differ significantly from 2.0 (see Sect.5.1). The derived properties of the four sources (Table 6) are similar.
The gas densities of the eight compact H92 sources lie in the range 5103-104 cm-3, similar to compact HII regions in our galaxy. To illustrate the advantage of high resolution observations (which set stricter constraints on the projected size), we also model the 15 pc region as a whole. The results obtained are different compared to those derived above (lower densities, larger sizes and a dominant contribution from stimulated emission). However, the results are similar to those derived by Puxley et al. (1997) from low resolution data. Hence, high resolution observations are essential for reliably determining the properties of the compact component of ionised gas.
5.3 Modelling the decimetre-wave RRLs: multi-density medium
The sum of the observed continuum and line flux densities of the eight H92 sources, derived in Sect. 5.2, are listed in Table 7 (as Component I). This component contributes no more than 2 % (or 21 % for the low density models) of the observed H166 emission at 1.4 GHz, between 18-36 % of the H110 emission at 4.8 GHz and about 9 % of the H40 emission at 99 GHz. Therefore, in order to explain the remaining RRL emission at these frequencies, additional components of ionised gas, different from that detected in our high resolution H92 data, must exist. No plausible models can account for the remainder of the 1.4 GHz as well as the 99 GHz line emissions to arise in the same component of gas. Ionised gas at densities 104 cmis needed to account for the observed mm-RRL emission, and this gas would produce negligible line emission at 1.4 GHz due to continuum optical depth effects. Hence, a minimum of three components of ionised gas seem to be needed to explain all of the RRL data on NGC 253 : Component I which produces the high brightness part of the H92 emission, described in the previous section, Component II which explains most of the 1.4 GHz line and the remainder of the 4.8 GHz and 8.3 GHz lines, and Component III, which leads to the mm-wave line emission.
| Observational parameter | Component I | Observations | Comp.s II+III |
|---|---|---|---|
| (low res.) | (expected) | ||
| H166 at 1.4 GHz (10-23 W m-2) | 0.03-0.3 | 1.6 | 1.5 0.4 |
| H110 at 4.8 GHz (10-23 W m-2) | 3.4-6.9 | 19.1 | 14.5 4 |
| H92 at 8.3 GHz (10-23 W m-2) | 25.5 | 44.4 | 19 3 |
| H40 at 99 GHz (10-23 W m-2) | 564 | 6270 | 5706 |
| 1.4 GHz continuum (mJy) | 10 | 852 | 842 |
| 4.8 GHz continuum (mJy) | 11-27 | 1000 | 990 |
| 8.3 GHz continuum (mJy) | 25 | 800 | 775 |
| 99 GHz continuum (mJy) | 23-42 | 75 | 52 |
| Derived parameter | Component I | Component II | |
| Density (cm-3) | 104 | 300-1000 | |
| Size (pc) | 10 | 30-60 | |
| NLyc (1052s-1) | 4 | 3-6 | |
| Col (1): Parameter; col (2): predicted value of the parameter, summed over the eight compact H92 sources (Component I, see Sect. 5.2); col (3): observed value of parameter, from low resolution data; col (4): the difference between col. 3 and col. 2, which is modelled as Components II and III in Sect. 5.3. | |||
Component II is modelled to produce all of the remaining 1.4 GHz, 4.8 GHz and 8.3 GHz line emissions, with the 99 GHz line flux density imposed as an upper limit. The transverse size is constrained to be 7.5′′, the size of the low resolution emissions. The derived electron densities are between 300-1000 cm-3, effective sizes between 30-60 pc and ionising photon rate is (3-6)1052 s-1. The stimulated emission component due to the background nonthermal radiation is between 50-90 %. If the stimulated emission is set to zero, we obtain solutions for densities between 200-500 cm-3, but with very similar ionisation rates. The derived properties of the gas in Components I and II are listed in Table 7. This gas (Component II) contributes 10-12 % of the remaining 99 GHz emission. Hence a third higher density component is obviously necessary. Since the H40 line was detected by Puxley et al. (1997) at low signal to noise, we do not attempt to model this high frequency line emission in detail.
6 Discussion
Though high resolution radio continuum observations of NGC 253 exists, recombination lines provide additional advantages. The local gas density can be derived from RRLs whereas continuum data yield only the rms density, and the densities derived in this work are higher than the rms densities for some of the thermal sources. Moreover, the thermal fraction of the continuum emission is not known accurately due to the large errors in the observed continuum spectral indices. Such errors also result to difficulties in determining free-free optical depth effects, especially in the case of multiple density components inside a single source.
The continuum spectral index measurements by UA97 indicate that thermal gas is present over a substantial area and also forms a significant part of the continuum emission from a number of compact sources. Hence, it is notable that 8.3 GHz and 15 GHz line emission is detected from only a handful of sources, which may be ascribed partly to lack of adequate sensitivity. Additionally, since the observed RRLs are sensitive primarily to gas at densities 103-104 cm-3, the line emission would not be traced efficiently by high resolution observations of the H92 line emission if a substantial part of the thermal gas detected in the continuum is at very different densities. Lower density diffuse gas, for example, can give rise to cm-wave RRL emission which is below the sensitivity limit of our observations while still being able to make the observed continuum spectral index flatter, thus explaining the presence of thermal sources not detected in RRLs in our observations.
6.1 The IR peak
The IR peak dominates the NIR and MIR continuum, Br and [NeII] lines and accounts for 10 % of the total bolometric IRAS flux from NGC 253, and is hence a prominent thermal source. However, this source is not conspicuous in the radio continuum image which is understandable since the total radio continuum is predominantly non-thermal. Br data from Forbes et al. (1993) implies a free-free flux density in the radio of only 1 mJy in the for the IR peak for optically thin gas (and 2.5 mJy for AV=10); observations of Kalas & Wynn-Williams (1994) are consistent if a large MIR excess is present. However, the IR peak does not have a strong RRL counterpart, which is surprising. Much higher extinction towards the central 15 pc region than towards the IR peak could be invoked. Nevertheless, since the 12.8 m [NeII] emission is much stronger towards the IR peak than towards the centre, the required extinction towards the latter would need to be unrealistically high, unless most of the Ne in the centre is doubly ionised due to the AGN. However, low density models can be constructed which can explain the weak RRL emission along with a high star formation rate. Hence we suggest that the thermal gas in the IR peak is probably at densities lower than few 100 cmand is therefore not prominent in high frequency line observations. We predict that a high resolution observation of the H166 line using the VLA in the A configuration would show the IR peak to be a prominent line source since this line is more sensitive to low density gas and the VLA in the A configuration will be able to resolve the IR peak from the surrounding emission.
6.2 Ionisation sources of cm-RRL emitting gas
It was argued by Mohan et al. (2002) that the RRL emitting gas in the radio nucleus is ionised by a weak central AGN, for which additional evidence was presented by Weaver et al. (2002). The nature of ionisation of the remainder of H92 emission is discussed in this section.
If the individual H92 RRL sources in the 15 pc region are ionised by stars, the derived values of the ionisation rates and sizes imply the presence of a Super Star Cluster (SSC) within each (based on the typical sizes and luminosities of SSCs derived by Meurer et al. 1995). Similarly, massive clusters or SSCs would be required for the four sources outside the central region. However, the radio recombination line widths (presumably caused by the expansion of the HII regions) are supersonic, 200 km s-1 for the central sources and 70-100 km s-1 for the latter ones. Hence the dynamical age for the ionised gas is 104 years for all of the sources in the central 15 pc region and between (4-10)104 years for the extranuclear sources. These are too young to be realistic since it is improbable that star clusters much younger than 105 years would have formed enough OB stars to provide an ionisation in excess of 1051 photons s-1. The thermal gas in the four nuclear sources is not gravitationally bound to the clusters within, though gravity could play a role in the dynamics of the gas in the extranuclear sources. This “lifetime problem” is similar to the situation in NGC 5253 and He 2-10 (Mohan et al., 2001). The actual age of the objects could be increased by invoking internal mass loading whereby there is injection of mass into the ionised component from evaporation of neutral or molecular clumps. This can increase the density of gas within and maintain a constant Strömgren radius (Dyson, William & Redman, 1995; Lizano et al., 1996). There could also be a substantial contribution from an unordered or turbulent component to the observed line width, in which case the dynamical time of the ionized gas will be longer compared to an ordered outflow. However, since the central 15 pc region is also deficient in PAH and MIR emission compared to the IR peak (Keto et al., 1999), the possibility of ionisation of these HII regions solely by SSCs is not entirely satisfactory. A possible explanation for the deficiency of nuclear PAH emission is dissociation by the hard radiation from the central AGN (Keto et al., 1999).
Weaver et al. (2002) has shown that the radio nucleus is powered by a weakly accreting supermassive black hole or an intermediate mass black hole. Assuming the former, it is possible that the kinematics of the gas in the central 15 pcs is influenced by the gravitational potential of the central mass. Hence a fraction of the large observed line widths could be explained by the AGN, though the remainder would still remain supersonic. The gas could also be partially ionised by the AGN, though star clusters would have to provide all of ionisation for the extranuclear sources. There is evidence that the gas kinematics in the central region of NGC 253 is complex (see Das, Anantharamaiah & Yun 2001), and involves multiple orbits at different orientations seen at high inclination. Hence it is possible that the RRL sources in the 15 pc region may not contain individual star clusters, but could be patterns or enhancements of emission measure along the line of sight. In such a case, the stellar densities needed for ionisation can be much lower, and the line widths of individual ionized gas components can also be smaller than the observed value, averting the “lifetime problem”. However, the derived properties of the line emitting gas would remain unchanged. We predict that with increased spatial resolution, the line widths of the central RRL sources would decrease, similar to the [NeII] and RRL line widths in the Galactic Centre. In fact, due to the presence of a weak AGN, star clusters, high density ionised gas, and complex kinematics, the centre of NGC 253 is qualitatively similar to the Galactic Centre.
6.3 Multi-density model of the ionised gas
Modelling the multi-frequency high resolution RRL data on NGC 253 led to a multi-density model for the ionised gas, similar to that in Arp 220 (Anantharamaiah et al., 2000). In contrast, using the low resolution RRL data at precisely the frequencies we have modelled here, Puxley et al. (1997) could model all of the RRL emissions as arising from the same component of gas. The solution space of Components I and II in the ne-EM plane are plotted in Fig. 12. The figure for non-LTE conditions shows that the line spectral indices between 1.4 GHz and 99 GHz is not 2.0 for either component, though the spectral index of the total line emission is indeed very close to 2.0. Thus, high spatial resolution, coupled with multi-frequency data, is necessary to adequately model the compact ionised gas component.
High resolution observations of molecular gas in NGC 253 within the central few hundred parsecs (HCN: Paglione, Tosaki, Jackson 1995; CS: Peng et al. 1996) indicate that the gas density exceeds 104 cm-3. Hence Component I of ionised gas could well be produced by ionising this surrounding molecular material. Since the ionised gas becomes less dense and also larger in size with age, due to expansion of the HII regions, it is consistent to expect the more compact and denser Component I to have similar density as the molecular gas. The spectral index of the global radio continuum emission in the central 25 pc of NGC 253 is not steep (0.5; UA97, this work). From the spectral index of the continuum emission and also based on the [NeII] emission, we can conclude that free-free emission is not, however, the dominant portion of the total continuum emission. Therefore, the presence of foreground ionised gas with large covering factor (which absorbs the background non-thermal emission) is implied. Component II does satisfy these requirements, since it has a large transverse size and has sufficient optical depth at 8 GHz. However, the exact location of this component of ionised gas needs to be investigated with future VLA A configuration observations of the 1.4 GHz RRL. Though the properties of Component III have not been derived here, this component can be modelled in detail using the observations of the 45 GHz RRL and also mm-wave RRLs, which have been carried out using the VLA and IRAM respectively (Zhao, and Viallefond, private communication).
In this work, a three-component model of the ionised gas has been derived using observations of RRLs at three different frequencies. This raises the question of uniqueness of the decomposition into these specific density components. The ionised gas in NGC 253 is not expected to exist at three discrete densities; we interpret these results as an approximation to the intrinsic density distribution of the gas. This intrinsic distribution, presumably continuous, is a convolution of the three effects, namely, the initial density structure of the molecular ISM, the detailed time dependence of the star formation rate, and the dynamics of the HII regions. By observing widely spaced RRL, each of which is sensitive to a different range of densities, the properties of the ionised gas can be approximated in terms of a finite number of discrete density ranges. Further, the sizes and masses of the gas in each of these density ranges can also be predicted. Hence, we divide the ionised gas into three density bins, the exact ranges of which are decided partly by the frequencies of the observed RRLs. We can then accurately determine the length scales and masses and hence the required ionisation rates for the gas in each of these bins by modelling the line formation. Future observations of a larger number of RRLs from decimetre to millimetre may be used to constrain a more general density distribution function directly.
7 Summary and Conclusions
The 1.4 GHz line emission is detected with a resolution of 50 pc. The 8.3 GHz H92 and 15 GHz H75 line emissions have also been imaged, at high resolutions (4 pc and 2 pc respectively). The total H92 emission, which is about half the value measured at low resolution, consists of an extended region of emission surrounding the radio nucleus (the ‘15 pc region’) and four compact sources in the outer disk of NGC 253. The line emission in the 15 pc region can be decomposed into four additional compact sources. The peak of the line emission is towards the radio nucleus. The line widths of the outer sources is 100 km s-1 whereas the line widths of the sources in the inner 15 pc are about 200 km s-1. H75 emission has been detected from only two of these sources. Not all the H92 line sources have identifiable continuum counterparts.
In contrast to existing interpretations, we show that multi-wavelength RRL emission from NGC 253 does not arise in optically thin gas in LTE. The four extranuclear H92 sources as well as the four compact sources in the 15 pc region are modelled individually and arise in gas at densities close to 104 cm-3. The total ionisation and gas mass in this high density Component I are 41052 s-1 and 5000-10000 . The total size subtended by Component I is 10 pc. This component produces a negligible fraction of the 1.4 GHz line emission.
A second component of ionised gas, Component II, is required to explain all of the observed H166 line at 1.4 GHz and the remainder of the cm-wave RRL emissions. This gas is a lower density of a few 100 cm-3. The The typical transverse size is a few tens of pc. A third component of gas, whose density must be higher than 104 cm-3, is also needed to explain the observed H40 emission at 99 GHz, but has not been modelled in this work. In conclusion,
-
•
The ionised gas component in NGC 253 is decomposed into three distinct components: a low density component (500 cm-3) which contributes most of the observed thermal radio continuum emission and almost all of the 1.4 GHz RRL; a higher density component (104 cm-3) which is more localised and exhibits supersonic line widths, and a third component at an even much higher density, responsible for mm-wave RRLs.
-
•
The nature and location of the IR peak is uncertain and probably contains low density gas ionised by a star cluster which is much less obscured than the central 15 pc region.
-
•
The ionisation of the line emitting high density thermal gas in the 15 pc region is probably determined by obscured star clusters and the dynamics could be partly determined by the AGN, like the Galactic Centre. Alternatively, some of the compact line sources could be line of sight enhancements in emission measure due to complex dynamics in the region, rather than individual HII regions surrounding massive star clusters. In either case, we have discovered further examples of supernebulae with large line widths sustained by internal gas dynamical processes.
Acknowledgements.
We acknowledge the referee for several useful comments and suggestions which have improved the presentation of the paper and clarified certain issues better. We thank C. L. Carilli for the use of his 330 MHz continuum image of NGC 253. We wish to acknowledge K. S. Dwarakanath, Biman Nath, B. Ramesh, K. Johnson, A. Omar, Rekesh Mohan, Shiv Sethi, Mousumi Das and P. Manoj for useful discussions and helpful comments. The VLA is a facility of the National Radio Astronomy Observatory (NRAO), which is operated by Associated Universities, Inc. under a cooperative agreement with the National Science Foundation.Appendix A Radio continuum sources in the disk of NGC 253
The 1.4 GHz H166 observations performed using the VLA in the C configuration, described in Anantharamaiah & Goss (1990), were reanalysed. The 1.4 GHz RRL was detected, and was found to coincide with the position of the peak of the radio continuum (radio nucleus). This dataset is used to image the continuum emission from NGC 253 at a higher sensitivity and over a larger field of view than what is available in the literature. Sources within 20′ of the centre of NGC 253 which are within the spatial extent of the 330 MHz continuum emission (Carilli et al., 1992; Carilli, 1996) are identified with the galaxy. These are named as S1 to S9 and are marked in Fig. 13a. Ulvestad (2000) listed 22 circumnuclear sources within the inner 3′ (2 kpc) region. Using our C as well as BnA configuration images, we mark those of their sources which have uncertain parameters, as well as new sources, in Fig. 8b. The flux densities and positions of these continuum sources were determined using JMFIT in AIPS and the catalogue list is presented in Table 8.


| Source | Position (B1950.0) | S | Source | Comments | |
| name | (00h) | (25∘) | (mJy) | size | |
| S1 | 44m 32s.65 | 40′ 11′′.2 | 3.4 | Ua | |
| S2 | 44m 35s.95 | 26′ 52′′.6 | 10.8 | 4.0′′1.6′′ | |
| S3b | 44m 44s.57 | 34′ 06′′.0 | 19.0 | 0.5′′0.4′′ | B1 |
| S4b | 45m 17s.56 | 30′ 00′′.0 | 25.4 | B2; 3 point sources | |
| S5b | 45m 27s.50 | 28′ 53′′.0 | 1.8 | U | real feature ? |
| S6 | 45m 31s.57 | 34′ 53′′.7 | 56 | 2.4′′0.5′′ | B3 |
| S7 | 45m 34s.03 | 43′ 59′′.7 | 7.2 | 3′′1′′? | possibly resolved |
| S8 | 45m 33s.79 | 32′ 49′′.1 | 1.6 | U | |
| S9 | 45m 37s.70 | 27′ 34′′.9 | 2.8 | U | |
| 15c | 45m 06s.12 | 31′ 55′′.3 | 2.0 | 2′′2′′ | possibly resolved |
| 19c | 45m 12s.07 | 32′ 55′′.7 | 1.2 | 4.5′′2.1′′ | |
| 20c | 45m 13s.13 | 33′ 01′′.1 | 3.5 | 4.1′′3.4′′ | |
| 22c | 45m 15s.75 | 32′ 01′′.2 | 1.5 | 8.6′′5.6′′ | within diffuse em. |
| 23d | 45m 12s.91 | 31′ 23′′.9 | 0.6 | — | too weak |
| 24d | 45m 15s.69 | 31′ 51′′.2 | 0.9 | — | too weak |
| 25d | 45m 16s.80 | 32′ 13′′.9 | 0.7 | — | too weak |
| a U - unresolved, even in the BnA configuration images. | |||||
| b These are within 2-3 synthesized beams of ve extended emission in the C configuration image. | |||||
| c Sources in U00 (Ulvestad 2000) with inaccurate flux densities, positions. | |||||
| d Sources seen in BnA image but not in Ulvestad (2000). | |||||
References
- Anantharamaiah & Goss (1990) Anantharamaiah, K. R., & Goss, W. M. 1990, in IAU Colloq. 125, Radio Recombination Lines: 25 Years of Investigations, ed. M. A. Gordon & R. L. Sorochenko (Dordrecht: Kluwer), 267
- Anantharamaiah & Goss (1996) Anantharamaiah, K. R. & Goss, W. M. 1996, ApJ, 466, L13
- Anantharamaiah et al. (2000) Anantharamaiah, K. R., Viallefond, F., Mohan, N. R., Goss, W. M., & Zhao, J. -H. 2000, ApJ, 537, 613
- Anantharamaiah et al. (1993) Anantharamaiah, K. R., Zhao, J. -H., Goss, W. M., & Viallefond, F. 1993, ApJ, 419, 585
- Antonucci & Ulvestad (1988) Antonucci, R. R. J. & Ulvestad, J. S. 1988, ApJ, 330, L97
- Böker et al. (1998) Böker, T., Krabbe, A., & Storey, J. W. V. 1998, ApJ, 498, L115
- Carilli (1996) Carilli, C. L. 1996, A&A, 305, 402
- Carilli et al. (1992) Carilli, C. L., Holdaway, M. A., Ho, P. T. P., & de Pree, C. G. 1992, ApJ, 399, L59
- Carlstrom (1990) Carlstrom, J. E. 1990, in ASP Conf. Ser. 12, The Evolution of the Interstellar Medium, ed. L. Blitz, 339
- Das, Anantharamaiah & Yun (2001) Das, M., Anantharamaiah, K. R., & Yun, M. S. 2001, ApJ, 549, 896
- Dyson, William & Redman (1995) Dyson, J. E., Williams, R. J. R., & Redman, M. P. 1995, MNRAS, 277, 700
- Engelbracht et al. (1998) Engelbracht, C. W., Rieke, M. J., Rieke, G. H., Kelly, D. M., & Achtermann, J. M. 1998, ApJ, 505, 639
- Forbes et al. (2000) Forbes, D. A., Polehampton, E., Stevens, I. R., Brodie, J. P., & Ward, M. J. 2 000, MNRAS, 312, 689
- Forbes et al. (1991) Forbes, D. A., Ward, M. J., Depoy, D. L. 1991, ApJ, 380, L63
- Forbes et al. (1993) Forbes, D. A., Ward, M. J., Rotaciuc, V., Blietz, M., Genzel, R., Drapatz, S., van der Werf, P. P., Krabbe, A. 1993, ApJ, 406, L11
- Kalas & Wynn-Williams (1994) Kalas, P., & Wynn-Williams, C. G. 1994, ApJ, 434, 546
- Keto et al. (1993) Keto, E., Ball, R., Arens, J., Jernigan, G., Meixner, M., Skinner, C., & Graham, J. 1993, ApJ, 413, L23
- Keto et al. (1999) Keto, E., Hora, J. L., Fazio, G. G., Hoffmann, W., & Deutsch, L. 1999, ApJ, 518, 183
- Kotilainen et al. (1996) Kotilainen, J. K., Forbes, D. A., Moorwood, A. F. M., van der Werf, P. P., & Ward, M. J. 1996, A&A, 313, 771
- Lizano et al. (1996) Lizano, S., Canto, J., Garay, G., & Hollenbach, D. 1996, ApJ, 468, 739
- Mebold et al. (1980) Mebold, U., Shaver, P. A., Bell, M. B., & Seaquist, E. R. 1980, A&A, 82, 272
- Meurer et al. (1995) Meurer, G. R., Heckman, T. M., Leitherer, C., Kinney, A., Robert, C., & Garnett, D. R. 1995, AJ, 110, 2665
- Mohan et al. (2001) Mohan, N. R., Anantharamaiah, K. R., & Goss, W. M. 2001, ApJ, 557, 659
- Mohan et al. (2002) Mohan, N. R., Anantharamaiah, K. R., & Goss, W. M. 2002, ApJ, 574, 701
- Paglione, Tosaki, Jackson (1995) Paglione, T. A. D., Tosaki, T., & Jackson, J. M. 1995, ApJ, 454, L117
- Payne, Anantharamaiah & Erickson (1994) Payne, H. E., Anantharamaiah, K. R., & Erickson, W. C. 1994, ApJ, 430, 690
- Peng et al. (1996) Peng, R., Zhou, S., Whiteoak, J. B., Lo, K. Y., & Sutton, E. C. 1996, ApJ, 470, 821
- Piña et al. (1992) Piña, R. K., Jones, B., Puetter, R. C., & Stein, W. A. 1992, ApJ, 401, L75
- Puxley et al. (1997) Puxley, P. J., Mountain, C. M., Brand, P. W. J. L., Moore, T. J. T., Nakai, N. 1997, ApJ, 485, 143
- Salem & Brocklehurst (1979) Salem, M., & Brocklehurst, M. 1979, ApJS, 39, 633
- Sams et al. (1994) Sams, B. J. III, Genzel, R., Eckart, A., Tacconi-Garman, L., & Hofmann, R. 1994, ApJ, 430, L33
- Seaquist & Bell (1977) Seaquist, E. R. & Bell, M. B. 1977, A&A, 60, L1
- Shaver, Churchwell & Walmsley (1978) Shaver, P. A., Churchwell, E., & Walmsley, C. M. 1978, A&A, 64, 1
- Taylor et al. (1999) Taylor, G. B., Carilli, C. L., & Perley, R. A. 1999, “Synthesis Imaging in Radio Astronomy II”, Sixth NRAO/NMIMT Synthesis Imaging Summer School, ASP Conference Series, Vol. 180
- Telesco & Harper (1980) Telesco, C. M., & Harper, D. A. 1980, ApJ, 235, 392
- Turner & Ho (1985) Turner, J. L., & Ho, P. T. P. 1985, ApJ, 299, L77
- Ulvestad (2000) Ulvestad, J. S. 2000, AJ, 120, 278
- Ulvestad & Antonucci (1997) Ulvestad, J. S., & Antonucci, R. R. J. 1997, ApJ, 488, 621
- Walmsley & Watson (1982) Walmsley, C. M., & Watson, W. D. 1982, ApJ, 260, 317
- Watson et al. (1996) Watson, A. M., et al. 1996, AJ, 112, 534
- Weaver et al. (2002) Weaver, K. A., Heckman, T. M., Strickland, D. K., & Dahlem, M. 2002, ApJ, 576, L19
- Zhao et al. (2001) Zhao, J. -H., Goss, W. M., Ulvestad, J. S., & Anantharamaiah, K. R. 2001, in ASP Conf. Ser. 240, Gas and Galaxy Evolution, ed. J. E. Hibbard, M. Rupen, & J. H. v. Gorkom (San Francisco: ASP), 404