Study of the Galactic Interstellar Medium from High Resolution X-Ray Spectroscopy: X-Ray Absorption Fine Structure and Abundances of O, Mg, Si, S, and Fe
Abstract
We study the composition of the Galactic interstellar medium (ISM) toward the Galactic center region () by utilizing X-ray absorption features of three bright low-mass X-ray binaries (LMXBs), GX 13+1, GX 5–1, and GX 340+0, observed with the Chandra HETGS. We detect X-ray absorption fine structure (XAFS) of the Si K-edge, characterized by a narrow and a broad absorption feature at 1846 eV and 1865 eV, respectively. Comparison with ground experimental data indicates that most of the ISM Si exists in the form of silicates, although a composition of “pure” forsterite is ruled out. The XAFS spectra of the sulfur K-edge indicate that a significant fraction of S exists in the gas phase. From each source, we derive the column densities of Mg, S, Si, and Fe from the K-edge depth and that of O (or H) from the absorption of the continuum. The elemental abundance ratios are found to be consistent between the three targets: the mean values of O/Si, Mg/Si, S/Si, and Fe/Si are determined to be 0.550.17, 1.140.13, 1.030.12, and 0.970.31 solar, respectively (90% error in the mean value). We discuss the origins of the overabundances of the heavy metals relative to O in the Galactic ISM by comparison with the abundance pattern of the intracluster medium in clusters of galaxies. Assuming that most of the Mg and Si atoms are depleted into silicates of either the proxine or olivine family, we estimate that the number ratio of Mg to Fe in olivine is 1.2 and that 17%–43% of the total O atoms in the ISM must be contained in silicate grains.
1 Introduction
The composition of the Galactic interstellar medium (ISM) contains key information for understanding the formation and evolution of the Galaxy. In particular, the elemental abundances of heavy metals are crucial since the ISM is in the last stage of chemical evolution of the Galactic disk, reflecting the history of metal enrichment by supernovae (SNe). In addition, it is of great importance to understand the chemical compositions of dust grains and the dust-to-gas ratio in the ISM. Dust grains determine the physical properties of the ISM and dynamics of star formation. For reviews of ISM abundances and dust grains in the Galaxy, see e.g., Savage & Sembach (1996) and Draine (2003a), respectively.
Many efforts have been made to determine reference (or “cosmic”) abundances of the ISM (total of dust plus gas) by observations of stellar photospheres, such as the Sun, main sequence B-stars, and F/G stars, and H II regions, etc. However, all these measurements could have inherent problems. Usually, solar abundances, those measured from the photosphere of the Sun or from meteorites, are adopted as reference values (Anders & Grevesse, 1989), although the 4.5 Gyr old Sun may not truly represent the present ISM compositions. Since 1994 there have been discussions that the true ISM abundances are about 2/3 the solar values (Savage & Sembach, 1996; Snow & Witt, 1996), based on new measurements of averaged stellar abundances in B-stars (Gies & Lambert, 1992) and metal-rich dwarf F/G stars (Edvardsson et al., 1993) in the solar neighborhood. In B stars, it is suggested that element stratification due to diffusion is common: the measured abundances in the stellar surface do not always represent those of the ISM from which they form (Hempel & Holweger, 2003). Although metal-rich F/G stars were expected to be young enough to reflect the recent ISM composition, Edvardsson et al. (1993) found that there is a large scatter in the age-metalicity relation of F/G stars, indicating that “metal rich” stars inevitably include old populations. In fact, Sofia & Meyer (2001) calculated averaged abundances of only the young (2 Gyr) F and G disk stars from Edvardsson et al. (1993) and found that they become closer to the solar abundances. The abundances derived from collisionally excited lines in H II regions are subject to large systematic errors because of temperature fluctuations in the nebula (e.g., Mathis, 1995; Kingdon & Ferland, 1995). It should be noted that there exists abundance gradients decreasing with Galactocentric distance (e.g., summarized in Table 1 of Chiappini, Matteucci, Romano 2001), making the issue more complex.
Studies using UV absorption lines of interstellar gas by the Goddard High-Resolution Spectrograph onboard the Hubble Space Telescope indicate that a large fraction of Mg, Si, and Fe are depleted into dust grains in the Galactic disk (see Savage & Sembach, 1996). In fact, a large number of silicates are expected in the ISM in order to reproduce the extinction curve in the infrared band (Draine & Lee, 1984). The measurement of abundance patterns in dust grains can tightly constrain the chemical composition of the dust. The dust abundances can be measured only indirectly, however, by subtracting the gas-phase abundances in the ISM from the total (gas+dust) cosmic abundances. This means that the results strongly depend on the cosmic abundances assumed. Dust models claim that the infrared 9 and 18 m absorption structure of silicates, due to the transitions of the bending and stretching modes of the S-O bond, is too strong to be explained by a sub-solar abundance of Si (Snow & Witt, 1996; Mathis, 1996). Mathis (1998) found that the problem can be avoided by introducing “fluffy” dust grains, which is not supported by a recent X-ray observation of the dust-scattered halo around GX 13+1 (Smith, Edgar, Shafer, 2002), however. The missing Si (and C) problem will be significantly relaxed if the true ISM abundances are closer to solar (Sofia & Meyer, 2001). Thus it is an urgent task to establish standard abundances for understanding the properties of the ISM.
High-resolution X-ray absorption spectroscopy of bright Galactic sources provides us with a powerful technique for constraining the properties of the ISM. Unlike UV absorption lines, one can measure the metal abundances in both the gas and the dust phase from the edge depth, leading to a direct determination of the ISM abundances based on simple physics. In addition, X-ray absorption fine structure (XAFS) can be used as a diagnostic of the chemical state of an element. Analysis of XAFS, including X-ray absorption near edge structure (XANES) and extended X-ray absorption fine structure, could constrain not only the dust-to-gas ratio but also the composition of dust material. Since the launch of Chandra in particular, which carries transmission grating spectrometers, extensive studies have been made using absorption structures of the oxygen and neon K-edge using bright X-ray binaries with hydrogen column densities of several cm-2 (e.g., X 0614–091: Paerels et al. 2001; Cyg X-1: Schulz et al. 2002; Cyg X-2: Takei et al. 2002; X Persei: Cunningham et al. 2004; multiple targets: Juett, Schulz, Chakrabarty 2004), following the pioneering work with the Einstein observatory by Schattenburg & Canizares (1986). These sources are, however, not suitable for studies of heavier elements such as Mg, Si, S, and Fe, as they produce only shallow K-edge structures because of their low column densities.
In this paper, we investigate the ISM composition of Mg, Si, S, and Fe elements toward the Galactic center region by systematically analyzing the X-ray absorption features in the X-ray spectra of three persistent (neutron star) low-mass X-ray binaries (LMXBs), GX 13+1, GX 5–1, and GX 340+0, which have absorption column densities of several cm-2 (see e.g., Christian & Swank, 1997; Asai et al., 2000). The excellent energy resolution of the Chandra HETGS (Canizares et al., 2000) gives us the best opportunities to study XAFS around the Mg to S K-edge. Combined with the absorption to the continuum, we also constrain the abundance ratios not only for these elements but also for O (and hence H, with a reasonable assumption for O/H).
As the three targets are located at within and at likely distances of kpc from the Sun (see e.g., Table 4 of Homan et al., 2004, and references therein; summarized in our Table 1), we can study the averaged properties of the ISM in the Galactic disk at Galactocentric distances of 0.7–8.5 kpc. Recalling the good correlation between the location and column density of Galactic LMXBs, it is very likely that the majority of the absorption column toward these targets is attributable to the ISM, not to the circumstellar material intrinsic to the source. Furthermore, as we show below, we obtain similar abundance ratios consistently from the three targets, also supporting this idea. Thus, it is justified to assume that the contribution of circumstellar matter is negligible (this point is also discussed in § 4.2). The spectral model of the continuum from persistent LMXBs is well established to be a sum of a multi color disk (MCD) model plus a black body component (Mitsuda et al., 1984). Hence, there is little uncertainty in modeling of the interstellar absorption, which could otherwise be coupled to the unknown continuum shape. This is an advantage of using a persistent neutron-star LMXB as a background source. GX 5–1 and GX 340+0 are Z-sources, while GX 13+1 is often called a hybrid source as it shares characteristics of both a Z and an atoll source (Hasinger & van der Klis, 1989). Table 1 summarizes the mean radio flux density, band magnitude, and column density toward the source estimated from our X-ray spectral fit (see below) for each target; because of the large extinction in the visible band no optical counterparts have been identified yet.
The paper is organized as follows. § 2 describes the observations and data reduction. In § 3 we present the analysis method and results on the XAFS and abundances. Implications of our results are discussed in § 4, and the conclusion is given in § 5. The solar and “ISM” abundances referred to in this paper correspond to the values by Anders & Grevesse (1989) and by Wilms, Allen, & McCray (2000), respectively: the O, Mg, Si, S, and Fe abundances relative to H are , , , , and in solar abundances, and , , , , and in “ISM” abundances.111These solar and “ISM” abundances are available with the “abund angr” and “abund wilm” command on XSPEC (version 11.2.0), respectively.
2 Observations and Data Reduction
Table 2 summarizes the observation log of the three targets. We analyzed the data with CIAO version 3.0.1 and CALDB version 2.23 according to the standard procedures. The HETGS consists of two types of grating, the HEG (1–8 keV) and the MEG (0.5–4 keV). Only the first order events are utilized for the spectral analysis. To determine the zero-th point position in the image as accurately as possible, we calculate the mean crossing point of the zeroth order readout trace and the tracks of dispersed HEG and MEG events. The accuracy of the absolute wavelength scale can be verified by utilizing the sharp instrumental absorption feature at 1839 eV from polysilicon in the CCD gate structure. We estimate the final accuracy to be about 0.002 Å (HEG), and take this into account as the systematic error when discussing results relying on the absolute energy.
Because these targets are bright, we apply pile-up correction to the spectra with the method of Ueda et al. (2004) applied to the same HETGS data of GX 13+1. Namely, we multiply the count in each spectral bin by the correction factor, , where is the count rate of the pixel in units of counts per pixel per frame and = 7.5 is adopted222Chandra Proposer’s Observatory Guide Rev.3.0 p.206. The correction factor in the K-edge regions of interest to us is at maximum in the MEG spectra around 2.6 keV, and is found to be 10%, 20%, and 3% for GX 13+1, GX 5–1, and GX 340+0, respectively. We add a 3% systematic error in each bin of the spectrum, considering possible uncertainties in the relative effective-area calibration and in the pile-up correction. We sum up the pile-up corrected spectra and the energy responses from the and orders. The spectral analysis is performed with XSPEC version 11.2.0, with which we use the minimization technique to find the best-fit parameters and their errors.
3 Analysis and Results
3.1 Analysis Method
The goal of our analysis is (1) to derive the absorption column density of abundant elements, O, Mg, Si, S, and Fe (and hence their abundance ratios), and (2) to measure the XAFS, aiming at constraining the chemical state of the elements. Because our targets are heavily absorbed with hydrogen column densities of (2–5) cm-2 (assuming solar abundances), the column densities of Mg, Si, S, and Fe can be derived by measuring the depth of the K-edge. For elements lighter than Mg, in particular O, this can be estimated from the continuum absorption. In the low energy range, the contribution from O is the largest to the X-ray attenuation and hence can be best estimated. We can also constrain the H column density by assuming appropriate abundance ratios.
We analyze the data in a narrow band around the K-edge region of each element, 1.27–1.40 keV, 1.82–1.90 keV, 2.40–2.60 keV, and 6.90–7.30 keV (7.05–7.30 keV for GX 13+1 to avoid a strong absorption line feature) for Mg, Si, S, and Fe, respectively, by a simultaneous fit to the HEG and MEG spectra (local fit). The models used to reproduce the XAFS are described in detail in §3.2. We also analyze the HEG spectrum in a wide energy range (1–7.5 keV) to determine the continuum and absorption column density of O, taking into account the abundances of heavier elements determined above (global fit). In the local fit, we fix the continuum and absorption from the other elements at the values determined from the global fit and other local fits. Thus, these fitting processes are repeated iteratively until the spectral parameters become self-consistent. For the absorption cross-sections we refer to those given in Wilms et al. (2000), implemented in the TBvarabs model on XSPEC. This model is in some cases too simple to describe the XAFS, but is sufficient to discuss the overall continuum absorption. Because we cannot derive the abundances of other elements individually, we always fix the abundance ratios (excluding the element of interest in the case of the local fit) within each group of H-He, C-N-O, Na-Mg-Al, S-Cl-Ar-Ca, and Cr-Fe-Co-Ni at the solar values.
Because a large grain can become optically thick to X-ray absorption, the total opacity observed from the ISM is reduced from the case in which the same material is assumed to be completely gaseous. This effect is calculated in Appendix A of Wilms et al. (2000) by assuming a simplified grain model, and is incorporated in the TBvarabs model. Following Wilms et al. (2000), we take into account this effect in our analysis by assuming a Mathis et al. (1977) grain-size distribution, , in the range of m m (Draine & Lee, 1984), and a density of 1 g cm-3. We set the depletion factors = 0, 0, 1, and 0 for Mg, Si, S, and Fe, respectively, based on our results obtained below. For other elements we adopt the default values listed in Table 2 of Wilms et al. (2000). The dependence of the opacity reduction on the depletion factor is small and the uncertainties do not affect our discussion. For example, the opacity reduction factor is 5% at the Mg K-edge with (the maximum case), which is much smaller than the statistical error.
We neglect the effects from dust scattering by the ISM to obtain the column densities of Mg, Si, S, and Fe. The depth just at the absorption edge energy corresponds to that of the direct beam, which suffers from not only absorption but also scattering by the dust in the ISM. The scattering cross-section rises above the edge energy (Mitsuda et al., 1990; Draine, 2003b), increasing the apparent edge depth. Normalizing the scattering cross section calculated by Draine (2003b) by the actual intensity of the X-ray halo around GX 13+1 (Smith et al., 2002), we find that the absorption column densities could be overestimated by % for Mg, % for Si, and less for S and Fe. These are smaller than the statistical errors. The continuum shape is more significantly affected by dust scattering, although the effect is partially canceled out since we measure the sum of the direct beam and a part of the scattered halo through a complex energy response of the HETGS convolved with the spatial extent. We take this into account in the spectral model when determining the continuum and absorption column densities of O (and H). The resulting (and ) are found to be % smaller than the values obtained without scattering correction.
While determining the column densities of Mg, S, Si, and Fe from the edge depth is straightforward, the column density of O derived from the continuum absorption is inevitably coupled to that of other abundant elements, especially H, Ne, and Fe (by L electrons), that contribute to the low energy absorption as well. This means that we have to assume the abundance ratios between these elements to obtain (or ). As reasonable assumptions, we here consider the ratios of O/H and O/Ne to be within 0.5–2 solar. Takei et al. (2002) reports the O/H ratio to be 0.70 solar in the ISM toward Cyg X-2, which is at a Galactocentric distance roughly similar to that of the Sun, based on the O K-edge depth and the H column density estimated from radio and H observations. Observations of H II regions suggest abundance gradients of [O/H] of –0.06 dex kpc-1 with respect to the Galactocentric distance (Afflerbach, Churchwell, Werner, 1997). The combination of the two arguments implies that the O abundance is 2 solar at the Galactic center. The O/Ne abundance ratio is determined to be solar (toward Cyg X-2) by Takei et al. (2002) and 0.90.6 solar (toward 4U 1626–67) by Schulz et al. (2001). The O/Ne ratio may be less dependent on the Galactocentric distance than O/H as both Ne and O have similar abundance gradients with respect to H (Simpson et al., 1995; Afflerbach et al., 1997).
Thus, we examine the difference by independently changing the abundance ratios of O/H and O/Ne within 0.5–2 solar, and within the statistical error determined in the local fit. (In the case of GX 13+1, where only an upper limit of is obtained, we adopt Fe/O of 0.5 solar as the lower limit of , roughly corresponding to the case of the other two sources.) We then regard the maximum range of (or ) allowed under these uncertainties as the final systematic error. The minimum (maximum) is obtained when we assume 0.5 (2.0) solar for O/H and O/Ne and the maximum (minimum) value for . The systematic error is much larger than the statistical error obtained from each spectral fit. Similarly, we can constrain the allowed range of , although the error becomes even larger as it more strongly depends on the assumed O/H ratio.
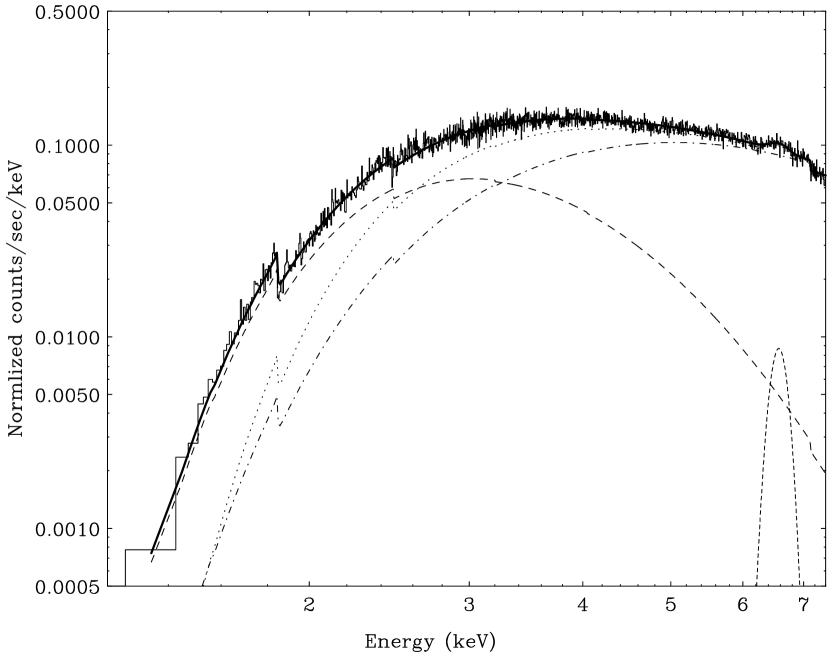
We find that for all the targets the continuum before absorption can be well described by the standard model for LMXBs, the MCD model plus a black body component (Mitsuda et al., 1984), modified with local features in some cases. In the actual fit, artificial inverse edges at 2.07 and/or 4.74 keV have been introduced, which are most likely attributable to calibration errors (see e.g., § 3.1 of Miller et al. 2004). From GX 13+1 absorption lines from highly ionized ions of Mg, Si, S, Ar, Ca, Cr, Mn, and Fe are detected together with an apparent broad emission-line feature at 6.6 keV (Ueda et al., 2004). In the spectra of GX 340+0, we detect an iron K broad emission line feature that can be modeled by a Gaussian with a width of 150 eV centered at 6.57 keV with an equivalent width of 40 eV. These features are taken into account in the fit (for the absorption lines of GX 13+1 we use the same model as described in Ueda et al. 2004). On the other hand, no statistically significant local feature is detected from the HEG spectrum of GX 5–1. Figure 1 shows the HEG first order “unfolded ”spectra (i.e., corrected for effective area) in the 1–7.5 keV band obtained by the final global fit. Here, we assume the best-fit abundances of Mg, S, Si, and Fe determined by the local fits, which are detailed in § 3.2. The contribution of each continuum component is plotted separately. The spectral parameters are summarized in Table 3 with statistical errors (90% confidence level for a single parameter), except for and for which the systematic errors estimated above are attached.
The iron K emission line detected from GX 340+0 suggests the presence of a reflection component, most probably from the accretion disk. It produces the corresponding iron K-edge feature, and hence could have an effect on the measurement of the edge depth. The line energy suggests that the reflector must be moderately ionized, with the most abundant iron ions being around Fe XXII. Because we perform a spectral fit below 7.3 keV, only the contribution of iron ions with ionization lower than Fe X (Verner & Yakovlev, 1995) is relevant. From the line profile we observe, approximately modeled by a Gaussian, the fraction of such ions among the total Fe ions responsible for the emission line is estimated to be 20%, or 8 eV in terms of the equivalent width. Using the relation between the effective solid angle of the reflector and the equivalent width of the accompanying iron-K fluorescence lines by Basko (1978), we find that the edge depth contributed by the reflection component is at most 10% of the total one we observe, which is negligible in comparison with the statistical error. We note that in some X-ray binaries a deep iron K-edge feature intrinsic to the source can appear as a result of partial covering without showing any strong emission line at 6.4 keV (e.g., Tanaka, Ueda, Boller, 2003). In such cases, however, a hardening of the continuum must be observed below the K-edge energy, which is not significantly detected in our data. Hence, we simply convert the depth of the iron K-edge into the absorption column density. In our discussion of Fe abundance, we do not refer to the result of GX 13+1, which might truly have strong broad iron K line emission producing significant iron K-edge features.
3.2 The X-Ray Absorption Fine Structure
3.2.1 Silicon
We detect significant XAFS around the silicon K-edge characterized by a narrow (absorption) peak at 1846 eV and a broad peak at 1865 eV over the simple absorption edge curve. Figure 2(a) shows the first order HEG and MEG spectra of GX 13+1 in the 1.82–1.90 keV band folded with the detector response. The instrumental absorption features of the CCD are examined in detail by Prigozhin et al. (1998) based on ground experiments. The deep edge at 1839 eV (more clearly seen in the HEG data because of its twice better resolution than the MEG) corresponds to the K-edge of silicon in metal (polysilicon), while a part of the absorption edge at 1846 eV corresponds to that of silicon dioxides, both from material used in the CCD gate. The dashed line in Figure 2(a) is the best-fit when a simple edge form, as implemented in the TBvarabs model, is employed to fit the data by excluding the energy range of 1.84–1.87 keV, in which complex excess absorption features are evident. To check if our result is subject to instrumental effects, we analyze the HETGS data of Cyg X-2 (observation ID of 1016), an LMXB with a much smaller absorption, as reference data. We confirm that the features observed here are much larger than the calibration uncertainties and must be attributed to an astrophysical origin.
We find that these features can be well explained by the XAFS of silicates. Li et al. (1995) report silicon K-edge XAFS (or XANES) spectra of many crystalline silicate minerals, including astrophysically important ones such as fayalite (Fe2SiO4), olivine ((Mg,Fe)2SiO4), forsterite (Mg2SiO4), and enstatite (MgSiO3). Their absorption spectra are characterized by several peaks assigned as A–G in their Figure 2. It is seen that at least the presence of peak C, a strong narrow peak at 1845–1847 eV, and that of the broad peak G that appears at energies of 20 eV above peak C, are common features to silicates. The central energy of peak C shows a chemical shift for different silicates; the energy of fayalite, olivine, forsterite, and enstatite is lower than that of -quartz by 0.2, 0.7, 1.3, and 0.1 eV, respectively333Here we only refer to the relative energy difference given in Li et al. (1995), considering a possible uncertainty in the absolute wavelength scale; the energy of peak C in -quartz listed in Li et al. (1995) is 1846.8 eV, which is slightly different from the value in Prigozhin et al. (1998) (1847.7 eV) that represents well the actual energy response of the HETGS.. According to Li et al. (1995) and references therein, the peaks of A, C, E, and G are attributed to transitions within the molecular orbit of the SiO cluster, while the peaks D and F are due to the multiple scattering (MS) process from atoms more distant than the nearby O atoms with respect to the central Si atom that absorbs X-rays. To compare these with our data, we have to note the fact that these ground data are measured from crystalline minerals, not amorphous ones, which are expected to be the dominant form of interstellar silicates (see e.g., Draine, 2003a). Unfortunately, we could not find experimental XAFS data in the literature for amorphous silicates other than SiO2. The major difference is that the resonant peaks due to the MS process will be smoothed out in amorphous silicates because of the lack of regularity in the atomic structure. Indeed, the comparison of the XANES spectrum between -quartz (crystalline SiO2) and amorphous SiO2 in Chaboy, Benfatto, Davoli (1995) clearly shows this effect. Nevertheless, the ground data for crystals are useful, because the results for SiO2 imply that the energy position of peak C and the presence of peak G do not differ between amorphous and crystalline silicates of the same chemicals.
Considering the fact that the basic absorption features (peak C and G) are similar among different types of silicates, we fit the observed silicon K-edge XAFS spectra, as a first approximation, with the absorption coefficients of amorphous SiO2 measured precisely in ground experiments by Prigozhin et al. (1998). The best-fit model is plotted by solid lines in Figure 2(a)-(c). As seen in this figure, our data are well reproduced by this model, yielding a significantly better fit than the simple edge model. We obtain almost the same column density of Si as in the case of the edge fit excluding the 1.84–1.87 keV range. The derived column densities are listed in Table 3 for each target. There is weak indication in the MEG data of GX 13+1 that the fit is not perfect in reproducing the shape of peak G. Such a discrepancy, if not instrumental, is not surprising as the precise shape depends on the chemical composition of the silicates (see Fig. 1 of Li et al. 1995). We do not pursue the issue in this paper, but the absorption feature of peak G could potentially be utilized to identify the silicate class once ground data for amorphous silicates become available. Finally, assuming that the chemical shift of peak C in the ISM is the same for crystalline silicates, we could constrain the composition of the ISM silicates. From the HEG data of GX 13+1, the energy shift of peak C from that of -quartz is constrained to be –1.0 eV by taking account of the systematic error in the absolute energy scale (0.6 eV). This value does not include that of forsterite (–1.3 eV), thus ruling out the case in which the ISM silicates are composed of “pure” forsterite. By fitting the data with two absorption models with different peak-C energies, we estimate that forsterite cannot exceed 88% of the total silicates in number.
3.2.2 Sulfur
Figure 3 shows the observed spectra in the S K-region for the three targets. Here we take the case of GX 340+0 (Figure 3b) as an example, which has the largest column density and thus produces the deepest S K-edge. We find that the absorption profile can be well represented by an edge structure around 2.48 keV with a narrow absorption line below the edge with an equivalent width of 2.4 eV. Applying the edge model (implemented in XSPEC) plus a negative Gaussian to the HEG data of GX 340+0, we determine the energies to be 2474–2490 eV (edge) and 2469.40.7 eV with a 1 width of 1.0 eV (absorption line). Here the uncertainty in the edge energy contains the systematic error caused by the possible presence of additional absorption features from FeS as described below. Consistent results are obtained from the other sources. Since the above edge energy includes the value adopted in the TBvarabs model (2477 eV, a theoretical value of free S atoms taken from Verner & Yakovlev 1995), we measure the edge depth by fitting the MEG and HEG spectra of each target with the TBvarabs model to derive the column density of S. A negative Gaussian is also included in the fit but its parameters are not used to constrain the column density because the identification of the line and the velocity dispersion are essentially uncertain. The best-fit models are plotted in Figure 3, and the parameters are listed in Table 3.
These absorption features indicate that a significant fraction of S exists in the gas phase. In the absorption spectrum from free atoms we should see at least a K resonance line (, where is the principal quantum number in the atomic structure) and an edge-like structure where the transition to higher energy levels become unresolved and are smoothly connected to the transition to the free continuum (Friedrich, 1991). This picture is consistent with our observation. Indeed, the observed absorption line energy (2469.40.7 eV) matches with a theoretical estimate of the K resonance line energy of S II, 2467–2470 eV, which is simply calculated as the difference between the K and M2/M3 shell ionization potentials (Indelicato et al., 1998). Because of the limited statistics and the lack of experimental data of “gaseous” sulfur, however, it is not trivial to uniquely identify the observed features. Table 4 lists experimental and theoretical K-edge energies of the S atoms in the gas phase (not in solids) taken from the literature. The experimental value compiled by Sevier (1979) is originally based on the measurement of solid-state elemental S with a correction for the work function. As noted, theoretical values have variation of several eV between different methods. According to the calculation by Gould & Jung (1991) and Jung & Gould (1991), the edge energy of S II is higher by 10 eV than that of S I. Assuming the edge energy of S I to be 2477 eV (experimental), we thus infer that the observed edge energy (2474–2490 eV) is consistent with that of S II within the errors.
The observed spectra are inconsistent with the XAFS data expected from a pure composition of solid iron sulfides (FeS). FeS shows not only an absorption peak at 2470 eV, but also a broader absorption peak around 2478 eV with a comparable strength (Sugiura, 1981), which is not evident in our data. Furthermore, the 2470 eV absorption peak expected from FeS is much weaker relative to the edge depth. Thus, we can rule out the case in which nearly all of sulfur is in the form of iron sulfides in the ISM. However, its partial contribution to the total column density is still possible if we can attribute the 2469 eV absorption line mostly to the gas-phase sulfur. In fact, by applying a composite model consisting of a negative Gaussian, an edge, and an XAFS profile of FeS modeled from the data of Sugiura (1981) with independent normalizations to our spectra, we find that the contribution of FeS can be comparable to that of gaseous sulfur. Similar statements also hold true for solid sulfur. The XAFS of solid sulfur shows a strong absorption peak at 2472 eV (e.g., Filipponi et al., 1993), which is significantly higher than 2469.40.7 eV, and hence cannot account for the whole XAFS observed here. Its partial contribution cannot be ruled out, however. We discuss the interpretation of these results in § 4.4.
3.2.3 Magnesium
For the Mg K-edge, we fit the spectra with the edge model. To avoid systematic effects by possible excess absorption features above the edge energy, similar to the case of Si, we exclude the range of 1.305–1.330 keV in the fit. The resulting edge depth is then converted to the column density of Mg by using the photo-absorption cross section by Wilms et al. (2000). Figure 4 show the spectra and the best-fit models (only the MEG spectrum can be analyzed for GX 340+0 because of the poor photon statistics in this energy band for the HEG.). The edge energy is consistently determined to be 13072 eV for both GX 13+1 and GX 5–1. Accordingly, we fix the edge at 1307 eV for GX 340+0. This value is lower than that of the Mg I atom obtained both experimentally (1311 eV) and theoretically (1311–1314 eV; see Table 4). Furthermore, a close look at the GX 5–1 data suggests the presence of excess absorption features in the region of 1310–1325 eV. The experimental data of the magnesium K-edge XAFS of enstatite show complex, broad absorption features at 1310–1325 eV starting from energies somewhat lower than 1310 eV (Cabaret et al., 1998), which is consistent with our observation. This implies that these XAFS are indeed attributable to magnesium silicates, although we cannot rule out the possibility that the spectrum may be (partially) contaminated by an unresolved, narrow K absorption line from Mg free atoms or ions.
3.2.4 Iron
The column density of Fe is determined by measuring the edge depth of cold iron at 7.1 keV. We fit the HEG spectra in the 6.9–7.3 keV band using the TBvarabs model. Partially because of the limited photon statistics and energy resolution of the HETGS data in the Fe K-band, this model gives acceptable fits in all cases (Figure 5). It is not practical to discuss the chemical composition of Fe in detail; we leave this issue for future studies by the Astro-E2 mission. For GX 13+1, we do not use the energy band below 7.05 keV to exclude the complex, intrinsic absorption-line feature from Fe XXVI ions. Only an upper limit on is obtained for GX 13+1; we fixed the abundance ratio between Fe and S at the ISM value when determining the continuum (§ 3.1).
4 Discussion
4.1 Summary of the Results
To summarize, from the XAFS data analyzed, we find the following implications for the composition of the ISM. Si exists almost completely in silicates, where the fraction of forsterite cannot exceed 88%. In contrast, a significant fraction of S exists in the gas phase probably as S II and similar ionization stages, although a partial contribution from FeS or solid S cannot be ruled out. Mg is likely to be in the form of magnesium silicates. All these arguments agree with the previous studies of the ISM in the Galactic disk; Si and Mg are mostly depleted into dust grains, while S is not (Savage & Sembach 1996; for S see also § 4.4). These XAFS are consistently seen in the previously published data of other sources, including GRS 1915+105 as reported by Lee et al. (2002).
Our results yield a new measurement of ISM abundances in the Galactic disk toward the Galactocentric direction (). We calculate the number ratios of H/Si, O/Si, Mg/Si, S/Si, Fe/Si, and Mg/O atoms for each source, considering both the statistical and systematic errors. Although is subject to large errors because of coupling with , it is still useful as a first order estimate. The resulting values relative to the solar abundance ratios are listed in Table 5. These values can be regarded as independent of one another except for the ratio between O and Fe, whose abundances are strongly coupled via continuum absorption. (Strictly speaking, there are similar couplings for the O/Mg and the O/Si ratios as well, but the effect is negligibly small compared with the systematic error in ). As noted, the results for the three (or two) targets are consistent with each other, supporting our assumption that they should reflect the mean characteristics of the ISM between the solar system and the Galactic center. We therefore calculate mean values from the three targets to be used in the following discussion. In the calculation we exclude the result of GX 340+0 for Mg and GX 13+1 for Fe, which are not well constrained. Consequently, we determine the number ratios of H/Si, O/Si, Mg/Si, S/Si, Fe/Si, and Mg/O to be 15,00011000 (0.550.39 solar), 13.33.9 (0.550.17 solar), 1.220.14 (1.140.13 solar), 0.470.06 (1.030.12 solar), 1.280.41 (0.970.31 solar), and 0.1000.046 (2.21.1 solar), respectively.
4.2 Origin of the Abundance Pattern
We detect significant overabundance of Mg, Si, S, and (possibly) Fe relative to O, while the abundance ratios between Mg, Si, S, and Fe are roughly consistent with the solar abundances. To demonstrate the overabundance visually, we plot in Figure 1 the model spectra (dotted line) expected when the O/Si abundance ratio is assumed to be 1 solar with the other spectral parameters unchanged. A similar trend for the high Mg/O or Si/O ratio (2 solar) is noticed in the absorption spectra of Cyg X-1 (Schulz et al., 2002) and 4U 1626–67 (Schulz et al., 2001), in which the O K-edge is detected but the column densities of heavier elements have large statistical errors because of their small values ( cm-2). If we assume that the solar abundances reflect the true abundances of the ISM around the solar system, then our result suggests that heavy metals (Mg and above) have larger abundance gradients than O toward the Galactic center.
We note that the extreme over-abundances of Si and Fe (but not Mg and S) reported by Lee et al. (2002) from an observation of GRS 1915+105 are apparently inconsistent with our results. This is a little puzzling, but may be explained if the results are attributed to the Si and Fe rich circumstellar gas around GRS 1915+105 as the authors suggest in that paper. As discussed in Takei et al. (2002), however, generally the existence of cold atoms in circumstellar gas is unlikely from the argument of the ionization parameter, (Tarter et al., 1969), where , , and are the luminosity, the density of the gas, and the distance from the X-ray source, respectively: combined with the column density cm-2, the distance becomes unreasonably large ( cm) compared with the binary size (typically cm), for the gas not to be ionized by strong X-radiation (e.g., 10 for erg s-1). This can be reconciled only when the gas has an extremely small filling factor (e.g., when it exists as blobs). In any case, we infer that the case of GRS 1915+105 is exceptional and do not include the result in our discussion. Obviously, we need more examples of Galactic binaries with similar absorptions to make more reliable arguments on the contribution from circumstellar matter.
The observed metal abundance pattern is consistent with that of “very” metal rich stars (those with [Fe/H] 0.3–0.5) in the Galactic disk. According to Feltzing & Gustafsson (1998), the [O/Fe] ratio decreases with [Fe/H], while [Mg/Fe] and [Si/Fe] are roughly constant at the range of [Fe/H] . The consistency is reasonable because the abundances of very metal rich stars are likely to reflect those in the recent stage of the ISM, although, as mentioned in § 1, the large scatter in the age-metal relation (Edvardsson et al., 1993) would make the interpretation nontrivial.
It is very interesting that the intracluster medium (ICM) in the central part of clusters (or groups) of galaxies also show similar abundance patterns, O/Si 0.5 solar, Fe/Si 1 solar, and Mg/O 1.3–2.0 solar (Matsushita, Finoguenov, Böhringer 2003; Buote et al. 2003; Tamura et al. 2004). In the ICM of these systems, the abundance of Si and Fe are more concentrated toward the cluster center than that of O. Matsushita et al. (2003) interpret these facts through an explanation in which the contribution of SNe Ia becomes more important toward the cluster center and a similar amount of Si is produced by SNe Ia along with Fe (O can only be produced by SNe II, which happens in the early phase of galaxy formation.). The luminosities of SNe Ia (i.e., the total amount of 56Ni, which eventually decays to Fe) decreases with the age of the stellar system (Ivanov, Hamuy, Pinto, 2000). Hence, SNe Ia in very old stellar systems, such as cD galaxies or elliptical galaxies in the cluster (or group) center, are expected to produce metals with a large Si/Fe ratio.
Since the stellar system in the Galactic bulge is also an old system, the observed abundance pattern between O, Si, and Fe may be explained with a similar scenario i.e., significant contribution by SNe Ia that produce a high Si/Fe abundance ratio superposed on that by SNe II responsible for the production of O and Mg. In this case, however, the observed high Mg/Si ratio (1.140.13 solar) may invoke another problem because Mg, unlike Si, cannot be produced by SNe Ia. The observed Mg/O ratio (2.21.1 solar; most of the error arises from the uncertainty in the O abundance, the best fit corresponding to the case of O/H = 1 solar) must reflect a pure contribution from SNe II. It seems larger than a typical predicted value (Mg/O 1 solar) by theoretical models (e.g., Nomoto et al., 1997), although the elemental abundances in the ejecta of SNe II depend on the amount of metal of the progenitor (Woosley & Weaver, 1995). The contradiction is eased if we adopt a higher O abundance (hence lower H/O, Mg/O and Si/O ratios) within the uncertainty. Thus, to separate the contribution of SNe Ia and SNe II in the Galactic ISM, a more precise determination of the O abundance relative to heavier elements is important.
4.3 Chemical Compositions of Silicates
Our results of the abundance ratios between Mg, Si, and Fe, can constrain the chemical compositions of silicates in the Galactic ISM. In the following discussion, we make the basic assumption that 100% of the Si and Mg atoms in the ISM are depleted into silicates. Furthermore, we consider only two classes of silicates, the proxine group, with the chemical formula MgxFe(1-x)SiO3 (; and 1 corresponds to ferrosilite and enstatite, respectively), and the olivine family, Mg2yFe2(1-y)SiO4 (; and 1 corresponds to fayalite and forsterite, respectively). These are thought to be the dominant classes of interstellar silicates (see e.g., Savage & Sembach, 1996). Introducing the parameter (), the fraction of the proxine group in the total silicates, [i.e., () for the olivine group], we have the relations
| (1) |
| (2) |
where and are the number ratio of Mg and Fe to Si atoms contained in all the silicates, respectively. From the basic assumption, , while we have only an upper limit of , since the true fraction of Fe atoms in silicates is unknown. Using the value of in equation (1), we see that the allowed ranges of and are and with a tight anti-correlation between the two. Equation (2) gives a strict limit of (i.e., the number ratio of forsterite to fayalite is 1.17; the equality holds when ), indicating that the olivine family is Mg-rich. Combined with the observed number ratio of the total O atoms to the Si atoms in the ISM (O/Si=13.33.9), we can constrain the number fraction of O atoms contained in silicates to the total O as 0.17–0.43 within the range of 0–1.
To proceed further, we hereafter assume a likely value of by referring to the recent result on the composition of silicates in the ISM obtained with the Infrared Space Observatory by Kemper, Vriend, Tielens (2004). Based on infrared spectroscopy in the 8–13 m wavelength range they estimate the fractions of the proxine and olivine groups to be 15.1% and 84.9% by mass, respectively. This ratio corresponds to by assuming and . Then, from equation (1), we obtain and therefore, the fraction of Fe atoms contained in silicates compared to the total Fe is constrained as . Similarly, for , where the uncertainty comes only from that in the O/Si abundance ratio. This value is consistent with the result that the compound fraction of O is about 1/3 (49% at maximum) from the analysis of O absorption edges in the spectrum of Cyg X-2 (Takei et al., 2002). Hence, the maximum number fraction of O in the form of compounds other than silicates (such as iron oxides) is estimated to be . Finally, equation (2) with indicates the allowed range of to be 0.55–0.85, weakly depending on , which can take any value from 0 to 1. Note that the constraint on does not conflict with the argument that the forsterite cannot exceed 88% of the total silicates from the analysis of silicon K-edge XAFS (§ 3.2.1), which corresponds to the condition .
4.4 Sulfur Composition in the ISM
In the diffuse ISM regions, sulfur is essentially undepleted from the gas phase; its dominant form in H I regions is S II (Savage & Sembach, 1996). The situation is quite different in cold molecular clouds (with a density of – cm-3), where sulfur is highly depleted, presumably onto dust grains (e.g., Joseph et al., 1986; Miller & Herbst, 1990; Caselli, Hasegawa, Herbst, 1994). The chemical forms of S in the grains are uncertain, however, as well as the physical processes of how they form in dense environments but are destroyed in the diffuse ISM (see Ruffle et al. 1999 for a model). Possible candidates for the “missing” sulfur include solid sulfur (S8) and FeS; major S-bearing molecules such as H2S and SO2 in grain mantles cannot account for the cosmic S abundance (e.g., Palumbo, Geballe, Tielens, 1997). Keller et al. (2002) reported the detection of FeS grains in the protoplanetary disks around young stellar objects. This discovery is also interesting in relation to the hypothesis proposed by Bradley (1994) that GEMS (glass with embedded metal and sulfides) grains, silicates infested with FeS inclusions, found in cometary interplanetary dust particles, are primitive interstellar grains.
Even though we have determined the abundance ratio of S/Si to be 1.030.12 solar, the S abundance relative to H has a large uncertainty, solar. With the consideration of the abundance gradient in the Galaxy, our measurement of total (dust+gas) sulfur abundance does not require modification of previous results on the depletion of sulfur derived by assuming the solar abundance as the reference. From the sulfur K-edge XAFS spectra we find that a significant fraction of S must be contained in the gas phase, although a partial contribution of other forms such as FeS and solid S cannot be ruled out; to separate the contribution from different compositions, reliable atomic data (particularly experimental data) on the absorption spectra of sulfur “gas” will be helpful. We here recall that our results reflect the averaged properties of the ISM along the lines of sight weighted by column density from different ISM structures at Galactocentric distances of 0.7–8.5 kpc (§ 1). According to Table 21.2 of Cox (2000), the contribution to the total column density from molecular clouds ( cm-3) is roughly comparable to that from H I/H II regions at these distances (see also Dame et al. 2001 for the comparison between the H I map and predicted CO map derived from far-infrared observations). In the diffuse H I/H II regions, sulfur is mainly in S II and higher ionization stages, which can account for the gas-phase sulfur we detected. The remainder must be contributed from the molecular clouds. Although it is difficult to uniquely identify the dominant chemical forms of S in these dense environments because of the limited data quality and uncertainties in the atomic data, our results are consistent with the picture that they are iron sulfides and/or solid sulfur in dust grains.
5 Conclusion
We have systematically analyzed high resolution X-ray absorption spectra of three Galactic bright sources to determine the properties of the ISM toward the direction of the Galactic center within . The conclusions are summarized as follows.
1. The silicon K-edge XAFS is characterized by a narrow absorption feature at 1846 eV and a broad one around 1865 eV. Comparison with ground experimental data indicates that most of the ISM Si exists as silicates. The energy of the narrow absorption line rules out a composition of “pure” forsterite.
2. The sulfur K-edge XAFS consists of an edge feature at 2474–2490 eV and a narrow absorption line at 2469.40.7 eV, indicating that a significant fraction of S exists in the gas phase. A partial contribution from iron sulfides and/or solid sulfur is possible, however, which may be the dominant form of S trapped onto dust grains in molecular clouds.
3. The Mg K-edge is detected at 13072 eV, possibly with complex, broad absorption features in the 1310–1325 eV range. These features are consistent with that expected from magnesium silicates, implying that Mg atoms in the ISM are mainly contained in silicates.
4. From the K-edge depth of each element and the continuum absorption, we have determined the O/Si, Mg/Si, S/Si, and Fe/Si abundance ratio to be 0.550.17, 1.140.13, 1.030.12, and 0.970.31 solar, respectively. Similar metal abundance patterns are observed in very metal rich stars with [Fe/H] 0.3–0.5 in the Galaxy and also from the ICM in the central part of clusters (or groups) of galaxies. Considering the fact that the Galactic bulge is an old system similar to cD galaxies, we infer that our result may be explained by a significant contribution from SNe Ia that produce a high Si/Fe abundance ratio superposed on that from SNe II responsible for the production of O and Mg.
5. Assuming that most of the Mg and Si atoms are depleted into silicates of either the proxine or olivine family, we estimate that the number ratio of Mg to Fe in olivine is 1.2, and that 17–43% of total O atoms in the ISM must be contained in silicate grains.
References
- Afflerbach et al. (1997) Afflerbach, A., Churchwell, E., & Werner, M.W. 1997, ApJ, 478, 190
- Anders & Grevesse (1989) Anders, E. & Grevesse, N. 1989, Geochimica et Cosmochimica Acta, 53, 197
- Asai et al. (2000) Asai, K., Dotani, T. Nagase, F., Mitsuda, K. 2000, ApJS, 131, 571
- Basko (1978) Basko, M.M. 1978, ApJ, 223, 268
- Bradley (1994) Bradley, J. P. 1994, Science, 265, 925
- Buote et al. (2003) Buote, D., et al. 2003, ApJ, 595, 151
- Cabaret et al. (1998) Cabaret, D., Sainctavit, P., Ildefonse, P., Flank, A. 1998, American Mineralogist, 83. 300
- Canizares et al. (2000) Canizares, C.R. et al. 2000, ApJ, 539, L41
- Caselli et al. (1994) Caselli, P., Hasegawa, T.I., & Herbst, E. 1994, ApJ, 421, 206
- Chaboy et al. (1995) Chaboy, J., Benfatto, M., Davoli, I. 1995, Phy. Rev. B, 52(14), 10014
- Christian & Swank (1997) Christian, D.J. & Swank, J.H. 1997, ApJS, 109, 177
- Chiappini et al. (2001) Chiappini, C., Matteucci, F., & Romano, D. 2001, ApJ, 554, 1044
- Cox (2000) Cox, A. N. 2000, “Allen’s Astrophysical Quantities” (Fourth Edition), § 21.1.3, Springer-Verlag
- Cunningham et al. (2004) Cunningham, N.J., McCray, R., & Snow, T.P. 2004, ApJ, 611, 353
- Dame et al. (2001) Dame, T. M., Hartmann, D., & Thaddeus, P., 2001, ApJ, 547, 792
- Draine (2003a) Draine, B.T. 2003a, ARA&A, 41, 241
- Draine (2003b) Draine, B.T. 2003b, ApJ, 598, 1026
- Draine & Lee (1984) Draine, B.T. & Lee, H.M. 1984, ApJ, 285, 89
- Edvardsson et al. (1993) Edvardsson, B., et al. 1993, A&A, 275, 10
- Feltzing & Gustafsson (1998) Feltzing, S. & Gustafsson, B. 1998, A&AS, 129, 237
- Filipponi et al. (1993) Fillipponi, A., Tyson, T. A., Hodgson, K. O., Mobilio, S. 1993, Phys. Rev. A., 48, 1328
- Friedrich (1991) Friedrich, H. et al. 1991, “Theoretical Atomic Physics”, § 3.1, Springer-Verlag
- Gies & Lambert (1992) Gies, D.R., & Lambert, D. L. 1992, ApJ, 387, 673
- Gould & Jung (1991) Gould, R.J. & Jung, Y. 1991, ApJ 373, 271
- Hasinger & van der Klis (1989) Hasinger, G., & van der Klis, M. 1989, A&A, 225, 79
- Hempel & Holweger (2003) Hempel, M. & Holweger, H. 2003, A&A, 408, 1065
- Homan et al. (2004) Homan, J. et al. 2004, A&A, 418, 255
- Huang et al. (1976) Huang, K. et al. 1976, Atomic Data and Nuclear Data Tables, 18, 243
- Indelicato et al. (1998) Indelicato, P., Boucard, S., & Lindroth, E., 1998, Eur. Phys. J., D 3, 29
- Ivanov et al. (2000) Ivanov, V., Hamuy, M., Pinto, P.A. 2000, ApJ, 542, 588
- Jonker et al. (2000) Jonker, P.G., Fender, R.P., Hambly, N.C., van der Klis, M. 2000, MNRAS, 315, L57
- Joseph et al. (1986) Joseph, C.L., Snow, T.P., Seab, C.G., Crutcher, R.M. 1986, ApJ, 309, 771
- Juett et al. (2004) Juett, A.M., Schulz, N.S., Chacrabarty, D. 2004, ApJ, 612, 308
- Jung & Gould (1991) Jung, Y. & Gould, R.J. 1991, Phys. Rev. A, 44(1), 111
- Keller et al. (2002) Keller, L.P., et al. 2002, Nature, 417, 148
- Kemper et al. (2004) Kemper, F., Vriend, W.J., Tielens, A.G.G.M. 2004, ApJ, 609, 826
- Kingdon & Ferland (1995) Kingdon, J. B. & Ferland, G. J. 1995, ApJ, 450, 691
- Lee et al. (2002) Lee, J.C., Reynolds, C.S., Remillard, R., Schulz, N.S., Blackman, E.G., Fabian, A.C. 2002, ApJ, 567, 1102
- Li et al. (1995) Li, D., Bancroft, G.M., Fleet, M.E., Feng, X.H. 1995, Phys. Chem. Minerals 22, 115
- Mathis et al. (1977) Mathis, J.S., Rumple, W., & Nordsieck, K.H. 1977, ApJ, 217, 425
- Mathis (1995) Mathis, J. S., 1995, Rev. Mex. Astron. Astrophys. Serie de conf. 3, 207
- Mathis (1996) Mathis, J. S. 1996, ApJ, 472, 643
- Mathis (1998) Mathis, J. S. 1998, ApJ, 497, 824
- Matsushita et al. (2003) Matsushita, K., Finoguenov, A., & Böhringer, H. 2003, A&A, 401, 443
- Miller et al. (2004) Miller, J.M. et al. 2004, ApJ, 601, 450
- Miller & Herbst (1990) Miller, T.J. & Herbst, E. 1990, A&A, 231, 466
- Mitsuda et al. (1984) Mitsuda, K., et al. 1984, PASJ, 36, 741
- Mitsuda et al. (1990) Mitsuda, K., et al. 1990, ApJ, 353, 480
- Nomoto et al. (1997) Nomoto, K. et al. 1997, Nuclear Physics A, 616, 79
- Schattenburg & Canizares (1986) Schattenburg, M.L.& Canizares, C.R. 1986, ApJ, 301, 759
- Simpson et al. (1995) Simpson, J.P., et al. 1995, ApJ, 444, 721
- Palumbo et al. (1997) Palumbo, M.E., Geballe, T.R., Tielens, A.G.G. 1997, ApJ, 479, 839
- Paerels et al. (2001) Paerels, F. et al. 2001, ApJ, 546, 338
- Prigozhin et al. (1998) Prigozhin, et al. 1998, Opt. Eng., 37(10), 2848
- Ruffle et al. (1999) Ruffle, D. P., Hartquist, T. W., Caselli, P., Williams, D. A. 1999, MNRAS, 306, 691
- Tanaka et al. (2003) Tanaka, Y., Ueda, Y., & Boller, T. 2003, MNRAS, 338, L1
- Savage & Sembach (1996) Savage, B.D. & Sembach, K.R. 1996, ARA&A, 34, 279
- Sevier (1979) Sevier, K.D. 1979, Atomic Data and Nuclear Data Tables, 24, 323
- Smith et al. (2002) Smith, R.K., Edgar, R.J., Shafer, R.A. 2002, ApJ, 581, 562
- Snow & Witt (1996) Snow, T.P. & Witt, A.N. 1996, ApJ, 468, L65
- Sofia & Meyer (2001) Sofia, U.J. & Meyer, D.M. 2001, ApJ, 554, L221; 2001 ApJ 558, L147 (Erratum)
- Sugiura (1981) Sugiura, C., 1981, J. Chem. Phys., 74, 215
- Schulz et al. (2001) Schulz, N.S. et al. 2001, ApJ, 563, 941
- Schulz et al. (2002) Schulz, N.S. et al. 2002, ApJ, 565, 1141
- Takei et al. (2002) Takei, Y., et al. 2002, ApJ, 581, 307
- Tamura et al. (2004) Tamura, T., et al. 2004, A&A, 420, 135
- Tarter et al. (1969) Tarter C.B., Tucker W., Salpeter E.E. 1969, ApJ, 156, 943
- Ueda et al. (2004) Ueda, Y., Murakami, H., Yamaoka, K., Dotani, T., Ebisawa, K. 2004, ApJ, 609, 325
- Verner & Yakovlev (1995) Verner, D.A. & Yakovlev, D.G. 1995, A&AS109, 125
- Wilms et al. (2000) Wilms, J, Allen, A., McCray, R. 2000, ApJ, 542, 914
- Woosley & Weaver (1995) Woosley, S.E. & Weaver, T.A. 1995, ApJS, 101, 181


| Target | RadioaaThe mean cm radio flux density taken from Table 4 of Homan et al. (2004). | BandbbTaken from Table 4 of Jonker et al. (2000). | ccThe hydrogen column density derived from the X-ray spectral fit by assuming solar abundance ratios between H, He, C, N, O, and Ne (this work; see Table 3). | DistancebbTaken from Table 4 of Jonker et al. (2000). |
|---|---|---|---|---|
| (mJy) | (mag) | ( cm-2) | (kpc) | |
| GX 13+1 | 1.80.3 | 12 | 2.1 | 7 |
| GX 5–1 | 1.30.3 | 13.7 | 2.8 | 9.22.7 |
| GX 340+0 | 0.6 | 17.3 | 4.8 | 11.03.3 |
| Target | Obs. ID | Start Time (UT) | End Time | Exposure |
|---|---|---|---|---|
| GX 13+1 | 2708 | 2002/10/08 11:27 | 19:54 | 29.4 ksec |
| GX 5–1 | 716 | 2000/07/18 06:49 | 09:45 | 8.9 ksec |
| GX 340+0 | 1921 | 2001/08/09 05:53 | 12:34 | 23.3 ksec |
| GX 13+1 | GX 5–1 | GX 340+0 | |
|---|---|---|---|
| Column Densities ( cm-2) | |||
| H | 21000 | 28000 | 48000 |
| O | 18 | 24 | 40 |
| Mg | 1.81 | 2.37 | 3.5 |
| Si | 1.57 | 1.83 | 2.87 |
| S | 1.02 | 0.89 | 1.25 |
| Fe | 1.3() | 2.6 | 3.5 |
| Continuum ParametersaaThe parameters are obtained from the HEG first-order spectrum at the best-fit column densities for the above elements assuming solar abundance ratios within each group of H-He-C-N-O-Ne, Na-Mg-Al, S-Cl-Ar-Ca, and Cr-Fe-Co-Ni. Dust scattering is taken into account based on the Draine (2003b) cross section. Local spectral features (emission and absorption lines) are included in the fit (see text). The values and are the innermost temperature of the MCD model and the temperature of the blackbody component in keV, with the extinction (absorption+scattering) corrected 1–10 keV fluxes and in units of ergs cm-2 s-1, respectively. | |||
| 1.410.04 | 1.040.05 | 0.850.07 | |
| 11 | 27 | 5.2 | |
| 2.6 (fixed) | 2.000.07 | 1.910.05 | |
| 2.2 | 16 | 7.8 | |
Note. — The errors are 90% confidence statistical errors except for the H and O column densities, for which systematic errors caused by the assumption of abundance ratios are considered (see text).
| Mg | Si | S | Reference |
|---|---|---|---|
| (eV) | (eV) | (eV) | |
| 1311 | 1846 | 2477 | 1 (E) |
| 1310.6 | 1848.6 | 2479.9 | 2 (T) |
| 1311 | 1846 | 2477 | 3 (T) |
| 1312.3 | 1850.3 | 2481.7 | 4 (T) |
| 1313.8 | 1853.0 | 2485.5 | 5 (T) |
| 1322.3(+) | 1862.2(+) | 2796.2(+) | 6 (T) |
Note. — The value with (+) is that for a singly ionized ions (Mg II, Si II, and S II).
| GX 13+1 | GX 5–1 | GX 340+0 | AverageaaGiven in 3 different units: relative to the solar abundance (Anders & Grevesse, 1989), to the “ISM” abundances adopted by Wilms et al. (2000), and in number. The result of GX 13+1, GX 340+0, and GX 340+0 is excluded to calculate the average of Fe/Si, Mg/Si, and Mg/O, respectively. | ||||
|---|---|---|---|---|---|---|---|
| (solar) | (solar) | (solar) | (solar) | (ISM) | (Number) | ||
| 0.48 | 0.55 | 0.59 | 0.550.39 | 0.290.21 | |||
| 0.48 | 0.55 | 0.59 | 0.550.17 | 0.500.15 | 13.33.9 | ||
| 1.080.17 | 1.210.19 | 1.15 | 1.140.13 | 0.900.10 | 1.220.14 | ||
| 1.42 | 1.060.25 | 0.95 | 1.030.12 | 0.710.09 | 0.470.06 | ||
| 0.64() | 1.060.59 | 0.94 | 0.970.31 | 0.880.29 | 1.280.41 | ||
| 2.2 | 2.2 | 2.0 | 2.21.1 | 1.940.90 | 0.1000.046 | ||
Note. — The errors are 90% confidence level.