Sub-mm detection of a high redshift Type 2 QSO
Abstract
We report on the first SCUBA detection of a Type 2 QSO at z=3.660 in the Chandra Deep Field South. This source is X-ray absorbed, shows only narrow emission lines in the optical spectrum and is detected in the sub-mm: it is the ideal candidate in an evolution scheme for AGN (e.g. Fabian (1999); Page et al. (2004)) of an early phase corresponding to the main growth of the host galaxy and formation of the central black hole. The overall photometry (from the radio to the X-ray energy band) of this source is well reproduced by the spectral energy distribution (SED) of NGC 6240, while it is incompatible with the spectrum of a Type 1 QSO (3C273) or a starburst galaxy (Arp 220). Its sub-mm (850 m) to X-ray (2 keV) spectral slope () is close to the predicted value for a Compton-thick AGN in which only of the nuclear emission emerges through scattering. Using the observed flux at 850 m we have derived a SFR=550–680 M⊙/yr and an estimate of the dust mass, M M⊙.
keywords:
galaxies: active - galaxies: nuclei - quasars: general - submillimetre1 Introduction
The presence of massive black holes (MBHs) at the centers of most galaxies appears by now firmly established. A number of correlations have been observed between the masses of MBHs and the properties of the galactic bulges hosting them (e.g. Kormendy & Gebhardt (2000), Merritt & Ferrarese (2001)). Since these correlations extend well beyond the direct dynamical influence of the MBH, it seems likely that a close link exists between the growth of the MBH and the formation of their host galactic bulges.
If these two events are co-eval then we would expect that powerful
black holes are hosted in the centers of the most massive
galaxies. SCUBA galaxies show a strong redshift clustering thus
indicating that they are hosted by very high mass halos
(Blain et al. (2003)). This is confirmed by CO molecular gas emission line
widths and possible rotation curves (Frayer et al. (1998); Genzel et al. (2003);
Neri et al. (2003)). The combination of deep X-ray observations and
spectroscopic follow-up campaigns of SCUBA sources
(Alexander et al. (2004)) led to the discovery that at least of the SCUBA sources host an AGN, although in the majority of the
cases the contribution of the nucleus is not bolometrically
significant (i.e., ).
A possible scenario would predict
that the black hole grows within a SCUBA galaxy until the obscuring
gas is blown away revealing an AGN (e.g. Fabian (1999)). A similar
evolution argument has been proposed for ULIRGs (Sanders & Mirabel (1996)),
which can be considered the closest local analogs to SCUBA
galaxies. We have started to investigate this scenario using a unique
sample of heavily X-ray absorbed (log(N cm-2) and
very luminous (log(L erg s-1) AGN, the so-called
Type 2 QSOs, located in the Chandra Deep Field-South (CDF-S) and
selected from
Szokoly et al. (2004). In this letter we report on the first sub-mm
detection of a high redshift (z=3.660) Type 2 QSO and discuss the
implications for its nature. We will discuss in a future paper the
properties of the full sample of Type 2 QSOs once our observational
programme is completed.
We assume a cosmology with parameters
, and H km s-1
Mpc-1.
2 Sub-mm observation
The Submillimetre Common User Bolometer Array (SCUBA, Holland et al. (1999)) was employed in photometry mode, with the wide 850:450 filter set, and a standard 60 arcsec chop in azimuth at 7.8Hz. The source was placed in the central bolometer (H7) and the median of the remaining bolometers was used for additional sky removal. Flux calibration was performed using Uranus. Telescope pointing was checked frequently while sky opacity was monitored via regular skydips at 850 and 450m and continuosly via the JCMT Water Vapour Monitor and the CSO Tau Meter. ranged from 0.05 to 0.13. The data were reduced using the SURF (SCUBA User Reduction Facility) software package. A linear interpolation between consecutive skydip values was used, and the nearest calibration source in time applied to account for the gain. After sky subtraction, the bolometer time-stream was clipped at the 3- level. Each of the individual datasets have been tested for consistency with one another using a Kolmogorov-Smirnov test, rejecting anything below the 5% mark.
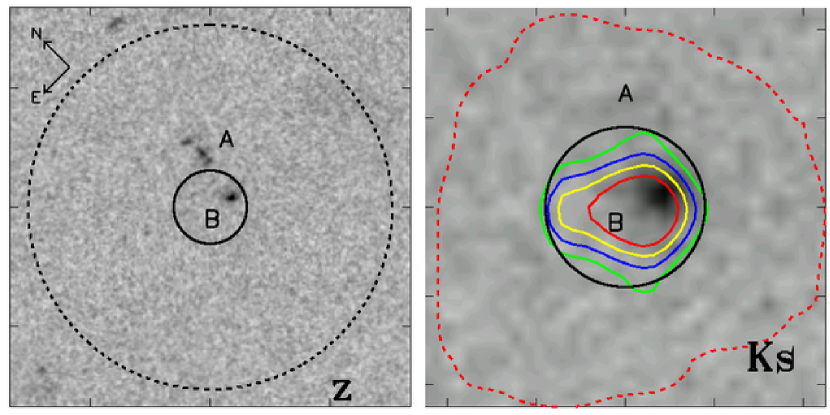
We have a firm detection (S/N) for CDFS-263111XID from Giacconi et al. (2002) (RA DEC, z) : S mJy. Since we already know the position of the X-ray source to sub-arcsec accuracy, the arcsec FWHM SCUBA beam would imply that the sub-mm emission is either coming from this source or something else within a radius of arcsec. Inside this area we find two optical counterparts in a deep ACS z band image centered on CDFS-263 (see left panel of Fig. 1). The X-ray contours clearly point to the counterpart named ’B’ in Fig. 1 (the continuum circle shows the Chandra positional error from Giacconi et al. (2002)) . The other possible sub-mm counterpart ’A’ has a complex sub-arcsec structure, where all the different components have the same optical/near-IR colours therefore likely are at the same redshift. Since a good spectroscopic redshift is not available for this object, we have derived a photometric redshift of z using the photometry in seven optical/near-IR bands (Table 3) and the public available code BPZ of Benitez (2000) (see Mainieri et al. (2004) for details on the procedure). Assuming this value, source ’A’ has to have L to shine in the sub-mm, and the probability to have by chance such a powerful source in the SCUBA error circle is low. The same area of the sky imaged in the KS band with ISAAC/VLT shows only the ’B’ counterpart (right panel of Fig. 1) reinforcing its chances to be the real sub-mm source.
| line | flux | FWHM | EW |
|---|---|---|---|
| erg cm-2 s | km s | Å | |
| Ly | 2.960.04 | 100010 | 29.63.0 |
| N V | 0.170.03 | 1580140 | 2.40.6 |
| C IV | 0.400.03 | 140050 | 5.70.9 |
3 Optical and X-ray spectroscopy
To help assign a reliable classification of CDFS-263 as a Type 2 quasar we have determined its optical emission line and X-ray spectral properties.
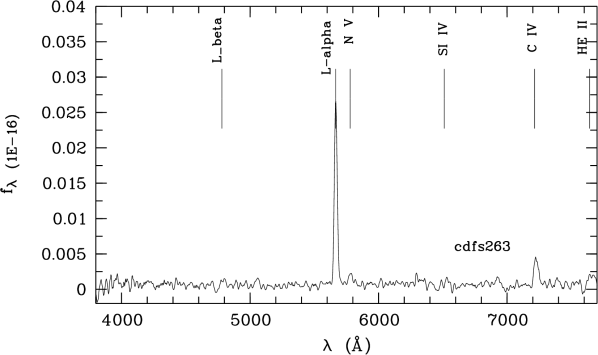
VLT FORS1 spectra of CDFS-263 were taken in 2000 during the spectroscopic identification programme of the CDF-S field (Szokoly et al. (2004)). The object was observed with a multi-slit mask using 1.2 arcsec wide single slits and grism 150I with a spectral dispersion of Å/pixel, which corresponds to a spectral resolution of Å. The seeing was about 0.5–0.6 arcsec. The total integrated exposure time of the spectrum (see Fig. 2) is about 3.3 hours. The measured redshift is .
The optical spectrum of CDFS-263 shows a strong Ly emission line and the two fainter lines of N V and C IV , whereas no further lines as e.g. Ly or SI IV are visible. Each emission line was fitted with a single Gaussian profile applying the Levenberg-Marquardt algorithm (Press et al. (1992)). The four adjustable parameters are the total line flux, the central wavelength, the FWHM in Å and the flux of a local linear continuum. From this set of parameters we have calculated the FWHM in km s-1 (corrected for instrumental resolution) and the rest frame EW in Å. The line flux, the rest frame FWHM and the rest frame EW of the visible lines are given in Table 1.
| parameter | PL intrinsic absorption | |
|---|---|---|
| model1 | model 2 | |
| NH (1022 cm-2) | 0 | 88 |
| z | 3.660 (froozen) | |
| 0.34 | 1.90 (frozen) | |
| 1.04 | 1.71 | |
| /dof | 1.19/4 | 3.37/5 |
| f0.5-10.0 (absorbed) | 1.93E-15 | 1.04E-15 |
| f0.5-10.0 (unabsorbed) | - | 2.00E-15 |
| L0.5-10.0 (absorbed) | 0.19E-44 | 0.37E-44 |
| L0.5-10.0 (unabsorbed) | - | 7.64E-44 |
Fit parameters are shown with 90% errors (). The
model and parameter definitions are: Model Components– PL:
Power-law with a photon index of and a 0.5-7 keV flux of
in units of 10-15 erg cm-2 s-1 using the
XSPEC model pegpwrlw. Intrinsic absorption:
Photo-electric absorption using Wisconsin cross-sections zwabs
(Morrison & McCammon 1983), where NH is the equivalent Hydrogen
column in units of 1022 atoms cm-2 and z is the redshift.
The luminosities reported in the table are in the rest frame [0.5-10]
keV energy band.
N V is observed at the 4 level. The line fluxes are a factor of lower compared to those of the prototype Type 2 QSO CDFS-202 (Norman et al. (2002)). The emission line widths are narrow with a FWHM of km s-1, whereas the mean line width of the permitted lines for X-ray selected Seyfert 1 and QSO1 ranges from to km s-1 (see Lehmann et al. (2001)). The narrow line widths and the observed 0.5-10 keV luminosity of erg s-1 indicate a Type 2 QSO (Szokoly et al. (2004)).
The analysis of the X-ray spectrum of CDFS-263 is essential to determine its amount of intrinsic X-ray absorption and its unabsorbed X-ray luminosity. We have used the public Chandra ACIS-I data of the 1 Msec CDF-S survey (Giacconi et al. (2002)). The total integrated exposure time is about 936 ksec for CDFS-263. The ACIS-I spectrum of the source was extracted from a circular region of arcsec in radius and the background spectrum was obtained from a source free region. The source spectrum contains 120 counts. The spectra were grouped to have at least 10 photons per bin.
Due to the small number of source photons we can only get an estimate of the X-ray spectral properties. The spectrum was analysed using XSPEC 11.3. A simple absorbed powerlaw model (1 in Table 2) gives a reasonable fit. The photon index of is low compared to that of found for most Seyfert galaxies and quasars. This points to a large intrinsic absorption of CDFS-263. Therefore we have frozen the photon index to 1.9 (model 2). The results of both models are shown in Table 2. All the errors quoted we calculated at 90% confidence level for two interesting parameters. As expected, the best fit model 2 shows a large NH of cm-2, which implies nearly Compton-thick absorption. If we correct for intrinsic absorption the 0.5-10 keV rest frame luminosity of CDFS-263 increases by a factor of (see Table 2). The best fit model (2) and the X-ray data points are shown in Fig. 3. Whereas the quality of the ACIS-I spectrum is low, the strong intrinsic absorption of CDFS-263 (at least N cm-2) is fairly well constrained.
The narrow optical emission lines (FWHM km s-1), the large intrinsic absoprtion (log N) and the large absorption corrected X-ray luminosity (log L) in the 0.5-10 keV energy band favour the Type 2 quasar nature of CDFS-263.

4 Discussion
4.1 Spectral energy distribution
CDFS-263 has been observed in a wide range of energy bands. Photometry
of extraordinary quality in the BVIz filters has been obtained with
the ACS camera on board of HST as part of the GOODS survey
(Giavalisco et al. (2004))222These data are publicly available at:
http://www.stsci.edu/science/goods/. As part of the same survey, ESO
carried out deep near-IR imaging with ISAAC/VLT in J, H and Ks bands333These data are publicly available at:
http://www.eso.org/science/goods/. Finally, we have a radio upper
limit from VLA observations at 20 cm of F Jy
(K. Kellerman, private comunication). The available photometry for
CDFS-263 in summarized in Table 3.
According to the radio-power
criterion given by
Stocke et al. (1992), we can classify this AGN as radio-quiet. Hence,
a non-thermal (synchrotron) contribution to the sub-mm flux is
expected to be small (Carleton et al. (1987); Hughes et al. (1993)).
We compare
the photometry of CDFS-263 with the SED of several well-studied local
sources. We choose 3C273 as a template of an unabsorbed quasar, NGC
6240 a well-studied (U)LIRG which hosts a Compton-thick AGN, and Arp
220 as a starburst galaxy where X-ray binaries are the major source of
its X-ray emission (Iwasawa et al. (2001)). Due to the difference in
redshift between our source and these templates, we have photometry
for CDFS-263 in wavelength regions not covered for the local
sources. In particular for CDFS-263, the V filter contains
Ly while the i band contains the CIV line. We have
subtracted the contribution of these lines in the observed fluxes and
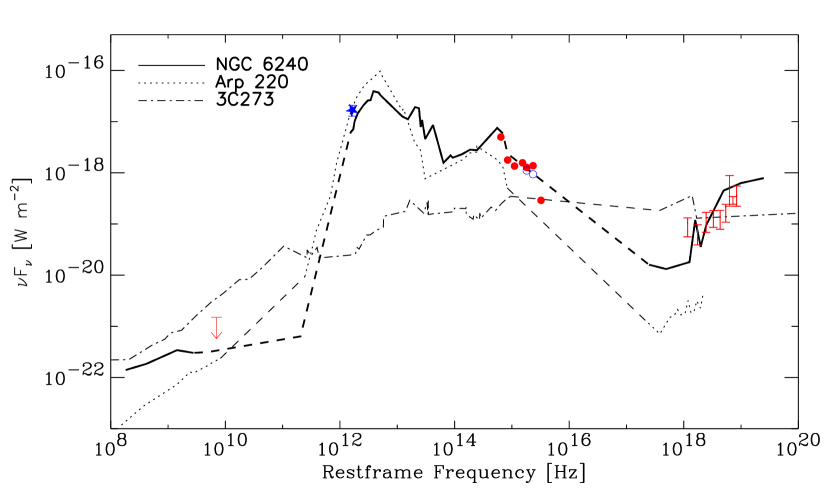
compared them with the templates SED in Fig. 4. The
wide-band energy distribution of CDFS-263 is inconsistent with the
spectrum of an unabsorbed QSO (dash-dotted line in
Fig. 4): if we anchor 3C273 to the X-ray
observations, we underpredict the fluxes at the other
wavelengths. Using the SED of NGC 6240, we can reproduce in a
consistent way the observed sub-mm, optical, near-IR and X-ray fluxes
of our source (solid thick line in Fig. 4). The
observed flux in the B band is low compared with the expected one,
this can be ascribed to absorption due to the Ly forest for a
source at (see also Stern et al. (2002)). Finally, the energy
distribution of CDFS-263 does not resemble the SED of Arp 220 (dotted
line in Fig. 4): if we fix the template at the
observed sub-mm flux we underestimate the X-ray flux by two orders of
magnitudes. We note that Arp 220 appears to be an order of magnitude
underluminous in soft X-rays, given its FIR luminosity, if compared
with other starbursts galaxies (see Fig. 3 of
Iwasawa et al. (2001)), but this is not enough to reconcile the
photometry of CDFS-263 with a starburst template.
| Observed | Rest-frame | Observed | Fν |
| Band | Band | AB Magnitude | [W/m2] |
| 2-10 keV a | 27.9 keV | … | 2.6E-19 |
| 0.5-2 keV a | 5.8 keV | … | 8.1E-20 |
| F435W b | 927Å | 27.70.4 | 2.9E-19 |
| F606W b | 1277Å | 25.670.05 | 1.4E-18 |
| F775W b | 1654Å | 25.380.08 | 1.3E-18 |
| F850LP b | 1957Å | 25.080.08 | 1.6E-18 |
| J c | 2690Å | 24.50.1 | 1.4E-18 |
| H d | 3550Å | 23.90.4 | 1.8E-18 |
| Ks c | 4660Å | 22.460.04 | 5.0E-18 |
| 850m e | 1.6E3 GHz | … | 1.6E-17 |
| 20 cm f | 6.9 GHz | … | 1.5E-21 |
aChandra/ACIS; bHST/ACS; cVLT/ISAAC; dNTT/SOFI; eJCMT/SCUBA; fVLA
4.2 Sub-mm to X-ray spectral index
To further compare the properties of our source with local templates
and other SCUBA observations of X-ray sources, we derive the sub-mm
(850 m) to X-ray (2 keV) spectral slope () of
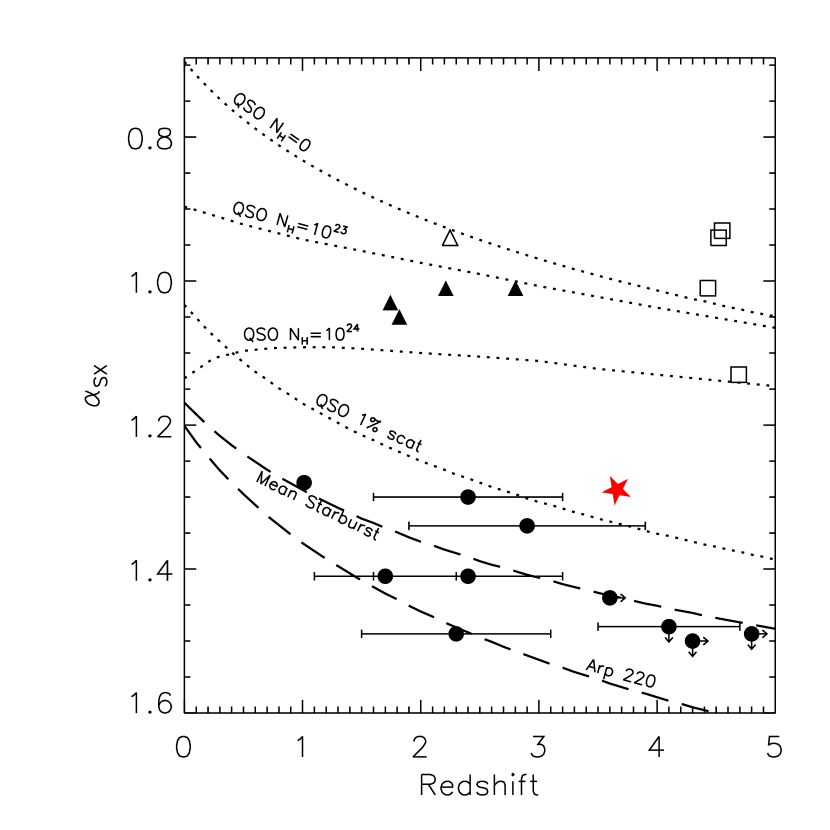
CDFS-263. Fig. 5 shows the expected values of
, as a function of redshift, for a number of template
SEDs. Namely, a quasar with no absorption in the X-ray or with
different amounts of absorption (N and
Compton-thick with 1 of the nuclear emission scattered); a mean
starburst template and Arp 220. These templates are described in
detail in Almaini et al. (2003).
CDFS-263 yields a value of (star symbol in Fig. 5). This value
is clearly incompatible with an unabsorbed AGN, as we already expected
from the optical and X-ray spectral properties of the source. On the
other hand, it is close to the spectral index of a Compton-thick AGN
in which only of the nuclear emission emerges through
scattering. The X-ray spectral fit yields a column density of cm-2 (see Table 2). One way to obtain this value of
is a sub-mm flux due to starburst activity plus an
absorbed AGN in the center of the host galaxy that accounts for the
X-ray emission, which is higher than that expected for a starburst
galaxy alone (dashed line in Fig. 5) (see also
Fabian et al. (2000); Alexander et al. (2003); Almaini et al. (2003)). For
comparison we report in Fig. 5 other X-ray
selected sources with sub-mm data measurements from the
literature. Namely, the CDF-N sources from Alexander et al. (2003)
(circles) the majority of which show values higher
than CDFS-263, and compatible with the expected indices for a
starburst galaxy, although all except one of them lack a precise
redshift measurement. The X-ray absorbed (filled triangles) and X-ray
unabsorbed (empty triangle) ROSAT BLAGN from
Page et al. (2001) and Page et al. (2004) are sampling a different region in
Fig. 5, with their values
being closer to pure QSO tracks in agreement with their nature as
unabsorbed AGN in the optical band. Finally, we show also the
values of some Type 1 QSOs (square) with X-ray
(Kaspi et al. (2000)) and sub-mm (McMahon et al. (1999)) observations. The
location of our source in the vs plot is
peculiar: it has a lower than any source from
Alexander et al. (2003) at high redshift and a higher value of the BLAGN
from Page et al. (2001) &
Page et al. (2004) and the Type 1 QSOs at .
4.3 Star Formation Rate, dust mass and black hole mass
Under the hypothesis that the sub-mm flux is due to star formation activity, we estimate, using the measured flux at 850 m, the dust-enshrouded Star Formation Rate (SFR) and the dust mass. We note that the temperature of the dust heated by the AGN would be too high ( K) to emit in the sub-mm. The far-infrared luminosity (LFIR) provides a reasonable measure of the active formation of massive stars. Assuming a dust temperature of 40K and an emissivity index = 1.2 (e.g. Dunne et al. (2000)) we interpolate from the 850 m luminosity and get an estimate of the 60 m luminosity assuming an optically-thin greybody. The SFR is given by:
where is the fraction of opticalUV light being radiated in the far-infrared and depends on the IMF and the fraction of the opticalUV light that is absorbed and re-radiated in the FIR. For we get (assuming and H).
The dust mass is given by:
M
where z is the redshift, S850 is the observed flux density, DL is the luminosity distance, krest is the rest frequency absorption coefficient and B is the Planck function. Using K (see Scott et al. (2002)) we derive an M M⊙. The dust mass estimate assumes optically thin thermal emission with no contribution from bremsstrahlung or synchrotron radiation.
Finally, we compute the rest frame absorption corrected L keV erg s-1 and using the relation given by Marconi et al. (2004) estimate the bolometric luminosity, L erg s-1. Assuming that LLEdd, where LEdd is the Eddington luminosity, we derive a lower limit on the black hole mass: M M⊙.
5 Conclusions
We have a firm () SCUBA detection of a Type 2 QSO at redshift (CDFS-263). Its SED is consistent, from radio to X-ray wavelengths, with the shape of NGC 6240 while it can not be reproduced with the SED of 3C273 or Arp 220. Futhermore, we derive an . We conclude that CDFS-263 can be powered by a Compton thick AGN (we found N cm-2).
CDFS-263 is a strong candidate for an AGN in the initial phase (before the “X-ray absorbed phase”) described by Page et al. (2004) that corresponds to the main growth period of the host galaxy spheroid. It is a luminous X-ray source (L erg s-1) with high X-ray absorption (N cm-2) and detected in the sub-mm, S mJy.
Acknowledgments
We thank Kazushi Iwasawa for providing us the Beppo-SAX data points
for Arp 220 and Andrea Merloni for useful discussions. We thank the
referee for helpful comments that improved the manuscript.
We
acknowledge support from the European Community RTN Network “POE”
(under contract HPRN-CT-2000-00138).
References
- Alexander et al. (2003) Alexander D.M. et al., 2003, ApJ, 125, 383
- Alexander et al. (2004) Alexander D.M. et al., 2004, Proceedings of the ESO/USM/MPE Workshop on “Multiwavelength Mapping of Galaxy Formation and Evolution”, eds. R.Bender and A.Renzini [astro-ph/0401129]
- Almaini et al. (2003) Almaini D.M et al., 2003, MNRAS, 338, 303
- Archibald et al. (2001) Archibald E.N. et al., 2001, MNRAS, 323, 417
- Benitez (2000) Benitez N. 2000, ApJ, 536, 2000
- Blain et al. (2003) Blain A.W. et al., 2003, ApJ, 611, 725
- Borys et al. (2003) Borys C. et al., 2003, MNRAS, 344, 385
- Carleton et al. (1987) Carleton N.P. et al., 1987, ApJ,318, 595
- Chapman et al. (2003) Chapman S.C., Blain A.W., Ivison R.J., Smail I.R., 2003, Nat, 422, 695
- Dunne et al. (2000) Dunne L., Eales S., Edmunds M. et al., 2000, MNRAS, 315, 115
- Fabian (1999) Fabian A.C., 1999, MNRAS, 308, L39
- Fabian et al. (2000) Fabian A.C. et al., 2000, MNRAS, 315, L8
- Frayer et al. (1998) Frayer D. et al., 1998, ApJ, 506, L7
- Genzel et al. (2003) Genzel R. et al., 2003, ApJ, 584, 633
- Giacconi et al. (2002) Giacconi R. et al. 2002, ApJS, 139, 369
- Giavalisco et al. (2004) Giavalisco M. et al., 2004, ApJ, 600, 93
- Holland et al. (1999) Holland W.S. et al., 1999, MNRAS, 303, 659
- Hughes et al. (1993) Hughes D.H. et al., 1993, MNRAS, 263, 607
- Iwasawa et al. (2001) Iwasawa K. et al., 2001, MNRAS, 326, 894
- Kaspi et al. (2000) Kaspi S. et al., 2000, AJ, 119, 2031
- Kormendy & Gebhardt (2000) Kormendy J. & Gebhardt K., 2000, Am. Inst. Phys., p.63 [astro-ph/0105230]
- Lehmann et al. (2001) Lehmann I. et al., 2001, A&A, 371, 833
- Marconi et al. (2004) Marconi A. et al., 2004, MNRAS, 351, 169
- Mainieri et al. (2004) Mainieri V. et al., 2004, submitted to A&A
- McMahon et al. (1999) McMahon R.G. et al., 1999, MNRAS, 309, L1
- Merritt & Ferrarese (2001) Merritt D. & Ferrarese L., 2001, MNRAS, 320, L30
- Morrison et al. (1983) Morrison, R., McCammon, D., 1983, ApJ, 270, 199
- Neri et al. (2003) Neri R. et al., 2003, ApJ, 597, 113
- Norman et al. (2002) Norman C. et al., 2002, ApJ, 571, 218
- Page et al. (2001) Page M.J. et al., 2001, Science, 294, 2516
- Page et al. (2004) Page M.J. et al., 2004, accepted by ApJL, [astro-ph/0407171]
- Press et al. (1992) Press et al., 1992, Numerical recipes in FORTRAN, Example book, 2nd edition (Cambridge Press)
- Sanders & Mirabel (1996) Sanders D.B. & Mirabel I.F., 1996, ARA&A, 34, 749
- Scott et al. (2002) Scott S.E., Fox M.J., Dunlop J.S. et al., 2002, MNRAS, 331, 817
- Stern et al. (2002) Stern D.. et al., 2002, ApJ, 568, 71
- Stevens et al. (2004) Stevens J.A., Page M.J., Ivison R.J., et al., 2004, ApJ, 604, 17
- Stocke et al. (1992) Stocke J.T. et al., 1992, ApJ, 396, 487
- Szokoly et al. (2004) Szokoly G.P. et al., 2004, ApJS in press, [astro-ph/0312324]