Calibration Observations of Fomalhaut with the VLTI
Abstract
An investigation of the stability of the transfer function of the European Southern Observatory’s Very Large Telescope Interferometer has been carried out through observations of Fomalhaut, which was observed over a range in hour angle from 21:50–05:24 on 20 October 2002. No significant variation in the transfer function was found for the zenith angle range 5\degr–70\degr. The projected baseline varied between 139.7 m and 49.8 m during the observations and, as an integral part of the determination of the transfer function, a new accurate limb-darkened angular diameter for Fomalhaut of 2.109 0.013 mas has been established. This has led to improved values for the emergent flux = (3.43 0.10) Wm-2, effective temperature = 8819 67 K and radius = (1.213 0.011) m (R/R = 1.744 0.016). The luminosity has been found to be (6.34 0.20) W (L/L = 16.5 0.5).
keywords:
Techniques: interferometric – Stars: individual (Fomalhaut) – Stars: fundamental parametersdavis@physics.usyd.edu.au
1 Introduction
A major problem in ground-based optical/infrared long-baseline interferometry is establishing the true interference fringe visibility from measurements made through the Earth’s turbulent atmosphere. The observed visibility is always less than the true visibility due to residual seeing and instrumental effects no matter how well the interferometer is designed, compensated and aligned. The technique generally adopted to correct for the loss in visibility is to interleave observations of the object being studied with observations of a calibrator - a star for which the true visibility at the baseline and wavelength being employed is known. A calibrator is thus a star that is either essentially unresolved or whose angular diameter is known with sufficient accuracy to predict the true visibility with the desired accuracy. Division of the observed visibility for the programme object by the observed visibility for the calibrator yields the true visibility for the programme object, providing the instrumental and atmospheric conditions do not change significantly between the measurements.
Optical/infrared interferometers generally measure the square of the fringe visibility as defined by Michelson and, for convenience, we will follow Davis et al. ([1999b]) and use correlation to represent the square of the fringe visibility . We define the transfer function of an interferometer as the ratio of the observed correlation over the expected correlation . The transfer function is thus given by
| (1) |
The true correlation for a programme object is then given by dividing its observed correlation by the transfer function for its associated calibrator.
This procedure works well when programme object and calibrator are close in the sky and the observations are made close in time. However, problems have been experienced at blue wavelengths (440 nm) with the Sydney University Stellar Interferometer (SUSI) (Davis et al. [1999a]) when the program object and calibrator are separated by more than on the sky, or when the seeing conditions are changing on the timescale of the individual measurements.
As part of the commissioning programme of the European Southern Observatory’s Very Large Telescope Interferometer (VLTI) (Glindemann et al. [2000]), a large number of calibrator observations have been accumulated (Percheron et al. [2003]) and are being pursued to assess, among other things, the stability and repeatability of the transfer function in the spectral K band at a wavelength of 2.2 m. The correlation measurements are made with the VINCI instrument (Kervella et al. [2000]), which is based on the FLUOR instrument (Coudé du Foresto et al. [1998]), and it employs an optical fibre beam-combiner and photometric monitoring of the beams. The spatial and temporal scales of the turbulence-induced wavefront distortions scale as and, with the spatial filtering provided by VINCI, the VLTI is expected to be significantly less affected by atmospheric effects than instruments working at shorter wavelengths and with conventional beam-combiners.
One step proposed for the investigative programme was to observe a single star over a large range in hour angle, and hence in zenith angle , to investigate whether the transfer function had a dependence on . Time was allocated for these programmes when the VLTI was operating with its two test siderostats (Derie et al. [2000]) separated by 140 m. The limiting K magnitude of the system for an unresolved star was and, for a partially resolved star, the limiting magnitude was brighter by . With this sensitivity limit a shorter baseline would have provided a choice of unresolved stars for the experiment. However, given the circumstances, it was decided to make observations at the longer baseline since they were of intrinsic interest and, in addition, would provide experience for planning more detailed experiments with a shorter baseline in the future. The limiting magnitude placed severe restrictions on the choice of stars, particularly as an unresolved star with declination close to the latitude of the VLTI location on Paranal () would ideally be chosen for following over a large range in hour angle. At the scheduled time for the observations no suitable unresolved candidate stars were available. It was decided to follow Fomalhaut ( PsA, HR 8728, HD216956, spectral type A3V), even though it would be significantly resolved at 140 m based on the Narrabri Stellar Intensity Interferometer limb-darkened angular diameter of mas (Hanbury Brown et al. [1974]).
2 The Observations and Data Analysis
The observations were made on the night of 20 October 2002 in the normal observing mode of the VLTI as a series of Observing Blocks (OBs) except that, instead of alternating OBs between a programme star and a calibrator, all OBs were for Fomalhaut. Each block consisted of three groups of 500 scans of the fringe envelope. The star was followed over the hour angle range from 21:50 to 05:24 giving a range in zenith angle from to . The sky was clear throughout the observations and the mean zenith seeing, measured in the visual, was 0.76\arcsec. The seeing only exceeded 1\arcsecfor the first 3 of the 34 accepted sets of scans. The atmospheric coherence time, again determined for the visual, had 99% of the 502 values between 1.1 ms and 2.7 ms with a mean value of 1.85 ms. The range of values for the seeing and coherence time represent a typical night at Paranal and in no sense are they exceptional and, as discussed in Sect. 4, there is no correlation between the variations in the seeing or coherence time and in the observed correlation values.
The observational data were processed in the VINCI pipeline (Ballester et al. [2002]). The processing automatically excludes scans for which the signal/noise in the photometry channels is less than 5. Some 25% of the sets of scans retained only a small fraction of the total of 500 scans due to drifting of the starlight off the input end of the optical fibers. The groups retaining less than 40% of the total scans (15 out of a total of 49 sets) were found to deviate randomly from the general trend of the observations and to have large uncertainties associated with them. They were removed from the analysis reported here, although a separate analysis showed that they had no significant influence on the results or conclusions because of their low statistical weight.
The correlation values from VINCI’s two interferometry channels, A and B, differ by a scale factor but track each other closely. Initially they were analysed independently and gave essentially identical results with no significant differences. The two sets of correlation values were therefore put on the same scale by normalising the B values by the weighted mean ratio of the A/B values. The two sets of data were then combined by taking a weighted mean of the A and scaled B values at each hour angle. The weighted mean values of correlation as a function of hour angle, zenith angle and projected baseline are listed in Table 1. Figure 1 shows the correlation values plotted against hour angle for the combined data. The large variation of correlation with hour angle was expected due to the change in projected baseline from 139.7 m to 49.8 m during the course of the observations.
| Hour | Projected | Zenith | Correlation |
| Angle | Baseline | Angle | |
| (hours) | (m) | (degrees) | |
| 21.89 | 132.5 | 28.57 | 0.1453 0.0065 |
| 22.56 | 136.7 | 19.85 | 0.1345 0.0044 |
| 22.98 | 138.4 | 14 48 | 0.1256 0.0026 |
| 23.09 | 138.8 | 13.16 | 0.1291 0.0034 |
| 23.76 | 139.7 | 5.96 | 0.1203 0.0026 |
| 23.86 | 139.7 | 5.32 | 0.1267 0.0022 |
| 23.97 | 139.6 | 5.01 | 0.1234 0.0023 |
| 00.17 | 139.2 | 5.48 | 0.1233 0.0022 |
| 00.28 | 138.9 | 6.21 | 0.1321 0.0042 |
| 00.58 | 137.8 | 9.23 | 0.1247 0.0032 |
| 00.69 | 137.2 | 10.44 | 0.1271 0.0034 |
| 00.79 | 136.6 | 11.69 | 0.1345 0.0047 |
| 01.00 | 135.3 | 14.19 | 0.1397 0.0022 |
| 01.10 | 134.5 | 15.53 | 0.1391 0.0023 |
| 01.21 | 133.7 | 16.87 | 0.1385 0.0027 |
| 01.41 | 131.9 | 19.40 | 0.1432 0.0028 |
| 01.51 | 130.8 | 20.75 | 0.1427 0.0028 |
| 01.62 | 129.7 | 22.12 | 0.1450 0.0026 |
| 01.82 | 127.4 | 24.73 | 0.1493 0.0037 |
| 01.93 | 126.0 | 26.12 | 0.1522 0.0047 |
| 02.03 | 124.6 | 27.50 | 0.1628 0.0051 |
| 02.30 | 120.8 | 30.96 | 0.1687 0.0051 |
| 02.73 | 113.6 | 36.64 | 0.1875 0.0052 |
| 02.84 | 111.7 | 38.02 | 0.1919 0.0064 |
| 03.57 | 96.8 | 47.50 | 0.2330 0.0058 |
| 03.71 | 93.5 | 49.33 | 0.2352 0.0062 |
| 04.01 | 86.6 | 53.09 | 0.2646 0.0064 |
| 04.11 | 83.9 | 54.46 | 0.2721 0.0103 |
| 04.22 | 81.2 | 55.82 | 0.2706 0.0076 |
| 04.44 | 75.6 | 58.59 | 0.2840 0.0062 |
| 04.65 | 69.8 | 61.32 | 0.3038 0.0067 |
| 05.25 | 53.0 | 68.79 | 0.3413 0.0119 |
| 05.35 | 49.8 | 70.12 | 0.3297 0.0138 |
| 05.46 | 46.5 | 71.51 | 0.3460 0.0173 |

3 The Effective Wavelength
In interferometric measurements, the spatial frequency of each observation is given by the ratio of the baseline and the wavelength. While the baseline can be reliably measured and its projection easily predicted as a function of observation time, an accurate determination of the wavelength requires some effort since the measurements are usually performed using filters with a finite bandwidth. The spectral sensitivity curve of the VLTI VINCI system has been determined from the spectral transmission curve of the K band filter used, the attenuation curve for the optical fibers, the detector spectral quantum efficiency curve, and representative transmission curves for the atmosphere across the band (Manduca & Bell [1979]; Lord [1992]). The spectral reflectivities of the silver and gold coated mirrors in the optical path are essentially constant across the K band. The spectral sensitivity curves were computed for the two atmospheric transmission curves and gave effective wavelengths, for a constant photon flux per unit wavelength across the spectrum, of 2.199 m and 2.195 m. The mean of these two values, 2.197 m, has been adopted. Based on the differing model predictions for the atmospheric transmission across the band, the range of precipitable water vapour at Paranal, and the effect of zenith angle, the uncertainty in the effective wavelength is estimated to be 0.005 m. More details on this approach can be found in a technical report by Davis & Richichi ([2003]). For the observations of Fomalhaut, taking into account the slope of the stellar spectrum across the spectral sensitivity curve, the effective wavelength was determined to be 2.181 0.005 m. This value is insensitive to the temperature of the star and changing the temperature by 2000 K changes the effective wavelength by 0.001 m.
4 The Transfer Function
The variation in correlation seen in Fig. 1 is primarily due to the variation in projected baseline during the course of the observations and follows closely the curve expected for a partially resolved star. If there is a variation in the transfer function with time this will also contribute to the variation of correlation but to a very much smaller degree.
Initially was computed as a function of zenith angle with the expected correlation computed using the Intensity Interferometer angular diameter. The limb-darkened angular diameter of 2.10 mas (Hanbury Brown et al., [1974]) was converted to the equivalent uniform-disk angular diameter for the K band for this purpose using a correction factor () taken from Davis et al. ([2000]) who computed correction factors for Kurucz model atmospheres. For an A3V star, assuming an effective temperature of 8750 K and of 4.0, the ratio of the limb-darkened to uniform-disk angular diameter () is 1.011 giving an equivalent uniform-disk angular diameter of 2.08 mas for the K band. The computed values of were almost constant with zenith angle showing only a very small linear slope. However, the distribution of the observational points about the line of best fit had a greater spread than expected for the formal uncertainties in the individual values. It was clear that the uncertainties were underestimated and, although the cause cannot be identified from the data, short term effects due to the atmosphere are a likely significant contributor. The formal uncertainties were increased by a scaling factor and was computed for a linear fit to the versus zenith angle data. This was repeated for a range of scaling factors and it was found that a scaling factor of 2.2 gave a probability of 70%. This factor has been adopted and applied to the formal uncertainties. The scaled uncertainties have been used throughout the following analysis and discussion. It is important to stress that this has no effect on the results or conclusions of this paper apart from increasing the uncertainties in the derived parameters.
Although is almost constant with zenith angle based on the angular diameter determined with the NSII, a variation of with zenith angle cannot be excluded. If a variation is present it will affect the angular diameter determined from the values of correlation versus projected baseline. Assuming for the moment that is constant with zenith angle, and following the general practice for stars with compact atmospheres, the values of correlation as a function of projected baseline were fitted with the curve for a uniform disk
| (2) |
where , is the projected baseline of the interferometer, is the equivalent uniform-disk angular diameter of the star and is the effective wavelength of the observations. The projected baselines were computed in the VLTI data-processing pipeline and the effective wavelength for the observations was 2.181 0.005 m (Sect. 3). The fit yielded a uniform-disk angular diameter of 2.086 0.012 mas and a correlation value at zero baseline of 0.3904 0.0048 with a reduced value of 0.83. The uncertainty in the angular diameter is the formal error of the fit.
When the uncertainty in the effective wavelength (Sect. 3) is taken into account, the uniform-disk angular diameter becomes 2.086 0.013 mas. The observed correlation values, normalised by the zero-baseline correlation value, and the fitted equivalent uniform disk curve are shown in Fig. 2.

It can be seen from Fig. 2 that the fit is excellent with no obvious trends away from the uniform disk curve. The points at the shortest baselines, which show the greatest scatter and largest uncertainties, were taken at zenith angles exceeding 65\degrbut have negligible effect on the resulting uniform-disk angular diameter. There is no correlation between the differences of the observed correlation from the fitted curve and the variations in the seeing and atmospheric coherence time.
The transfer function has been assumed constant in the analysis. If it had varied significantly during the course of the observations it would have affected the correlation values and led to an erroneous value for the angular diameter. Assume for the moment that varied with zenith angle and that the variation is known and used to ‘correct’ the observed values of correlation. An angular diameter fit to the ‘corrected’ values of correlation would be expected to result in an improved fit with a lower value for the reduced . To explore this possibility various linear dependencies of the on both the zenith angle and on were tried. The latter is the theoretical dependence of the atmospheric spatial and temporal coherence parameters and on . In each case the correlation values were ‘corrected’ and an angular diameter fit was made. It was found that the minimum value for the reduced occurred for zero dependence on and on . It is concluded that any dependence of on is small and that the angular diameter determined on the assumption of zero dependence is valid.
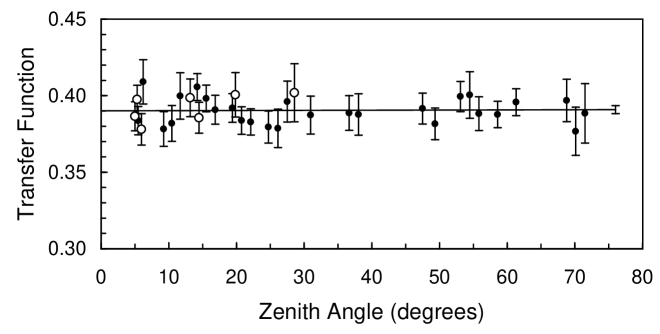
Finally, was computed as a function of , using the new uniform-disk angular diameter to predict the expected correlation in equation 1. The resulting values for are plotted against zenith angle in Fig. 3. The figure shows no apparent dependence of transfer function on zenith angle over the range from 5\degr–70\degr, as confirmed through a linear regression fit. Again there is no correlation between the differences of the observed correlation from the fitted curve and the variations in the seeing and atmospheric coherence time. The mean transfer function was 0.3901 0.0026, in agreement with the zero-baseline correlation value obtained from the angular diameter fit.
It is noted that in determining the angular diameter, circular symmetry has been assumed. The value of of 85 kms-1 for Fomalhaut (Abt & Morrell, [1995]) does not classify it as a rapid rotator, and any effect of rotational distortion on the observations is small compared with the uncertainty in the angular diameter. Fig. 4 shows the u,v track of the observations. The angle between the projected baseline and a fixed arbitrary reference axis through the centre of the star in the plane of the sky changed by only 45.8\degrduring the observations. Fomalhaut is a main-sequence IR excess star but shows no excess radiation at the wavelength of observation (Gillett [1986]). Scattered radiation from the star will be a small fraction of the direct stellar radiation and will not significantly affect the results discussed here. An independent study based on VLTI measurements of Fomalhaut, using the standard approach of calibrated observations, also confirms that there is no detectable infrared excess at the VINCI wavelengths (Di Folco et al. [2004]).

The mean transfer function corresponds to a fringe visibility of 62.5% for a completely unresolved source and it only applies to the particular night of observation. The transfer function may vary due to changes in the atmosphere and in the instrument. Long term changes occur for the VLTI due to a temperature-dependence of polarization in the fiber beam combiner and changes in the optical train to configure different baselines. An investigation of the long-term changes in the transfer function of the VLTI is being pursued and values of the fringe visibility between 40% and 87% for an unresolved source have been measured over a period of about 18 months of operation of the VLTI. The implication of the present result is that, in the short term and with a single baseline, the VLTI is remarkably stable.
5 Fundamental Quantities for Fomalhaut
It was concluded in the previous section that any dependence of the on is small and that the uniform disk angular diameter determined on the assumption of zero dependence is valid. Based on this assumption, we have proceeded to derive the limb-darkened angular diameter and some fundamental parameters for Fomalhaut. The factor , for converting the uniform disk angular diameter to the true limb-darkened angular diameter, has been computed to be 1.011 0.001 for the relatively broad spectral passband of the VLTI following the procedure given by Tango & Davis ([2002]). Thus the true limb-darkened angular diameter is 2.109 0.013 mas. This is in excellent agreement with the limb-darkened angular diameter determined with the Narrabri Stellar Intensity Interferometer of 2.10 0.14 mas and with a factor of 10 improvement in accuracy from to .
The combination of the new accurate limb-darkened angular diameter with the flux received from the star, and with the Hipparcos parallax, enables improved values for the emergent flux at the stellar surface, and the star’s effective temperature and radius to be calculated.
The flux received from Fomalhaut was derived by Code et al. ([1976]). Following the same procedures, the integrated flux has been revised by putting the visual spectrophotometry of Davis & Webb ([1974]) on the Vega calibration of Hayes ([1985]) in place of that of Oke & Schild ([1970]), and using the absolute flux calibration at 550 nm of Mégessier ([1995]). The infrared contribution has been estimated from the flux distribution for Fomalhaut given by Alekseeva et al. ([1997]), scaled to match the Davis & Webb flux distribution in the range 700–800 nm, the JHKL photometry of Bouchet et al. ([1991]) converted to fluxes using Mégessier’s calibration ([1995]), and the 12 m flux given by Gillett ([1986]). The ultraviolet contribution in the band 182–330 nm has been reduced by 2.5% in accord with the change in the visual flux between 330 nm and 370 nm to which the uv spectrophotometry was originally matched by Code et al. The flux shortward of 182 nm has not been changed. The total flux received from the star, integrated over the entire spectrum, is estimated to be (8.96 0.25) Wm-2.
Combining the received flux with the limb-darkened angular diameter gives the emergent surface flux to be (3.43 0.10) Wm-2 and the effective temperature 8819 67 K. The accuracy of the effective temperature has been improved by a factor of five compared with the determination by Code et al. ([1976]) and is now limited by the uncertainty in the integrated flux rather than by that of the angular diameter. The improved accuracy will assist in identifying stellar atmosphere models with the star.
The Hipparcos parallax ([1997]) of 130.08 0.92 mas, combined with the limb-darkened angular diameter, gives the radius of Fomalhaut as (1.213 0.011) m (R/R = 1.744 0.016). Previous estimates of the radius have been based on the Narrabri Stellar Intensity Interferometer angular diameter which limited the accuracy to 6.7% but, with the new value for the angular diameter, the accuracy has been improved to 0.9%. The luminosity of Fomalhaut, given by , where is the distance and is the total flux received from the star, is (6.34 0.20) W (L/L = 16.5 0.5).
6 Summary
We have analyzed a set of VLTI interferometric measurements obtained on the bright star Fomalhaut using the VLTI. These measurements were recorded with the main goal of studying the accuracy and stability of the VLTI equipped with the VINCI instrument. Unlike standard interferometric practice, they were not interspersed with independent calibrator observations.
For the night concerned, while it is not possible to completely rule out a dependence on zenith angle, we have shown that the transfer function was remarkably stable even though the observations were taken over large ranges in zenith angle, projected baseline, and observed correlation values. The observational data are an excellent fit to the transform for a uniform disk and our analysis shows that, if there is a dependence on zenith angle, it is at a level that does not significantly affect the value of the fitted uniform disk angular diameter.
A bonus, and an integral result of the analysis of the observations, was the accurate determination of the angular diameter for Fomalhaut. This has allowed fundamental quantities for this important star to be determined with significantly improved accuracy.
The angular diameter has been determined without recourse to observations of a calibrator. This has been possible as a result of observations having been made over a wide range in projected baseline length combined with the stability of the transfer function. It is emphasised that the interleaving of observations of calibrators with those of programme stars will continue to be the normal mode of operation, since it would not be realistic to abandon it on the basis of one night’s observations. However, the implications of the results presented here are that the VLTI in its current configuration, using the VINCI optical fiber beam combiner, gives remarkably stable transfer functions in the short term with a single baseline, and that the angular separation of target and calibrators is not as crucial a matter as found at shorter wavelengths with conventional beam-combiners. It augurs well for the future of the VLTI and for optical/infrared interferometry in general.
Acknowledgements.
The work presented was carried out during a visit by J. Davis to the European Southern Observatory during which he worked with members of the VLTI group on calibration problems. He is grateful to F. Paresce, S. D’Odorico, and the ESO Visitor’s Programme for the opportunity to participate in the VLTI programme. Assistance from P. Kervella during the observations and discussions with E. Di Folco are gratefully acknowledged. A. Richichi also wishes to acknowledge the support received during an extended visit to the School of Physics, University of Sydney, sponsored by the ESO Director General’s Discretionary Fund.References
- [1995] Abt, H. A., & Morrell, N. I. 1995, ApJS, 99, 135
- [1997] Alekseeva, G. A., Arkharov, A. A., Galkin, V. D. et al. 1997, Baltic Astron., 6, 481
- [2002] Ballester, P., Chavan, A. M., Cotton, B. et al. 2001, in Proc. SPIE Vol. 4477, Astronomical Data Analysis, eds. J. L. Starck & F. Murtagh, 225
- [1991] Bouchet, P., Manfroid, J., & Schmider, F. X. 1991, A&AS, 91, 409
- [1976] Code, A. D., Davis, J., Bless, R. C., & Hanbury Brown, R. 1976, ApJ, 203, 417/
- [1998] Coudé du Foresto, V., Perrin, G., Ruilier, C., et al. 1998, in Proc. SPIE Vol. 3350, Astronomical Interferometry, ed. R. Reasenberg, 856
- [1974] Davis, J., & Webb, R. J. 1974, MNRAS, 168, 163
- [1999a] Davis, J., Tango, W. J., Booth, A. J., et al. 1999a, MNRAS, 303, 773
- [1999b] Davis, J., Tango, W. J., Booth, A. J., Thorvaldson, E. D., & Giovannis, J. 1999b, MNRAS, 303, 783
- [2000] Davis, J., Tango, W. J., & Booth, A.J. 2000, MNRAS, 318, 387
- [2003] Davis, J., Richichi, A., 2003, ESO Technical Report VLT-TRE-ESO-15810-3033
- [2000] Derie, F., Brunetto, E., Duchateau, M., et al. 2000, in Proc. SPIE Vol. 4006, Interferometry in Optical Astronomy, eds. P. J. Léna, & A. Qirrenbach, 99
- [2004] Di Folco, E., Thevenin, F., Kervella, P., Domiciano de Souza, A., Coudé du Foresto, V., et al., 2004, A&A submitted
- [1997] ESA 1997, The Hipparcos Catalogue, ESA SP-1200
- [1986] Gillett, F. C. 1986, in Astrophys. & Space Sciences Library Vol. 124, Proc. of First Iras Conference, Light on Dark Matter, ed. F. P. Israel (Reidel, Dordrecht), 61
- [2000] Glindemann, A., Abuter, R., Carbognani, F., et al. 2000, in Proc. SPIE Vol. 4006, Interferometry in Optical Astronomy, eds. P. J. Léna, & A. Qirrenbach, 2
- [1974] Hanbury Brown, R., Davis, J., & Allen, L. R. 1974, MNRAS, 167, 121
- [1985] Hayes, D. S. 1985, in Proc. IAU Symposium No. 111, Calibration of Fundamental Stellar Quantities, ed. D. S. Hayes, L. E. Pasinetti, & A. G. Davis Philip (Reidel: Dordrecht), 225
- [2000] Kervella, P., Coudé du Foresto, V., Glindemann, A., & Hofmann, R. 2000, in Proc. SPIE Vol. 4006, Interferometry in Optical Astronomy, eds. P. J. Léna, & A. Qirrenbach, 31
-
[1992]
Lord, S. D. 1992, NASA Technical Memor. 103957
(Data available from
www.gemini.edu/sciops/ObsProcess/obsConstraints/) - [1979] Manduca, A., & Bell, R. A. 1979, PASP, 91, 858
- [1995] Mégessier, C. 1995, A&A, 296, 771
- [1970] Oke, J. B., & Schild, R. E. 1970, ApJ, 161, 1015
- [2003] Percheron, I., Richichi, A., Wittkowski, M., 2003, Astrophysics and Space Science, 286, 219
- [2002] Tango, W. J., & Davis, J. 2002, MNRAS, 333, 642