High resolution infrared spectra of NGC 6342 and NGC 6528: two moderately reddened Bulge Globular Clusters ††thanks: Data presented herein were obtained at the W.M.Keck Observatory, which is operated as a scientific partnership among the California Institute of Technology, the University of California, and the National Aeronautics and Space Administration. The Observatory was made possible by the generous financial support of the W.M. Keck Foundation.
Abstract
Using the NIRSPEC spectrograph at Keck II, we have obtained infrared echelle spectra covering the range for the moderately reddened bulge globular clusters NGC 6342 and NGC 6528, finding [Fe/H]=–0.60 and –0.17 dex, respectively. We measure an average -enhancement of dex in both clusters, consistent with previous measurements on other metal rich bulge clusters, and favoring the scenario of a rapid bulge formation and chemical enrichment. We also measure very low isotopic ratios (5 in NGC 6342 and 8 in NGC 6528), suggesting that extra-mixing mechanisms due to cool bottom processing are at work during evolution along the Red Giant Branch.
keywords:
Galaxy: bulge, globular clusters: individual (NGC 6342 and NGC 6528) — stars: abundances, late–type — techniques: spectroscopic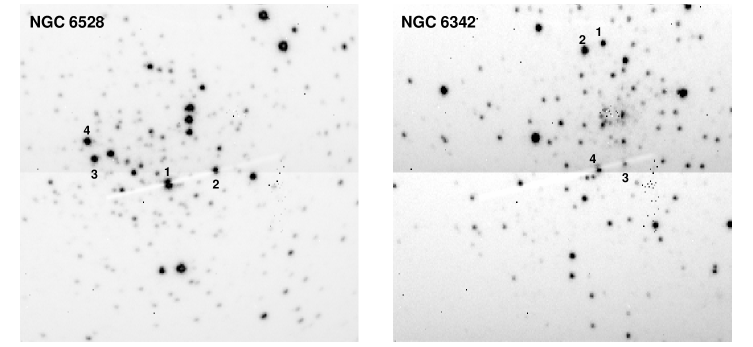
1 Introduction
Infrared, high resolution spectroscopy has tremendous potential as a powerful tool to study both distant and obscured stellar populations. For the heavily obscured regions of the Galactic bulge and center, infrared spectroscopy offers the best approach to measuring the composition of the old stellar populations.
Over the past few years we have commenced a high-resolution spectroscopic survey of the Galactic bulge in the near-IR using NIRSPEC, a high throughput infrared (IR) echelle spectrograph at the Keck Observatory (McLean, 1998). H–band (1.5–1.8 m) spectra of bright giants in the bulge globular clusters and field population are ideal for detailed abundance analysis of Fe, C, O and other -elements, using the approach of synthesizing the entire spectrum. By observing the most luminous giants in the infrared, we have the possibility of placing the obscured stars and globular clusters toward the galactic center, and populations well studied in the optical, on the same abundance scale. The abundance distributions in the cluster and field populations are important in constraining the history of bulge formation and chemical enrichment (McWilliam, 1997).
We have used this method to derive abundances for four bulge globular clusters: the results for NGC 6553 and Liller 1 are given in Origlia, Rich & Castro (2002), while abundances for Terzan 4 and Terzan 5 are reported in Origlia & Rich (2004). We find -enhancement at a level of a factor between 2 and 3 over the whole range of metallicity spanned by the clusters in our survey, from [Fe/H]–1.6 (cf. Terzan 4) up to [Fe/H]–0.2 (cf. Terzan 5). In this paper we present the high resolution IR spectra and the abundance analysis of four bright giants in NGC 6342 and NGC 6528, two bulge globular clusters with relatively low reddening.
The most recent metallicity estimates based on optical (Heitsch & Richtler, 1999) and near-IR photometry (Momany et al., 2003; Valenti, Ferraro & Origlia, 2004) report global metallicities [M/H] and dex and iron abundance s [Fe/H] and for NGC 6342 and NGC 6528, respectively. NGC 6342 has never been studied at high spectral resolution before, while NGC 6528 has been observed with HIRES at Keck I by Carretta et al. (2001). They found iron abundance slightly in excess of solar ([Fe/H]=+0.07) and -enhancement of Ca ([Ca/Fe]=+0.2) and Si ([Si/Fe]=+0.4) and marginal enhancement of O, Mg and Ti. Very recently, Zoccali et al. (2004) observed NGC 6528 giants with UVES at VLT, finding [Fe/H]=–0.15 and moderate -enhancement of O, Si and Mg by +0.1–0.2 dex.
Our observations and data reduction follow in Sect. 2. Sect. 3 discusses our abundance analysis and in Sect. 4 the resulting metallicities and radial velocities are presented. We discuss our findings in Sect. 5.
2 Observations and Data Reduction
Near infrared, high-resolution echelle spectra of four bright giants in the core of the bulge globular clusters NGC 6342 and NGC 6528 have been acquired during two observational campaigns in July 2002 and 2003. We used the infrared spectrograph NIRSPEC (McLean, 1998) which is at the Nasmyth focus of the Keck II telescope. The high resolution echelle mode, with a slit width of (3 pixels) and a length of 24″ and the standard NIRSPEC-5 setting, which covers most of the 1.5–1.8 micron H-band, have been selected. Typical exposure times (on source) ranged from 8 to 16 minutes. Fig. 1 shows the H band images of the observed core region of NGC 6342 and NGC 6528 taken with the slit viewing camera (SCAM) of NIRSPEC, which has a field of view of 46″46″ and a scale of .
The raw two dimensional spectra were processed using the REDSPEC IDL-based package written at the UCLA IR Laboratory. Each order has been sky subtracted by using the pairs of spectra taken with the object nodded along the slit, and subsequently flat-field corrected. Wavelength calibration has been performed using arc lamps and a second order polynomial solution, while telluric features have been removed by dividing by the featureless spectrum of an O star. At the NIRSPEC resolution of R=25,000 several single roto-vibrational OH lines and CO bandheads can be measured to derive accurate oxygen and carbon abundances. Other metal abundances can be derived from the atomic lines of Fe I, Mg I, Si I, Ti I and Ca I. Abundance analysis is performed by using full spectral synthesis techniques and equivalent width measurements of representative lines.
3 Abundance Analysis
We compute suitable synthetic spectra of giant stars by varying the stellar parameters and the element abundances using an updated version of the code described in Origlia, Moorwood & Oliva (1993). The main characteristics of the code have been widely discussed in our previous papers (Origlia, Rich & Castro, 2002; Origlia & Rich, 2004) and they will not be repeated here. The code uses the LTE approximation and is based on the molecular blanketed model atmospheres of Johnson, Bernat & Krupp (1980) at temperatures 4000 K and the ATLAS9 models for temperatures above 4000 K. The reference solar abundances are from Grevesse & Sauval (1998).
Photometric estimates of the stellar parameters are initially used as input to produce a grid of model spectra, allowing the abundances and abundance patterns to vary over a large range and the stellar parameters around the photometric values. The model which better reproduces the overall observed spectrum and the equivalent widths of selected lines is chosen as the best fit model. We measure equivalent widths in the observed spectrum (see Table 1), in
the best fit model and in four additional models which are, respectively, 0 .1 and 0.2 dex away from the best-fitting. This approach gives us the uncertainties listed in Table 2.
Stellar parameter uncertainty of 200 K in temperature (Teff), 0.5 dex in log-gravity (log g) and 0.5 km s-1 in microturbulence velocity () , can introduce a further systematic 0.2 dex uncertainty in the absolute abundances. However, since the CO and OH molecular line profiles are very sensitive to effective temperature, gravity, and microturbulence variations, they constrain better the values of these parameters, significantly reducing their initial range of variation and ensuring a good self-consistency of the overall spectral synthesis procedure (Origlia, Rich & Castro, 2002; Origlia & Rich, 2004). Solutions with Teff200 K, log g=0.5 dex and 0.5 km s-1 and corresponding 0.2 dex abundance variations from the best-fitting one are indeed less statistically significant (typically at level only, Origlia & Rich (2004)). Moreover, since the stellar features under consideration show a similar trend with variation in the stellar parameters, although with different sensitivity, relative abundances are less dependent on stellar parameter assumptions, reducing the systematic uncertainty to 0.1 dex.
| NGC 6342 | NGC 6528 | |||||||||
| star | #1 | #2 | #3 | #4 | #1 | #2 | #3 | #4 | ||
| ref #a | 53 | 16 | 48 | 19 | 3139 | 3101 | 3167 | 3166 | ||
| 0.64 | 0.80 | 0.67 | 0.77 | 1.01 | 0.94 | 0.77 | 0.78 | |||
| –0.6 | –1.4 | –0.6 | –1.4 | –3.7 | –2.3 | –2.4 | –2.6 | |||
| [km s-1] | +111 | +111 | +111 | +121 | +215 | +215 | +200 | +210 | ||
| Ca 1.61508 | 80 | 132 | 80 | 113 | 279 | 261 | 231 | 209 | ||
| Fe 1.61532 | 158 | 186 | 145 | 164 | 250 | 265 | 257 | 247 | ||
| Fe 1.55317 | 145 | 168 | 143 | 153 | 213 | 227 | 230 | 218 | ||
| Mg 1.57658 | 396 | 408 | 396 | 377 | 439 | 447 | 462 | 435 | ||
| Si 1.58884 | 399 | 458 | 400 | 397 | 534 | 518 | 514 | 503 | ||
| OH 1.55688 | 62 | 211 | 62 | 136 | 358 | 320 | 306 | 280 | ||
| OH 1.55721 | 63 | 228 | 62 | 137 | 367 | 324 | 308 | 285 | ||
| Ti 1.55437 | 187 | 290 | 187 | 264 | 413 | 418 | 397 | 429 |
| NGC 6342 | NGC 6528 | |||||||||
|---|---|---|---|---|---|---|---|---|---|---|
| star | #1 | #2 | #3 | #4 | #1 | #2 | #3 | #4 | ||
| Teff [K] | 4250 | 4000 | 4250 | 4000 | 3600 | 3800 | 4000 | 4000 | ||
| log g | 1.5 | 1.0 | 1.5 | 1.0 | 0.5 | 0.5 | 1.0 | 1.0 | ||
| [km s-1] | 2.0 | 2.0 | 2.0 | 2.0 | 2.0 | 2.0 | 2.0 | 2.0 | ||
| –0.61 | –0.57 | –0.59 | –0.62 | –0.21 | –0.16 | –0.15 | –0.17 | |||
| .09 | .08 | .09 | .09 | .06 | .07 | .08 | .08 | |||
| +0.33 | +0.30 | +0.29 | +0.30 | +0.32 | +0.27 | +0.38 | +0.33 | |||
| .11 | .09 | .10 | .10 | .10 | .09 | .08 | .09 | |||
| +0.40 | +0.37 | +0.39 | +0.37 | +0.41 | +0.36 | +0.35 | +0.37 | |||
| .17 | .14 | .17 | .17 | .11 | .11 | .12 | .13 | |||
| +0.36 | +0.40 | +0.39 | +0.32 | +0.31 | +0.26 | +0.35 | +0.27 | |||
| .18 | .17 | .18 | .18 | .19 | .19 | .19 | .19 | |||
| +0.37 | +0.37 | +0.39 | +0.37 | +0.31 | +0.36 | +0.37 | +0.37 | |||
| .15 | .16 | .15 | .15 | .14 | .14 | .14 | .14 | |||
| +0.21 | +0.27 | +0.24 | +0.27 | +0.22 | +0.26 | +0.37 | +0.37 | |||
| .19 | .19 | .19 | .19 | .13 | .13 | .13 | .14 | |||
| +0.33 | +0.35 | +0.35 | +0.34 | +0.31 | +0.31 | +0.36 | +0.34 | |||
| .13 | .12 | .13 | .13 | .10 | .10 | .11 | .11 | |||
| –0.34 | –0.33 | –0.31 | –0.37 | –0.29 | –0.34 | –0.25 | –0.53 | |||
| .11 | .11 | .11 | .11 | .09 | .10 | .10 | .11 |
a is the average abundance ratio (see Sect. 4).
4 Results
By combining full spectral synthesis analysis with equivalent width measurements, we derive abundances of Fe, C, O and 12C/13C for the four observed giants in NGC 6342 and NGC 6528. The abundances of additional elements Ca, Si, Mg and Ti are obtained by measuring a few major atomic lines.
The near-IR spectra of cool stars also contain many CN molecular lines. However, at the NIRSPEC resolution most of them are very faint and blended with the stronger CO, OH and atomic lines. By performing full spectral synthesis and analyzing the few lines reasonably detectable (although contaminated), one can obtain rough estimates of nitrogen abundances.
Stellar temperatures (see Table 2) are both estimated from the colors (see Table 1) and molecular lines, gravity from theoretical evolutionary tracks, according to the location of the stars on the Red Giant Branch (RGB), and adopting an average microturbulence velocity of 2.0 km/s (see also Origlia et al., 1997). Equivalent widths (see Table 1) are computed by Gaussian fitting the line profiles and the overall uncertainty is 10%.
In order to check further the statistical significance of our best-fitting solution, we compute synthetic spectra with Teff200 K, log g=0.5 dex and 0.5 km s-1, and with corresponding simultaneous variations of 0.2 dex of the C and O abundances to reproduce the depth of the molecular features. We follow the strategy illustrated in Origlia & Rich (2004). As a figure of merit we adopt the difference between the model and the observed spectrum (hereafter ).
In order to quantify systematic discrepancies, this parameter is more powerful than the classical test, which is instead equally sensitive to random and systematic scatters.
Since is expected to follow a Gaussian distribution, we compute and the corresponding standard deviation for our best-fitting solution and the other models with the stellar parameter and abundance variations quoted above. We then extract 10,000 random subsamples from each test model (assuming a Gaussian distribution) and we compute the probability that a random realization of the data-points around a test model display a that is compatible with an ideal best-fitting model with a =0. indicates that the model is a good representation of the observed spectrum. The statistical tests are performed on portions of the spectra mainly containing the CO bandheads and the OH lines which are the most sensitive to the stellar parameters.
4.1 NGC 6342
In order to obtain a photometric estimate of the stellar temperatures and the bolometric magnitudes we use the near IR photometry by Valenti, Ferraro & Origlia (2004) and their E(B-V)=0.57 reddening and (m-M)0=14.63 distance modulus. We also use the color-temperature transformations and bolometric corrections of Montegriffo et al. (1998), specifically calibrated for globular cluster giants. We constrain effective temperatures in the range 4000–4500 K, and we estimate bolometric magnitudes for stars #1 e 3 and for stars #2 and 4 (see Table 1). The final adopted temperatures, obtained by best-fitting the CO and in particular the OH molecular bands which are especially temperature sensitive in cool giants, are reported in Table 2.

Fig. 2 shows our synthetic best fits superimposed on the observed spectra of the four giants in NGC 6342. From our overall spectral analysis we find average [Fe/H], [O/Fe] and (see Table 2). We also measure an average carbon depletion ([C/Fe]=–0.34 dex) and low isotopic ratio and enhancement (by a factor of 2-3) of [N/Fe]. As shown in Fig. 4 our best-fitting solutions have an average probability 0.99 to be statistically representative of the observed spectra. The other test models with different assumptions for the stellar parameters are only significant at level.
4.2 NGC 6528
We use the near IR photometry of Ferraro et al. (2000) and their E(B-V)=0.62 reddening and (m-M)0=14.37 distance modulus. We find photometric temperatures in the 3600-4000 K range and bolometric magnitudes between -2.3 and -3.7 (see Table 1). The final adopted temperatures, obtained by best-fitting the CO and the OH molecular bands, are reported in Table 2.

Fig. 3 shows our synthetic best-fitting superimposed on the observed spectra of the four giants in NGC 6528. For this cluster our abundance analysis give an average [Fe/H], [O/Fe] and an overall average . We also measure an average carbon depletion ([C/Fe]=–0.35 dex), a low 12C/13C and some [N/Fe] enhancement (by a factor of 2-3).
In order to further check the robustness of our best-fitting solutions, the same statistical test done for NGC 6342 has been repeated here. As shown in Fig. 5 our best-fitting solutions have an average probability 0.97 to be statistically representative of the observed spectra, while the other test models are only significative at level.
5 Discussion and Conclusions
Our high resolution spectroscopy in the near IR gives iron abundances for NGC 6342 and NGC 6528 which are in excellent agreement with the photometric estimates, as obtained from the RGB morphology and luminosity in the optical as well as in the near IR.
Our iron abundance of NGC 6528 is also in excellent agreement with the one estimated by Zoccali et al. (2004) from optical spectroscopy, while is slightly lower (0.2 dex) than that of Carretta et al. (2001). Such a slightly higher value of iron abundance is still marginally consistent at a level with our IR spectra. A similar iron abundance discrepancy between IR (Origlia, Rich & Castro, 2002; Meléndez et al., 2003) and optical measurements by Carretta et al. (2001) has been found for NGC 6553.
Our O, Ca, Mg and Ti abundances of NGC 6528 are fully consistent with the study of red HB stars by Carretta et al. (2001), while our Si abundance is lower by 0.3 dex. Our O, Si, and Mg abundances are also consistent (only marginally higher) with those for red giants (though less luminous than ours) by Zoccali et al. (2004). The abundances of Ti and Ca, in particular, by Zoccali et al. (2004) (see also McWilliam & Rich, 1994) are significantly lower than those from our and Carretta et al. (2001) studies.
Our composition is also consistent with that found for Galactic bulge field stars (McWilliam & Rich, 1994). Photometry of NGC 6528 and a comparably metal rich bulge globular cluster, NGC 6553, indicates that these two clusters are as old as the Galactic halo with no measurable age difference (Ortolani et al., 1995). This has been reinforced by recent photometry in which the cluster members have been separated from the field by their relative proper motions (Zoccali et al., 2001; Feltzing & Johnson, 2002). The results of our study are consistent with NGC 6342 and 6528 being related to the field population of the Galactic bulge, their composition bearing the imprint of an early era of enrichment by massive star supernovae. We find it difficult to entertain the notion that type I SNe contributed significantly to the enrichment of NGC 6528, or that the composition of this cluster is different from the other bulge clusters we have studied. However, the significant dispersion in the composition of NGC6528, even based on analyses using high S/N spectra from 8-10m class telescopes, emphasizes that the composition of metal rich stars is far from being a solved problem.
The low abundance ratios measured in NGC 6342 and NGC 6528 are similar to those measured in bright giants of halo (Suntzeff & Smith, 1991; Shetrone, 1996; Gratton et al., 2000; Vanture, Wallerstein & Suntzeff, 2002; Smith, Terndrup & Suntzeff, 2002; Origlia et al., 2003) as well as other bulge (Origlia, Rich & Castro, 2002; Shetrone, 2003; Origlia & Rich, 2004) globular clusters, over the entire range of metallicities between one hundredth and solar. They can be explained by additional mixing mechanisms due to cool bottom processing in the stellar interiors during the evolution along the RGB (see e.g. Charbonnel, 1995; Denissenkov & Weiss, 1996; Cavallo, Sweigart & Bell, 1998; Boothroyd & Sackmann, 1999).


Acknowledgments
LO and EV acknowledge the financial support by the Agenzia Spaziale Italiana (ASI) and the Ministero dell’Istruzione, Università e Ricerca (MIUR).
EV acknowledges the financial support by the Marco Polo project and UCLA for the hospitality during her visit.
RMR acknowledges support from grant number AST-0098739, from the National Science Foundation. The authors are grateful to the staff at the Keck Observatory and to Ian McLean and the NIRSPEC team. The authors wish to recognize and acknowledge the very significant cultural role and reverence that the summit of Mauna Kea has always had within the indigenous Hawaiian community. We are most fortunate to have the opportunity to conduct observations from this mountain.
References
- Boothroyd & Sackmann (1999) Boothroyd, A. I., & Sackmann, I. J. 1999, 1999, ApJ, 510, 232
- Carretta et al. (2001) Carretta, E., Cohen, J., Gratton, R.G., & Behr, B. 2001, AJ, 122, 1469
- Cavallo, Sweigart & Bell (1998) Cavallo, R. M., Sweigart, A. V., & Bell, R. A. 1998, ApJ, 492, 575
- Charbonnel (1995) Charbonnel, C. 1995, ApJ, 453, L41
- Denissenkov & Weiss (1996) Denissenkov, P. A, & Weiss, A. 1996, A&A, 308, 773
- Dubath, Meylan & Mayor (1997) Dubath, P., Meylan, G., & Mayor, M. 1997, A&A, 324, 505
- Feltzing & Johnson (2002) Feltzing, S., & Johnson, R.A. 2002, A&A, 385, 67
- Ferraro et al. (2000) Ferraro, F.R., Montegriffo, P., Origlia, L. & Fusi Pecci, F. 2000, AJ, 119, 1282
- Gratton et al. (2000) Gratton, R., Sneden, C., Carretta, E., & Bragaglia, A. 2000, A&A, 354, 169
- Grevesse & Sauval (1998) Grevesse, N., & Sauval, A. J. 1998, Space Science Reviews, 85, 161
- Heitsch & Richtler (1999) Heitsch, F., & Richtler, T. 1999, A&A, 347, 455
- Johnson, Bernat & Krupp (1980) Johnson, H. R., Bernat, A. P., & Krupp, B. M. 1980, ApJS, 42, 501
- McLean (1998) McLean, I. et al. 1998, SPIE, 3354, 566
- McWilliam (1997) McWilliam, A. 1997, ARA&A, 35, 503
- McWilliam & Rich (1994) McWilliam, A. & Rich, R. M. 1994, ApJS, 91, 749
- McWilliam & Rich (1994) McWilliam, A. & Rich, R. M. 2004, arnegie Observatories Astrophysics Series, Vol. 4: Origin and Evolution of the Elements, ed. A. McWilliam and M. Rauch (Pasadena: Carnegie Observatories, http://www.ociw.edu/ociw/symposia/series/symposium4/ proceedings.html)
- Meléndez et al. (2003) Meléndez, J., Barbuy, B., Bica, E., Zoccali, M., Ortolani, S., Renzini, A., & Hill, V. 2003, A&A, 411, 417
- Momany et al. (2003) Momany, Y., Ortolani, S., Held, E. V., Barbuy, B., Bica, E., Renzini, A., Bedin, L. R., Rich, R. M.; Marconi, G. 2003, A&A, 402, 607
- Montegriffo et al. (1998) Montegriffo, P., Ferraro, F.R., Fusi Pecci, F., & Origlia, L., 1995, MNRAS, 276, 739
- Origlia, Moorwood & Oliva (1993) Origlia, L., Moorwood, A. F. M., & Oliva, E. 1993, A&A, 280, 536
- Origlia et al. (1997) Origlia, L., Ferraro, F. R., Fusi Pecci, F., & Oliva, E. 1997, A&A, 321, 859
- Origlia, Rich & Castro (2002) Origlia, L., Rich, R. M., & Castro, S. 2002, AJ, 123, 1559
- Origlia et al. (2003) Origlia, L., Ferraro, F. R., Bellazzini, M. & Pancino, E. 2003, ApJ, 591, 916
- Origlia & Rich (2004) Origlia, L., & Rich, R. M. 2004, AJ, 127, 3422
- Ortolani et al. (1995) Ortolani, S. et al. 1995, Nature, 377, 701
- Shetrone (1996) Shetrone, M. d. 1996, AJ, 112, 2639
- Shetrone (2003) Shetrone, M. d. 1996, ApJ, 585, 45
- Smith, Terndrup & Suntzeff (2002) Smith V. V., Terndrup, D. M., & Suntzeff, N. B. 2002, ApJ, 579, 832
- Suntzeff & Smith (1991) Suntzeff, N. B., & Smith, V. V. 1991, ApJ, 381, 160
- Valenti, Ferraro & Origlia (2004) Valenti, E., Ferraro, F.R., & Origlia, L. 2004, MNRAS, 351, 1204
- Vanture, Wallerstein & Suntzeff (2002) Vanture, A. D., Wallerstein, G., & Suntzeff, N. B. 2002, ApJ, 569, 984
- Zoccali et al. (2001) Zoccali, M., Renzini, A., Ortolani, S., Bica, E., & Barbuy, B. 2001, AJ, 121, 2638
- Zoccali et al. (2004) Zoccali, M., Barbuy, Hill, V., Ortolani, S., Renzini, A., Bica, E., Momany, Y., Pasquini, L., Minniti, D., & Rich, M. 2004, astro-ph/0405475