Abstract
The starburst IMF is probably as much of theoretical interest and practical relevance as it is a subject of observational controversy. In this conference paper we review the most common methods (star counts, dynamical masses, and line ratios) to derive or constrain the IMF, and discuss potential problems and shortcomings that often lead to claims of anomalous IMF slopes and mass cut-offs.
The Starburst IMF – An Impossible Measurement?
Starburst IMF
1 Introduction
The IMF in regions of violent star formation activity, so-called starbursts, is still a rather controversial issue. For instance, the ultra-luminous infrared galaxy Arp 220 with a total gas mass of Arp 220 has about five times the amount of gas available in the Milky Way. However, its star formation rate of /yr is about 200 times higher than in our Galaxy, and – in addition – the regions of star formation are rather concentrated near the center(s) of the galaxy.
It may seem plausible that in such regions, where the physical boundary conditions for star formation differ so substantially from the solar neighborhood, the IMF may be different as well. Such a difference may be indicated by either a different IMF slope (“top heavy”), a significantly higher low-mass cut-off (“”) or a different high-mass cut-off.
The observational verification of these differences is all but trivial: there are few regions that can serve as starburst templates, most of which are at large distances, have unknown morpholgies, and are often heavily extincted. For closer regions, which can be resolved into individual stars, the dynamical range of typically more than 10 magnitudes in flux differences between low and high mass stars is a significant limitation. Not surprisingly, the strongest support for anomalous IMFs to date comes from the observations of distant starburst galaxies or individual super star clusters. While those environments are indeed rather different from the local ones it should also be kept in mind how little we know about these distant system as the uncertainties in both observations and models are fairly large. In this conference paper we discuss the general difficulties in the IMF determination.
2 Method I: star counts
The most common method, which has also be shown to work well in nearby regions of quiescent star formation, is the direct detection of stars. After photometric extraction of the sources and subtraction of foreground and background field stars, the correction for incompleteness (see below) takes care of instrumental limitations and possibly of the extra contribution from unresolved binary systems. Finally, the conversion from magnitudes to masses leads to a present-day mass function, which is often, and not very precisely, called the initial mass function as dynamical effects in young clusters are (incorrectly) considered to be of little importance.
The results from a recent study of the IMF in R136, the ionizing cluster in the 30 Doradus nebula, are shown in Figure 1 as a function of radial distance [(Andersen, Brandl & Zinnecker 2004)]. The errors for the innermost 1 pc () are very large and the derived slopes not very meaningful. However, outside the core region the slope agrees, within the uncertainties, well with a [Salpeter (1955)] slope and shows no significant steepening with distance to the cluster center.

However, each step from the observed image to an IMF slope involves potential difficulties, of which we can here address only a few:
2.1 Problem: the high-mass stars
At no time within a massive, coeval cluster’s lifetime will it be possible to observe all its members on the main sequence. Many of the most massive stars will have collapsed or exploded before the lower mass stars reach the main sequence. High mass stars show strong luminosity evolution and mass loss during their short lifetimes. In particular the luminosity evolution of a given spectral subtype within its lifetime can be larger than the initial difference between different spectral subtypes. It is therefore almost impossible to accurately determine masses of O-stars from photometry alone (and individual spectra are usually not available).
There is also mounting evidence that the evolution of massive stars in the core of a dense stellar cluster is significantly influenced by the other cluster members. [Portegies Zwart et al. (1999)] have shown in N-body simulations that due to the high stellar densities mergers of massive stars occur frequently, and by doing so increase its cross-section while the cluster is becoming denser due to mass segregation, in some kind of “runaway merger” process. In other words, a central massive star grows steadily in mass through mergers with other stars in less than Myr, and the observed properties are not representative of the initial mass distributions.
2.2 Problem: the low-mass stars
Besides the obvious difficulty of detecting relatively faint, low-mass stars a significant uncertainty will be introduced by the fact that in most young clusters they are still in their pre-main sequence (PMS) phase. (The fact that PMS stars are brighter than their main sequence counterparts at infrared wavelengths, improves the situation slightly). However, the models for converting magnitudes to masses depend critically on the cluster age which has typical uncertainties in the order of . Usually all stars within a cluster are assumed to be co-eval. Furthermore, the conversion also depends on the wavebands that were used and on the specific PMS model. This situation is illustrated in Table 1.
| Modela | Age [Myr] | DMb | color | slope |
|---|---|---|---|---|
| SDF | 1 | 13.9 | ||
| SDF | 1 | 13.9 | ||
| SDF | 1 | 14.3 | ||
| SDF | 2 | 13.9 | ||
| PS | 1 | 13.9 |
aSDF – [Siess et al. (2000)]; PS – [Palla & Stahler (1999)]. bDM – distance modulus
The effects of heating, outflows and stellar winds [(Lamers, Snow & Lindholm 1995)], and in particular the strong winds from O-stars [(Churchwell 1997)], will cause the residual gas to be removed from the cluster on rather short timescales of Myr. If the gas cloud was originally virialized, and the star formation efficiency is about 30%, the cluster will loose about 2/3 of its mass. As a result, a signifcant fraction of its young members will get lost, preferentially low-mass stars at the high tail of the velocity dispersion and/or at large distances [(Kroupa & Boily 2002)].
This has important observational consequences: even for a rather distant Galactic cluster like NGC 3603 at 7 kpc with an assumed velocity dispersion of 5 km/s the radial distances of initial cluster stars can be as large as after 1 Myr (including a projection factor). If the reference field taken to estimate the field star population is closer than this radius there are two problems: (i) stars that were born in the center are now missing there, and (ii) those stars may now be mistaken as field stars and subtracted from the cluster sample. Both effects work in the same direction and introduce an artificial flattening of the IMF.
2.3 Problem: differential extinction
[Sirianni et al. (2000)] reported a “definitive flattening below ” of the IMF slope at ps around R136. This finding was based on optical data from HST/WFPC2 and the numbers were corrected for incompleteness. Unfortunately, the standard Monte-Carlo technique for incompleteness correcton – adding artificial stars to the “real” image and computing their detection probability as a function of distance from the cluster center and source brightness – corrects only for statistical (crowding, blending) and instrumental (noise, flatfield) effects. In contrast, strong variations in the more localized differential extinction are caused either by the evolution of the PMS object or by rather compact and patchy foreground extinction, and can vary by several magnitudes at optical wavelengths. These variations cannot be easily corrected with Monte-Carlo techniques (see Figure 3). Since the reddening distribution is very uncertain, the best work-around are observations at near-IR wavelength where the extinction is reduced by about an order of magitude.


3 Method II: cluster mass-to-light ratios
Most starburst systems are located well beyond the Local Group and are not resolvable into their individual stellar members (except for the very brightest stars) with current techniques. However, so-called super star clusters (SSCs) may be the result of a recent starburst, and their integrated properties can be observationally studied.
3.1 The basic principle
For a given set of assumptions (see below) the dynamical mass of a cluster is related to its velocity dispersion via
| (1) |
where . The velocity dispersion can be determined from high resolution spectroscopy and the half-light radius from high resolution imaging. Photometry will yield the total luminosity and the mass-to-light ratio will provide an estimate of the underlying IMF.
Using this technique [Mengel et al. (2002)] found that the IMF in selected SSCs in the Antennae galaxies is approximately consistent with Salpeter for a mass range of . On the other hand, [Smith & Gallagher (2001)] found that in M82-F a lower mass cut-off of is required for a MF with a Salpeter slope, i.e., M/L is lower than normal.
3.2 The problematic assumptions
The approach described above depends on the validity of several assumptions:
The correct half-light radius . Even gravitationally-bound, young clusters often deviate from radially symmetric, King-like cluster profile. A perfect example is R136, which has several bright cluster members at larger distance from the center. While those stars can be easily excluded from the light profile at the distance of the LMC, they blend with the core at larger distances (lower spatial sampling) and increase the measured . This effect is illustrated in Figure 3.
A gravitationally bound cluster. While the two most massive HII regions in the Local Group, 30 Doradus in the LMC and NGC 604 in M 33, have about the same luminosity they have completely different morphological structures. The core of 30 Dor, R136, is a massive compact cluster and presumably gravitationally bound, while NGC 604 consists of a several smaller, less luminous HII regions, which are not gravitationally bound together. However, at the distance of e.g., the Antennae galaxies, where the scale of one WFPC2 pixel corresponds to about 9 parsecs, 30 Dor and NGC 604 would be indistinguishable.
A constant M/L. Massive stars appear to be more concentrated toward the cluster center, see e.g., figure 16 in [Brandl et al. (1996)]. We cannot distinguish here whether this is related to the star formation process (i.e., massive stars form in the densest regions), or the result of mass segregation. At any rate, the most massive stars dominate the light profile, and their concentration around the cluster center produces a gradient in M/L.
While the above method certainly allows for rough estimates of dynamical cluster masses, the combined uncertainties make it very difficult to provide sufficient evidence for anomalous IMFs in galaxies beyond the Local Group.
4 Method III: mid-IR fine-structure line ratios
Luminous starbursts are often significantly extincted and require observations at longer wavelengths. The mid-IR spectral range covered by ISO-SWS and Spitzer-IRS provides a wealth of spectral diagnostic features, although the spectra contain only spatially integrated information.
4.1 The basic principle
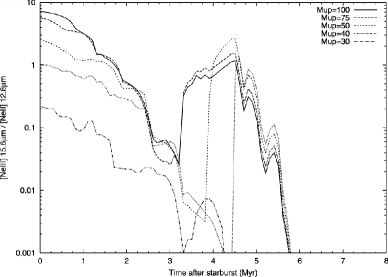
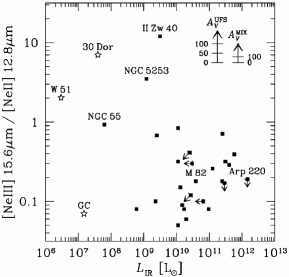
One of the most common diagnostics are the forbidden fine structure lines [Ne III]m and [Ne II]m. With an ionization potential of 63.45 eV, [Ne III] indicates the presence of early-type O-stars, while [Ne II] with only 40.96 eV can be excited by less massive OB stars. Thus, the ratio of [Ne III]/[Ne II] is a very sensitive measure of the strength of the radiation field, which depends on the presence of the most massive stars and on the age of the starburst, as illustrated in Figure 5.
4.2 Problem: the model-observation discrepancy
The observed line ratios (Figure 5) differ significantly from the values predicted by the models such as STARBURST99/CLOUDY [(Leitherer et al. 1999)]. While there seems to be a better agreement for low-metallicity galaxies and dwarf systems, the observed ratios of more luminous starburst galaxies are often more than an order of magnitude lower than the theoretical predictions.
Among the possible explanations being discussed is strong dependency on metallicity, a general lack of the most massive stars in intense bursts, or a larger age spread with complicated morphology of the starburst region. Higher extinction can be ruled out as it would even increase the discrepancy (Figure 5). [Rigby & Rieke (2004)] proposed that very massive stars in dense and metal-rich starbursts spend a significant fraction of their lifetime embedded in ultra-compact HII regions that prevent the formation of classical HII regions. Hence, the finestructure lines expected from those embedded massive stars cannot even form, and the spectra would be dominated by the lower excitation [Ne II] line produced by the surrounding, less massive stars.
In summary, mid-IR finestructure line diagnostics are an elegant and intriguing method to infer the relative amount of massive stars in a starburst. However, given the complexity of a real starburst region and the model uncertainties claims of anomalous IMFs, just based on line ratios, need to be taken with care. This is clearly an area where significant improvements can be expected from Spitzer-IRS observations.
References
- [Andersen (2004)] M. Andersen 2004, PhD thesis, Potsdam
- [(Andersen, Brandl & Zinnecker 2004)] M. Andersen, B.R. Brandl & H. Zinnecker 2004, in preparation
- [Brandl et al. (1996)] B.R. Brandl et al. 1996, ApJ, 466, 254
- [(Brandl et al. 2005)] B.R. Brandl et al. 2005, in “Starbursts – from 30 Doradus to Lyman break galaxies”, Cambridge
- [(Churchwell 1997)] E. Churchwell 1997, ApJ, 479, 59
- [(Kroupa & Boily 2002)] P. Kroupa & C.M. Boily 2002, MNRAS, 336, 1188
- [(Lamers, Snow & Lindholm 1995)] H.J.G.L.M. Lamers, Th.P. Snow & D.M. Lindholm 1995, ApJ, 455, 269
- [(Leitherer et al. 1999)] C. Leitherer et al. 1999, ApJS, 123, 3
- [Mengel et al. (2002)] S. Mengel et al. 2002, A & A, 383, 137
- [Palla & Stahler (1999)] F. Palla & S.W. Stahler 1999, ApJ, 525, 772
- [Portegies Zwart et al. (1999)] S.F. Portegies Zwart et al. 1999, A & A, 348, 117
- [Rigby & Rieke (2004)] J.R. Rigby & G.H. Rieke 2004, ApJ, 606, 237
- [Salpeter (1955)] E.E. Salpeter 1955, ApJ, 123, 666
- [Siess et al. (2000)] L. Siess, E. Dufour & M. Forestini 2000, A & A, 358, 593
- [Sirianni et al. (2000)] M. Sirianni et al. 2000, ApJ, 533, 203
- [Smith & Gallagher (2001)] L.J. Smith & J.S. Gallagher 2001, MNRAS, 326, 1027
- [Thornley et al. (2000)] M.D. Thornley et al. 2000, ApJ, 539, 641