Spectroscopic confirmation of high-redshift supernovae with the ESO VLT ††thanks: Based on observations obtained at the European Southern Observatory using the ESO Very Large Telescope on Cerro Paranal (ESO programs 265.A-5721(A), 67.A-0361(A), 267.A-5688(A), 169.A-0382(A) and (B)). Based in part on data collected at the Subaru Telescope, which is operated by the National Astronomical Observatory of Japan.,††thanks: Figures A.1 to A.39 are only available in electronic form via http://www.edpsciences.org.
We present VLT FORS1 and FORS2 spectra of 39 candidate high-redshift supernovae that were discovered as part of a cosmological study using Type Ia supernovae (SNe Ia) over a wide range of redshifts. From the spectra alone, 20 candidates are spectrally classified as SNe Ia with redshifts ranging from to . Of the remaining 19 candidates, 1 might be a Type II supernova and 11 exhibit broad supernova-like spectral features and/or have supernova-like light curves. The candidates were discovered in 8 separate ground-based searches. In those searches in which SNe Ia at were targeted, over 80% of the observed candidates were spectrally classified as SNe Ia. In those searches in which SNe Ia with were targeted, 4 candidates with were spectrally classified as SNe Ia and later followed with ground and space based observatories. We present the spectra of all candidates, including those that could not be spectrally classified as supernova.
Key Words.:
supernovae:general – cosmology:observations1 Introduction
Over the past decade, observations of SNe Ia have played a leading role in measuring the expansion history of the Universe and in constraining cosmological parameters. It was through these observations that we discovered that the expansion is currently accelerating and that the Universe is presently dominated by an unknown form of dark energy with a negative equation of state (Perlmutter et al. Perlmutter98 (1998); Garnavich et al. Garnavich98 (1998); Schmidt et al. Schmidt98 (1998); Riess et al. Riess98 (1998); Perlmutter et al. Perlmutter99 (1999); Tonry et al. Tonry03 (2003); Knop et al. Knop03 (2003), Riess et al. Riess04 (2004); Barris et al. Barris04 (2004); for a review, see Perlmutter and Schmidt Perlmutter03 (2003)).
When these results are combined with the results that have been derived from the fluctuations in the cosmic microwave background (Jaffe et al. Jaffe01 (2001); Bennett et al. Bennett03 (2002); Spergel et al. Spergel03 (2003)), the properties of massive clusters (Allen, Schmidt & Fabian Allen02 (2002); Borgani et al. Borgani01 (2001)) and the large scale structure of galaxies (Hawkins et al. Hawkins02 (2003)), a picture of a flat Universe dominated by dark energy emerges.
Considerable effort has been directed towards extending the redshift range over which SNe Ia are observed. The Hubble diagram of SNe Ia with is degenerate to a linear combination of and . Hence, an independent determination of these two parameters from SNe Ia at is not possible. However, observations of SNe Ia over a wide range of redshifts and, in particular, very distant () SNe Ia can break this degeneracy (Goobar and Perlmutter Goobar95 (1995)). With this aim in mind, and following a highly successful pilot search (Aldering Aldering (1998)), the Supernova Cosmology Project (SCP) started a program to discover, spectrally confirm and photometrically monitor a substantial number of SNe Ia with redshifts beyond one.
In this paper, we present VLT FORS1 and FORS2 spectra of 39 candidate high redshift supernovae. We present all spectra, including those spectra for which a secure spectroscopic classification could not be made. The results of the photometric follow-up, the derived apparent magnitudes and the implications these measurements have for cosmology will be reported elsewhere.
2 Observations
2.1 Search and discovery
The candidates discussed in this paper were discovered during 8 separate, but not fully independent, high-redshift supernovae searches. The searches were divided into 4 observing campaigns that occurred during the Northern Springs of 2000, 2001 and 2002 and the Northern Fall of 2002. The observing campaigns, the months during which data were taken and the telescopes used in the searches are listed in Table 1.
| Campaign | Months | Instrument/Telescope | Search Number | Search type | Prefix |
|---|---|---|---|---|---|
| Spring 2000 | April/May | CFHT12k/CFHT | 1 | Standard | C00 |
| Spring 2001 | March/April | CFHT12k/CFHT | 2 | Standard | S01 |
| March/April | MOSAICII/CTIO 4m Blanco | 3 | Standard | S01 | |
| Spring 2002 | March to June | CFHT12k/CFHT | 4 | Rolling | C02 |
| April/May | MOSAICII/CTIO 4m Blanco | 5 | Standard | T02 | |
| March/April | Suprime-Cam/Subaru | 61 | Back-to-back | S02 | |
| April/May | Suprime-Cam/Subaru | 71 | Back-to-back | S02 | |
| Fall 2002 | October/November | Suprime-Cam/Subaru | 82 | Standard with additional | SuF02 |
| wide-field monitoring |
1 Searches 6 and 7 were part of the Subaru Deep Field Project (Kodaira et al. Kodaira03 (2003)).
2 Search 8 was part of the Subaru XMM/Newton Deep Survey (Sekiguchi et al. in preparation)
Following the search and discovery techniques described in Perlmutter et al. (Perlmutter95 (1995), Perlmutter97 (1997), Perlmutter99 (1999)), the searches generally consisted of 2 to 3 nights of imaging to take reference images (images in which supernovae had not yet appeared), followed 3 to 4 weeks later by an additional 2 to 3 nights of imaging to take search images (images with the supernovae). In this paper, we refer to this type of search as a “standard” search, and searches 1,2, 3 and 5 were of this type. Searches 4, 6, 7 and 8, were a variation on this theme.
The Spring 2002 CFHT search (search 4 in Table 1), for example, was a “rolling” search, where images were taken once every few nights during a two week period. This was followed one, two and three months later by similar observations on the same fields. In this way, the search images of one month become the reference images of a later month, and, since images of the search fields are taken several times in any one month, one automatically gets a photometric time series without having to schedule follow-up observations separately, as one must do in a standard search.
The Subaru searches during the Spring and Fall of 2002 (searches 6, 7 and 8 in Table 1) also differed from the standard search. Searches 6 and 7 were “back-to-back” searches, in which the search images of the first search (search 6)became the reference images for the second search (search 7). Search 8 was a standard search that was then immediately followed with additional observations with the same instrument and telescope. This search offered the advantage of allowing us to follow several candidates simultaneously, rather than following candidates individually, as is the case with the standard search.
The data were processed to find objects that had brightened and the most promising candidates were given an internal SCP name and a priority. The priority is based on a number of factors: the significance of the detection, the percentage increase in the brightness, the distance from the center of the apparent host, the brightness of the candidate and the quality of the subtraction. The candidates were then distributed to teams working at the Gemini, Keck, Paranal, and Subaru Observatories for spectroscopic confirmation. The distribution was handled centrally and was done according to the priority of the candidates, the results from data that had been taken during previous nights, the capability and availability of the instruments and the telescopes at each of the observatories and the weather conditions at the individual observatories at any one time. Hence, the factors that affect whether or not a candidate is observed at any one observatory are complex and such factors would have to be taken into account in any statistical analysis. Note that these searches for extremely high-redshift supernovae are in this way more complex than previous searches that have been reported in our previous papers.
A preliminary analysis of the spectroscopic data is done within a day of when the data are taken - a more careful analysis is done later. Only those candidates that are confirmed as SNe Ia are then scheduled for follow-up observations, which consist of photometric monitoring in at least two broad-band filters during the first two months immediately following the discovery and final reference images, which are taken about one year later. These data are used to measure the peak magnitudes, the light curve widths, which are used to correct the peak magnitudes, and the colours of the SNe Ia. In some searches, such as searches 4 and 8 in Table 1, the optical follow-up is integrated into the search.
The aim of the spectroscopic follow-up is not to confirm as many SNe Ia as possible, but to provide a number of spectrally classified SNe Ia (typically four SNe Ia per campaign) to be scheduled for HST and ground-based follow-up within one to two days of the end of the spectroscopic runs. Without exception, we succeeded in providing a sufficient number of SNe Ia for the follow-up.
We are presenting the spectra of all candidates that were observed with the ESO VLT, so there are a number of candidates that have only an internal SCP name. The SCP name consists of a prefix, which indicates at which telescope the candidate was discovered, and a running number. A list of prefixes is given in Table 1. The spectra of candidates that were not observed at the ESO VLT will be reported elsewhere.
2.2 Spectroscopic follow-up
The long slit spectroscopic modes of FORS1 and FORS2 (Appenzeller et al. Appenzeller98 (1998)) on the ESO VLT were used to observe high priority candidates. For the purpose of long-slit spectroscopy, FORS1 and FORS2 are very similar instruments. The principle difference is that the detector in FORS1 is a single 2kx2k Tektronix CCD, while the detector in FORS2 is a mosaic of two 2kx4k red-optimized MIT CCDs. The FORS2 detector is more sensitive than the FORS1 detector, especially at red wavelengths. The availability of the red optimized CCDs in FORS2 after March 2002 made it possible to observe and confirm candidates at .
The dates during which the VLT spectroscopic observations took place and the redshift interval over which SNe Ia were targeted for VLT follow-up are listed in Table 2.
| Campaign | Instrument and Telescope | Dates | Observing Mode | Redshift Interval |
|---|---|---|---|---|
| Spring 2000 | FORS1 on Antu (VLT-UT1) | 12 May 2000 | Service | |
| Spring 2001 | FORS1 on Antu (VLT-UT1) | 21-22 April 2001 | Visitor | |
| 27 April and 28 May 2001 | Service | |||
| Spring 2002 | FORS2 on Yepun (VLT-UT4) and | April-August 2002 | Service | |
| FORS1 on Melipal (VLT-UT3) | 11-12 May 2002 | Service | ||
| Fall 2002 | FORS2 on Yepun (VLT-UT4) | 7-11 November 2002 | Service |
Three grisms (300V, 300I and 600z) and two slit widths (0.7 and 1.0 arc seconds) were used for the observations. In general, the grism was chosen to match the expected redshift of the candidate and the slit was matched to the seeing. The 300V grism was used with the GG435 order-sorting filter and the 300I and 600z grisms were used with the OG590 order-sorting filter.
Nearly all targets were acquired in the same way. The slit was placed through the candidate and a relatively bright and nearby pivot star. There were only three exceptions: SuF02-026 and SN 2002lc were observed together and SN 2000fr was acquired directly. The observational details are listed in Table 3. Generally speaking, three exposures with small offsets along the slit were taken for each candidate. Exceptions occurred when observations were aborted because we thought that we had sufficient data to identify the candidate or when we integrated longer for the fainter candidates.
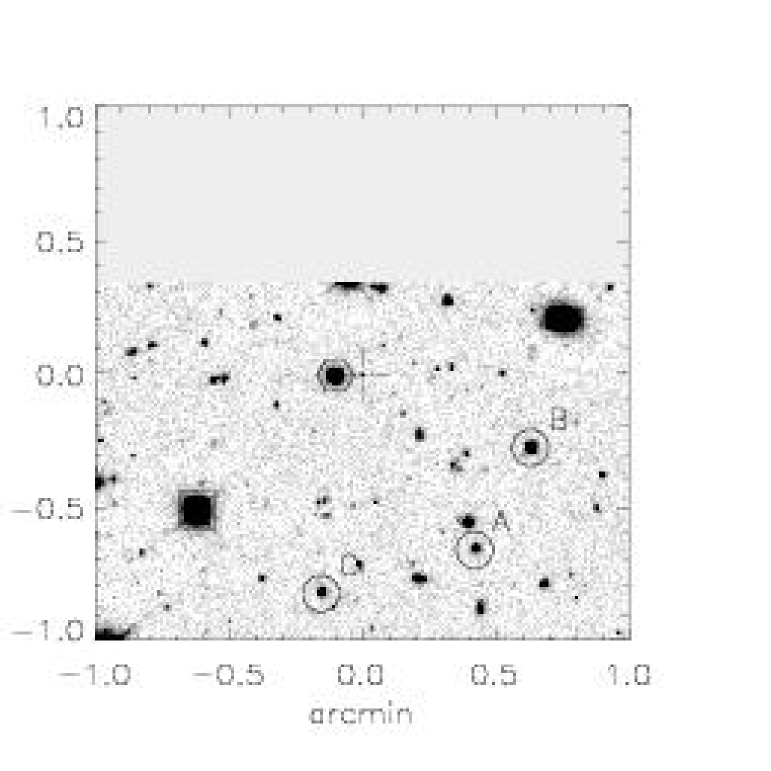
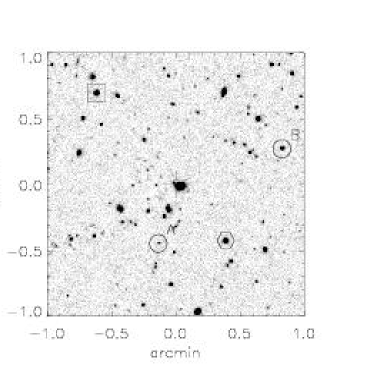
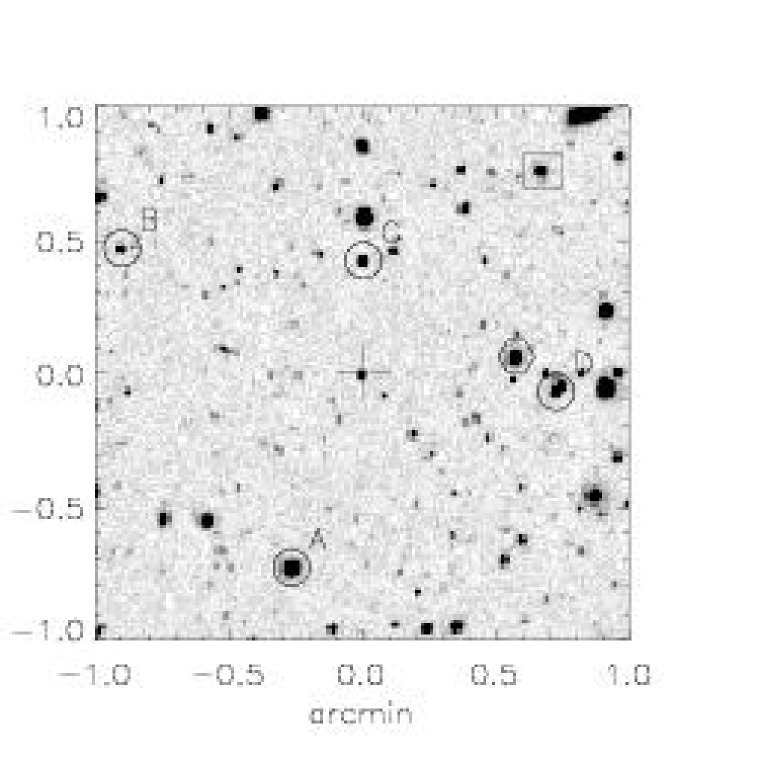
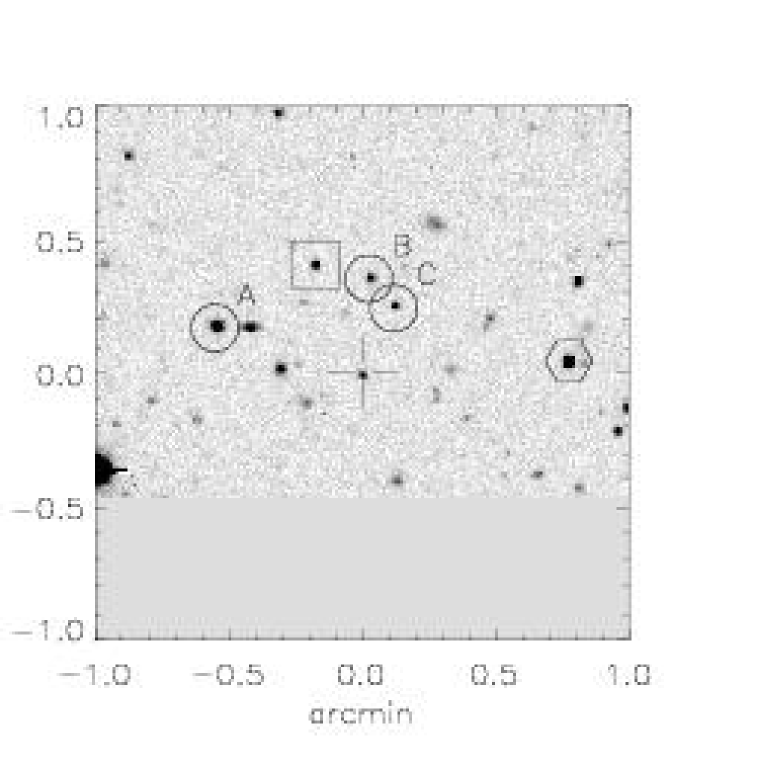
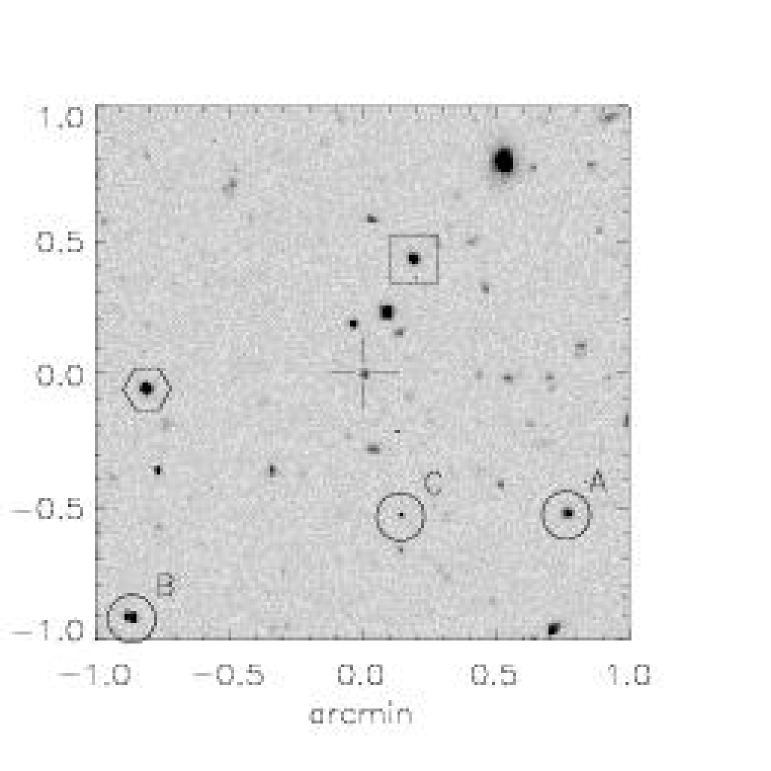
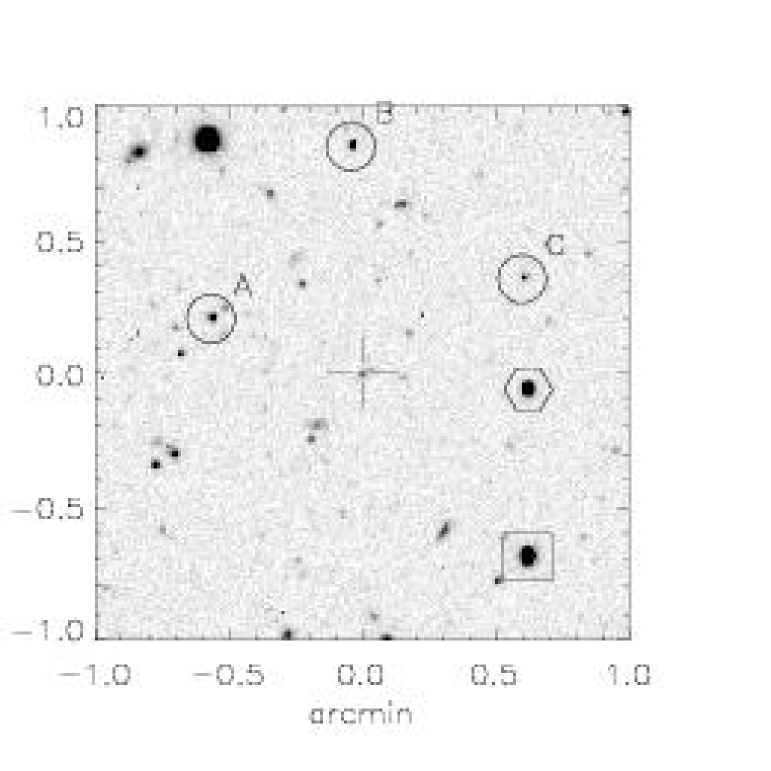
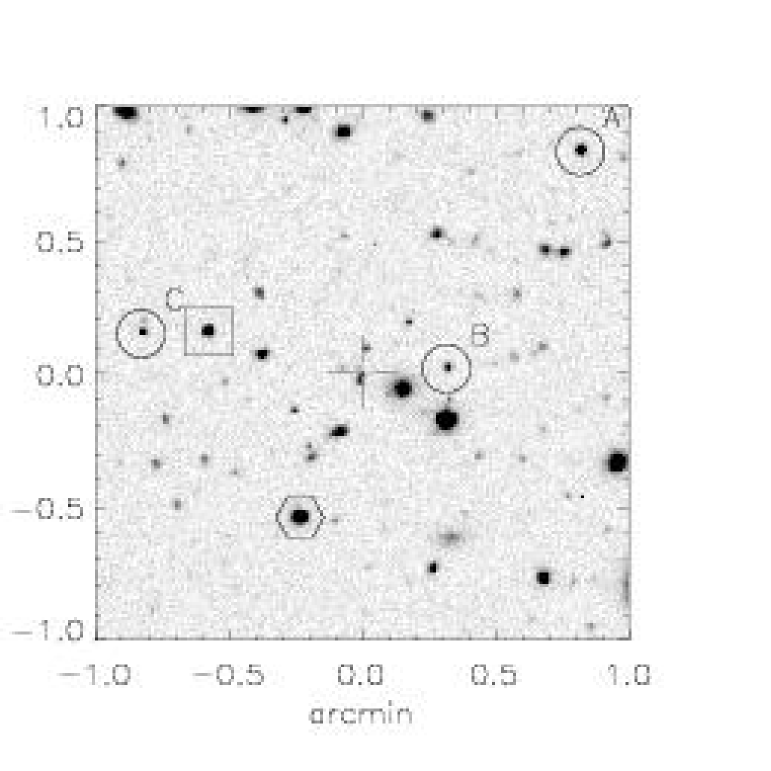
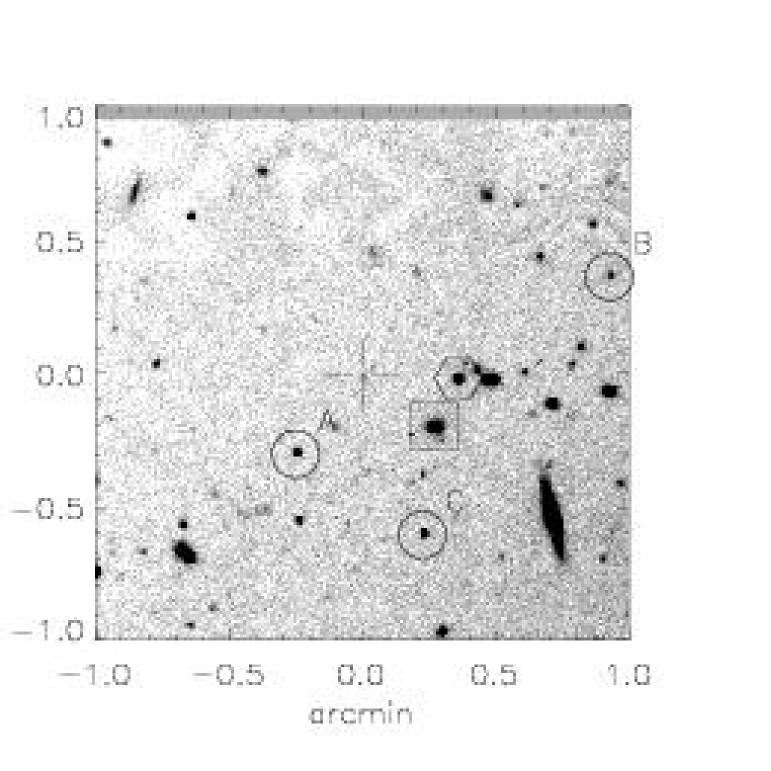
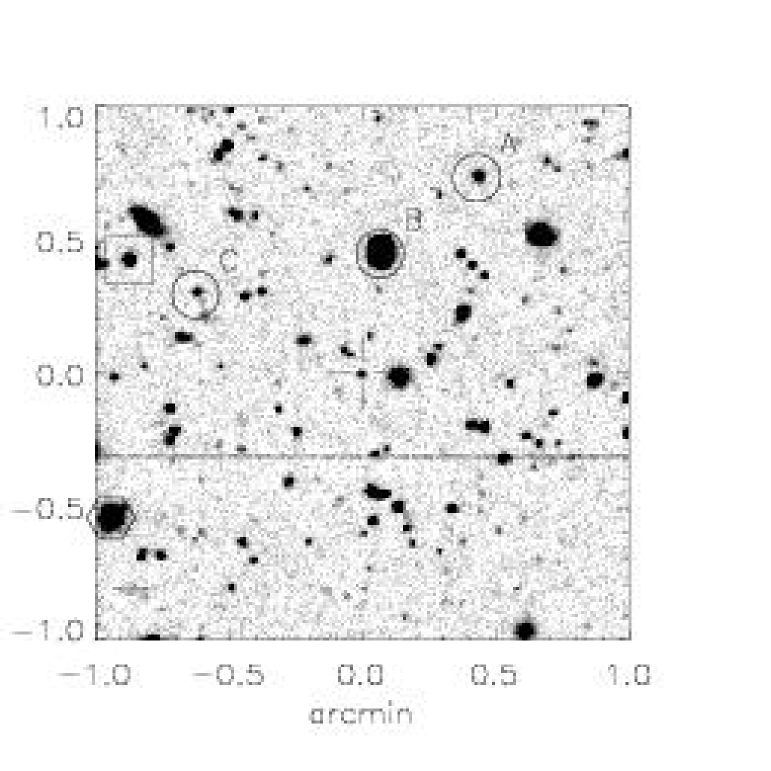
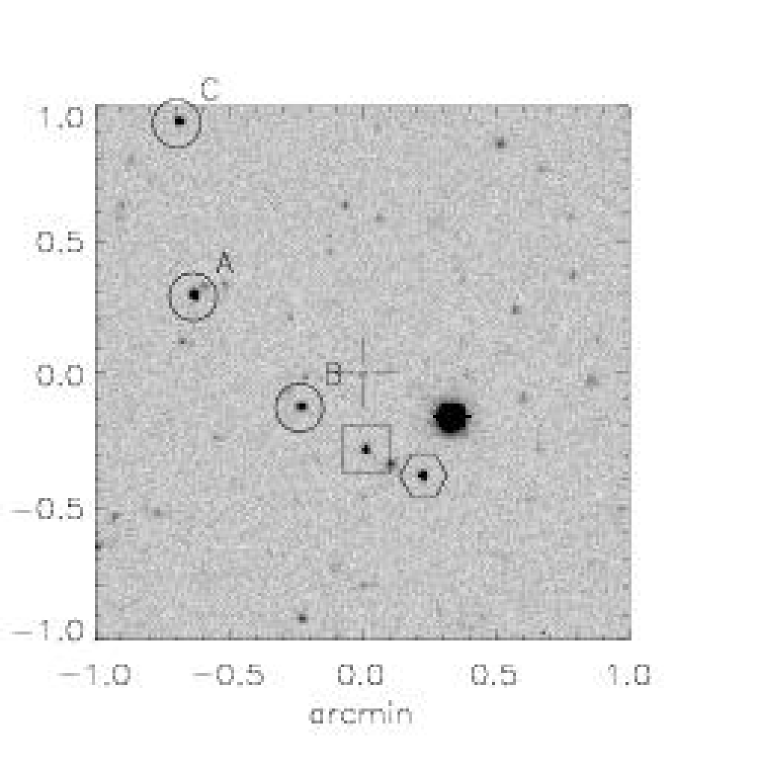
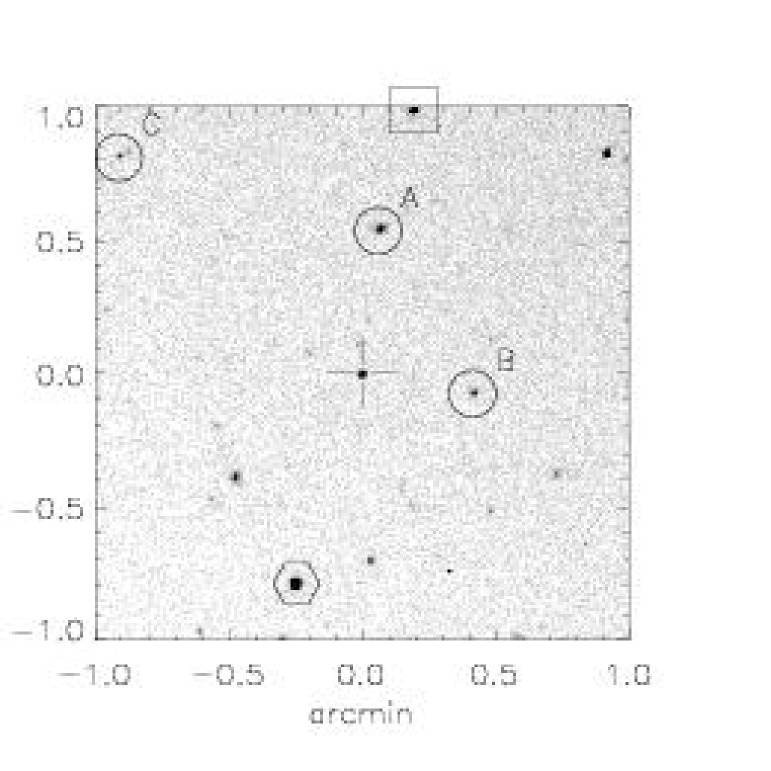
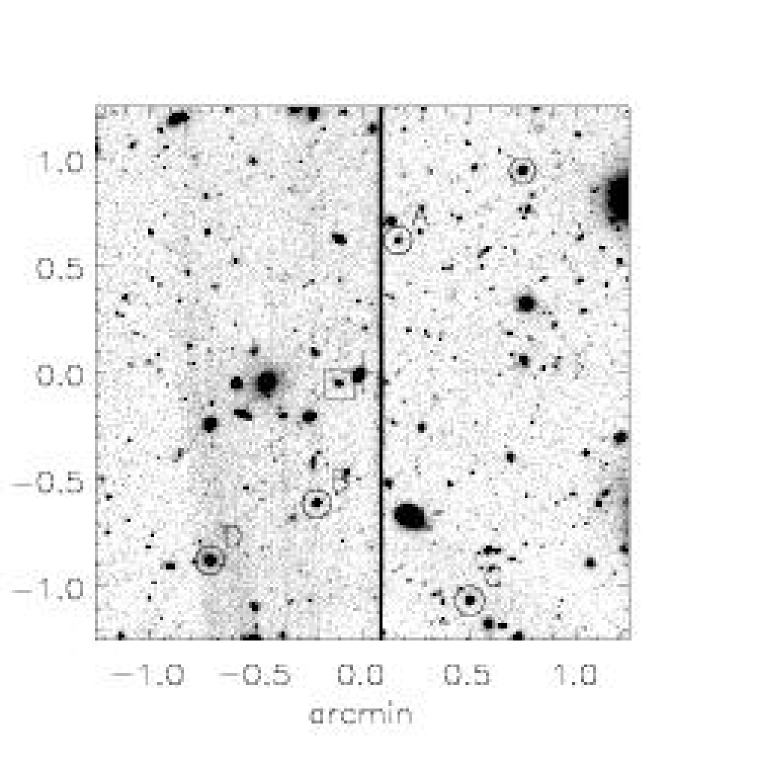
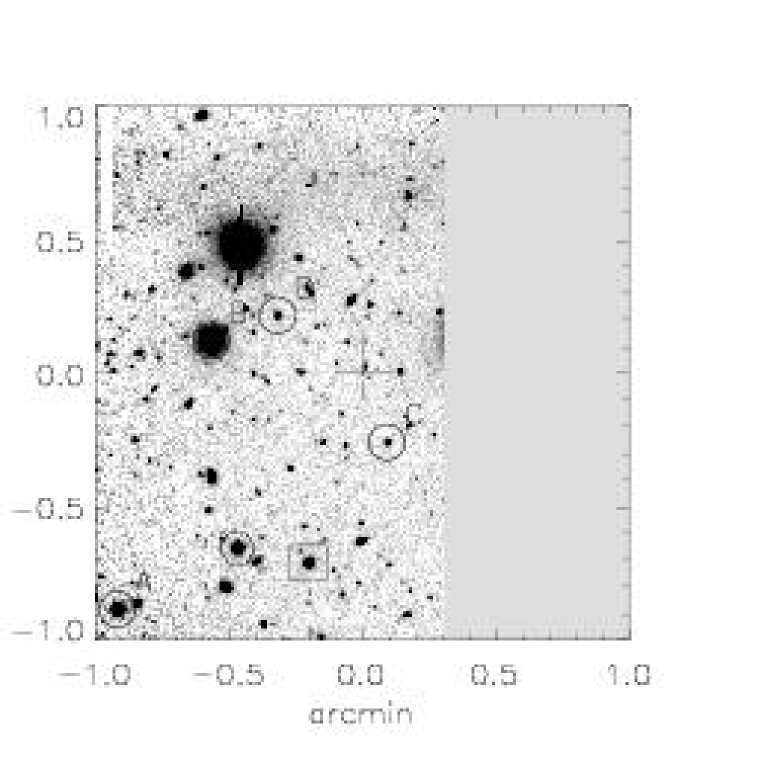
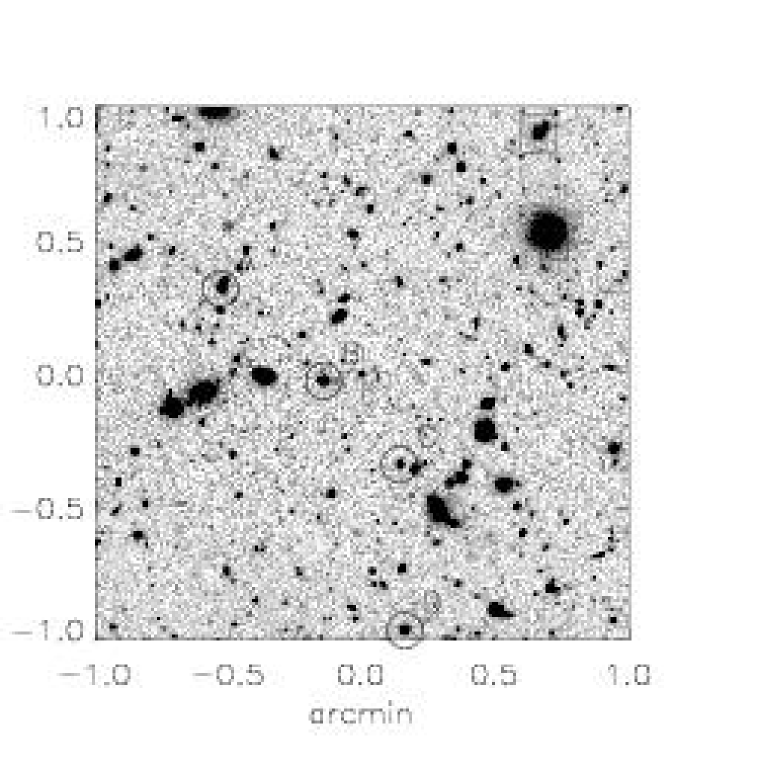
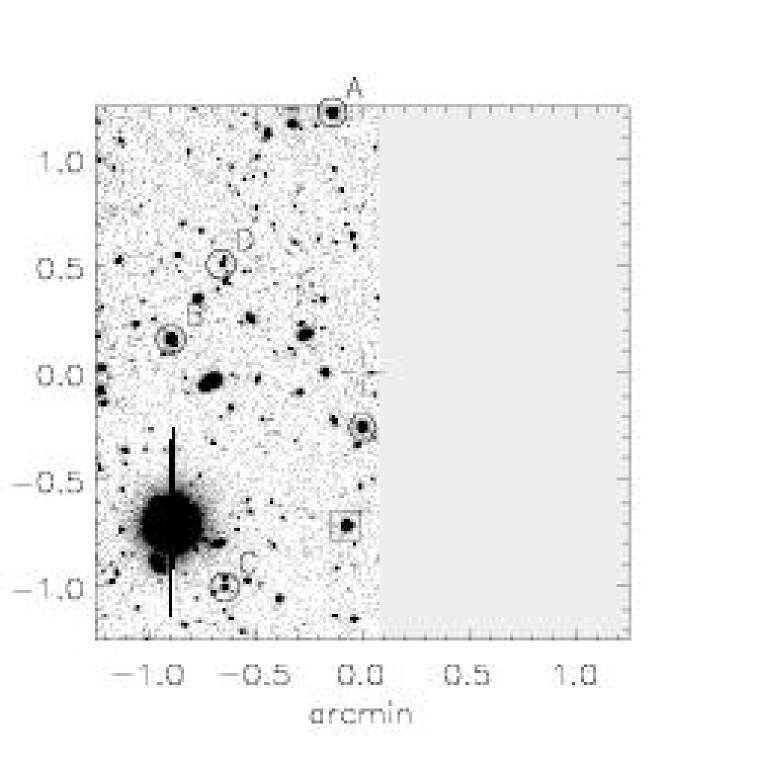
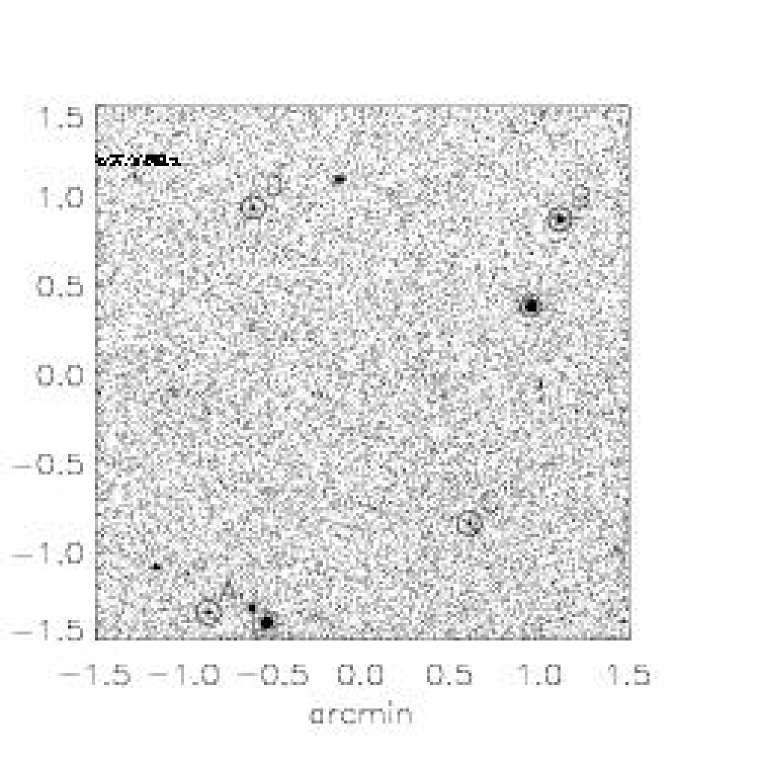
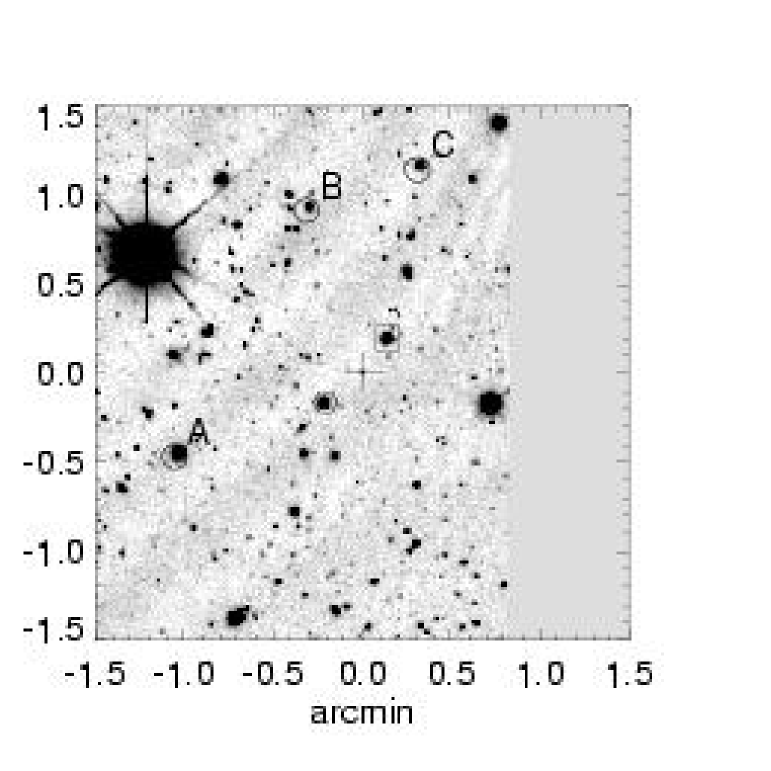
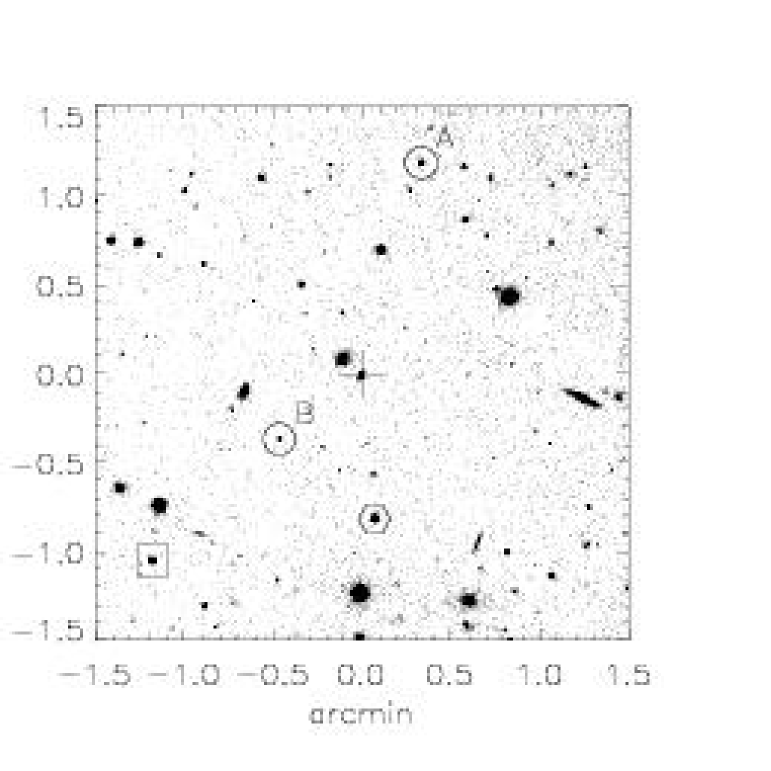
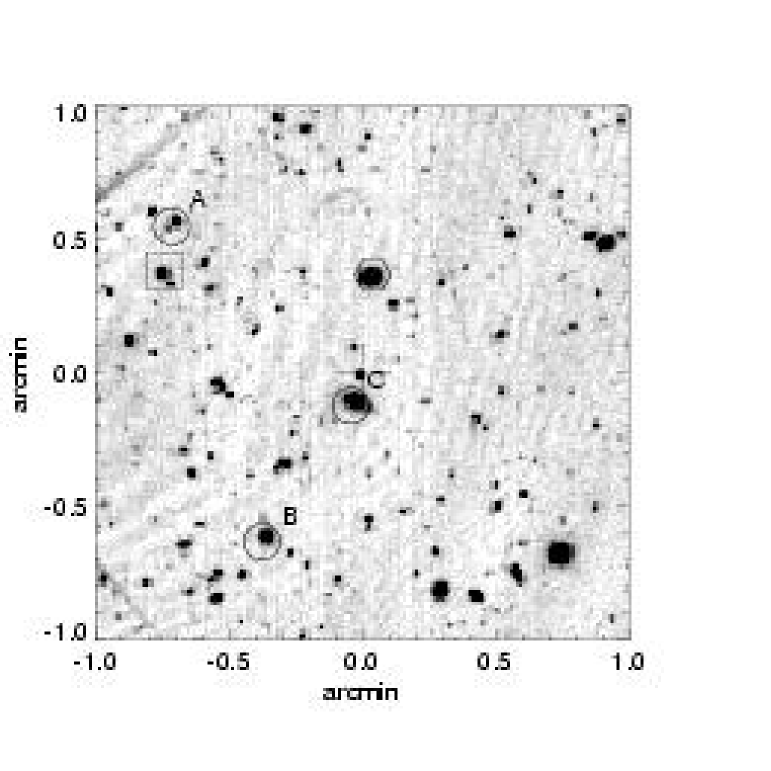
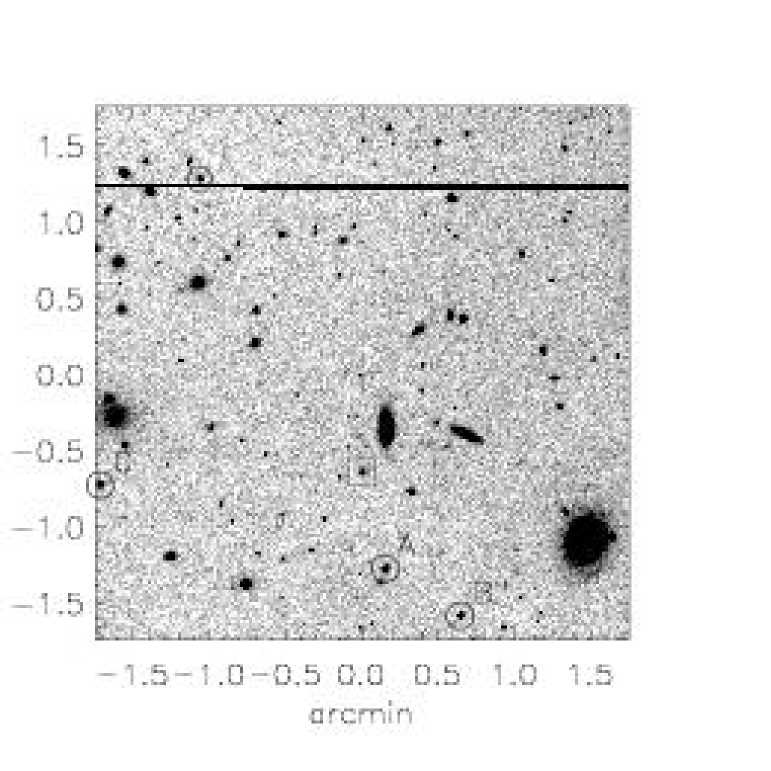
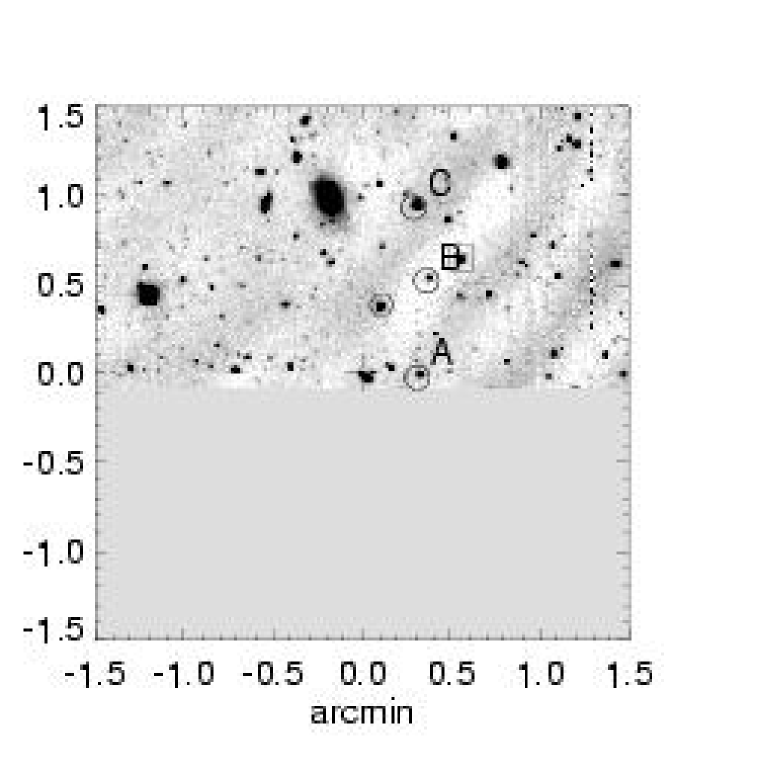
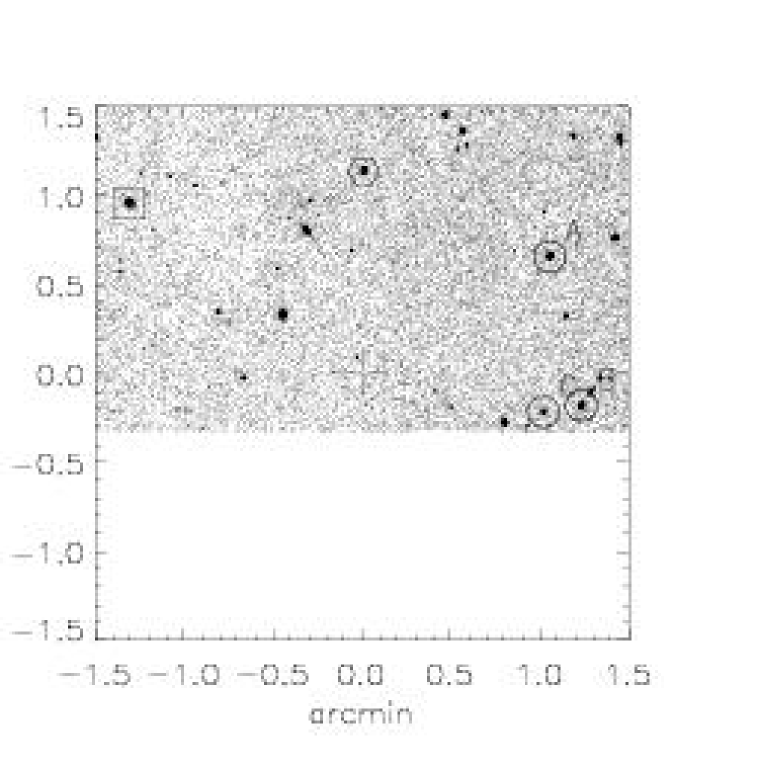
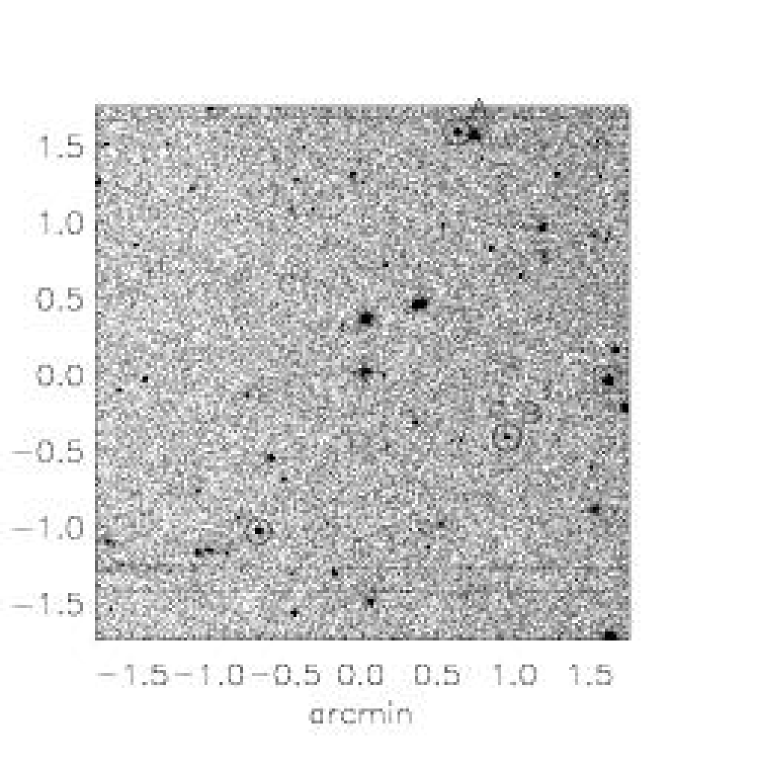
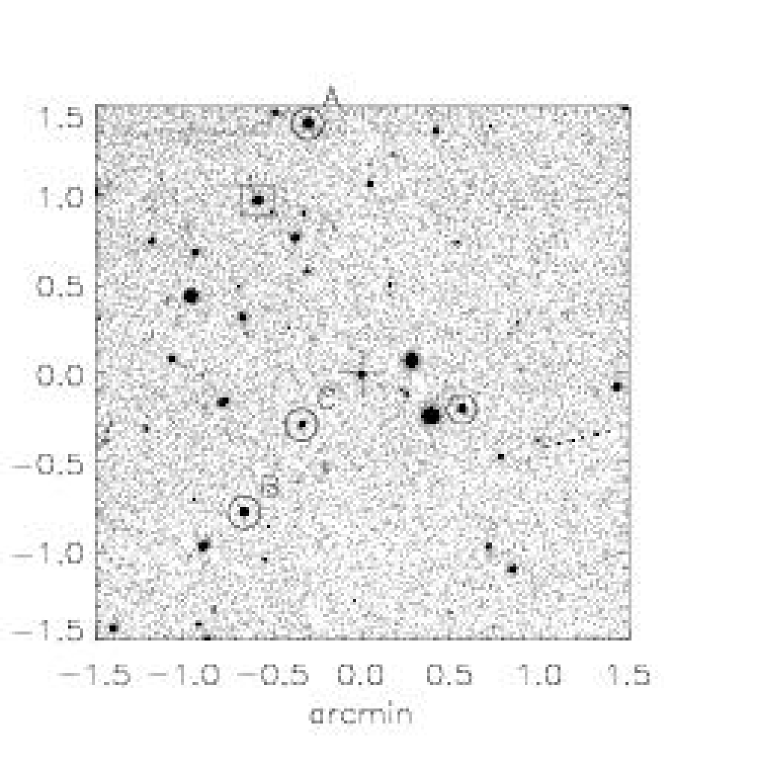
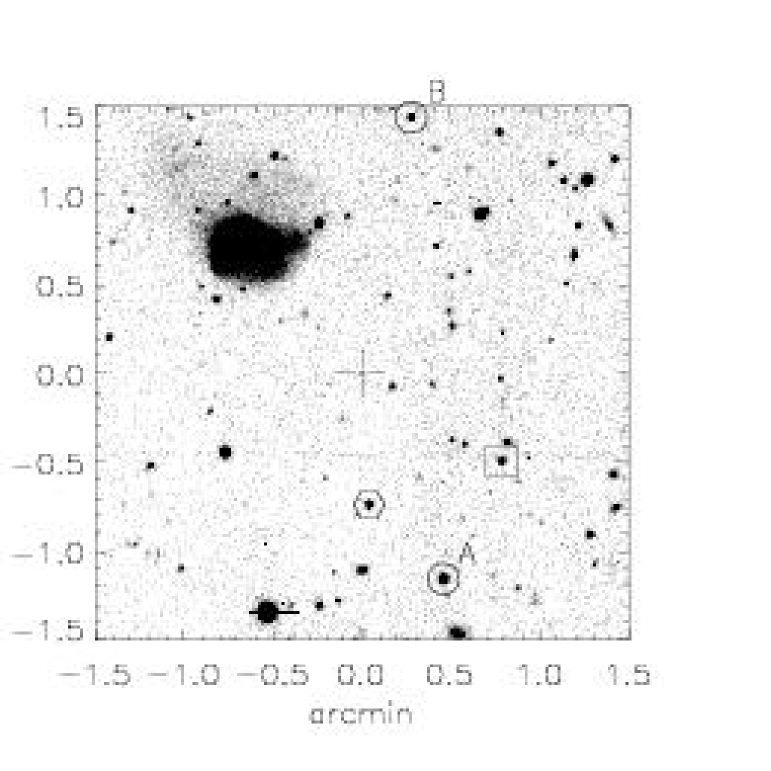
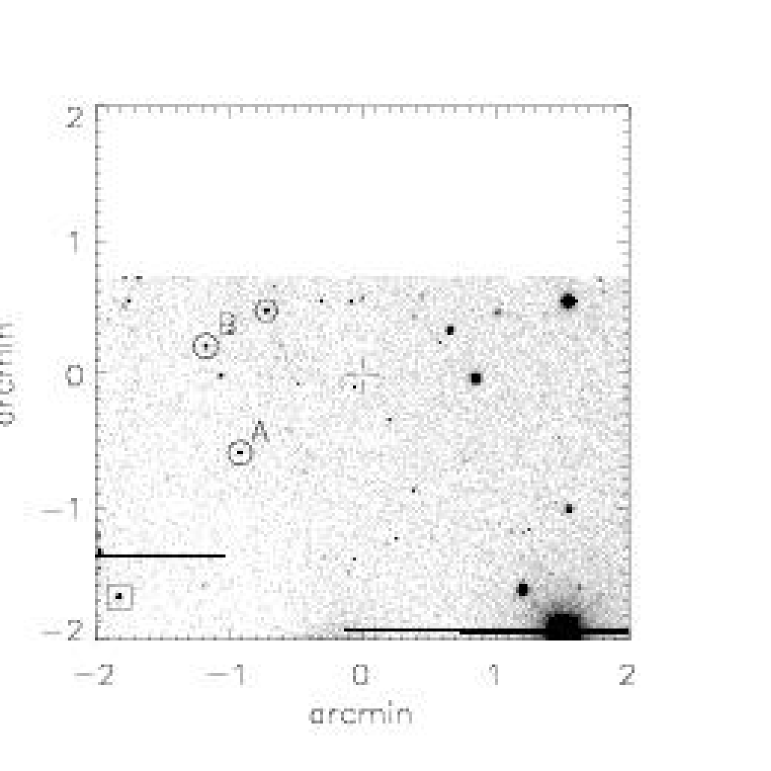
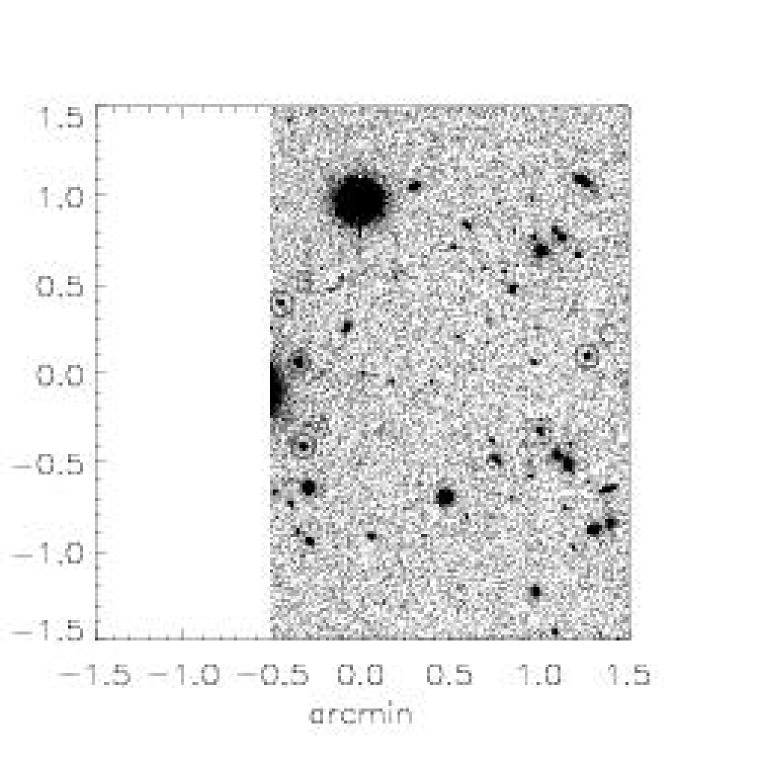
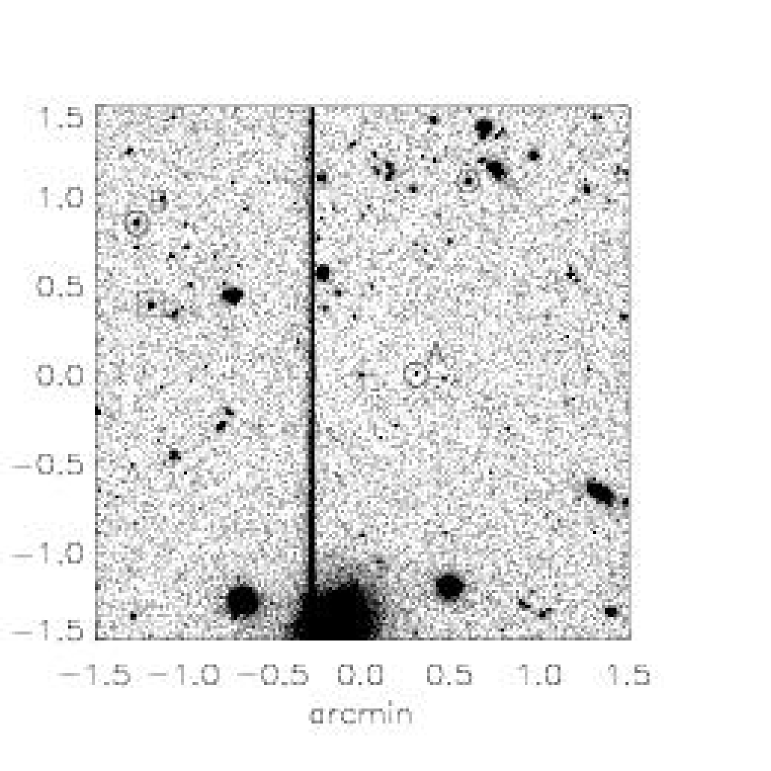
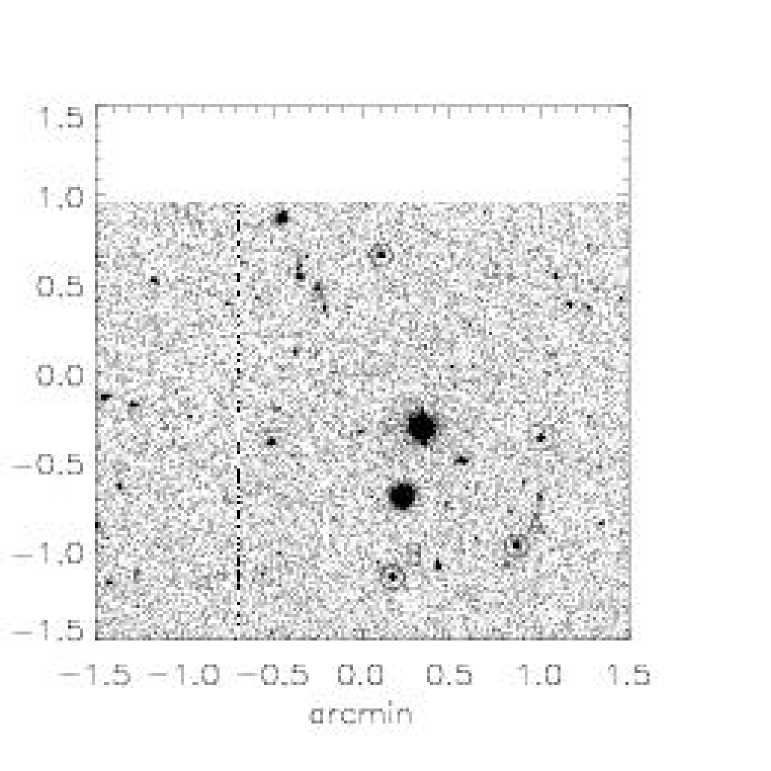
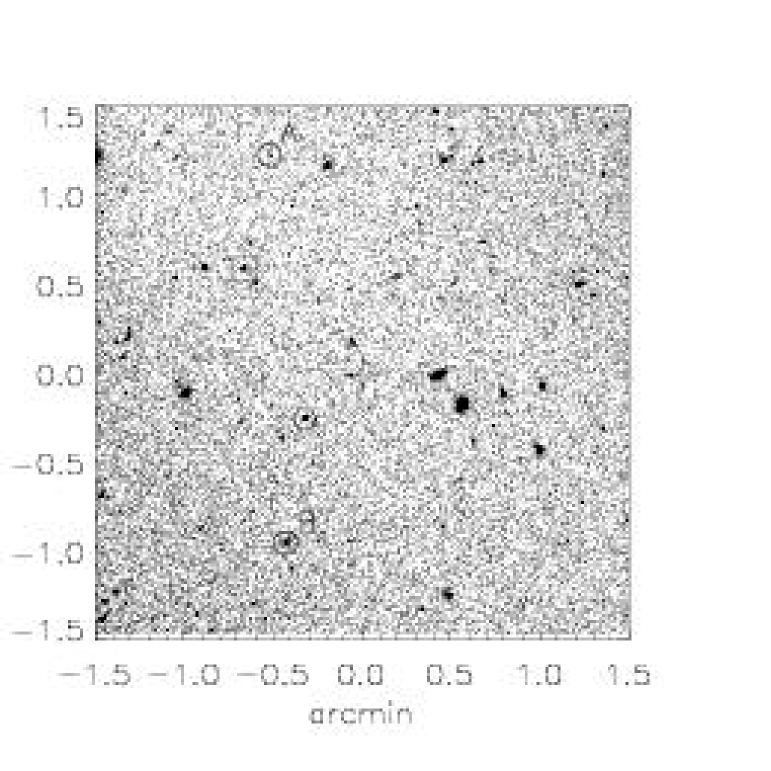
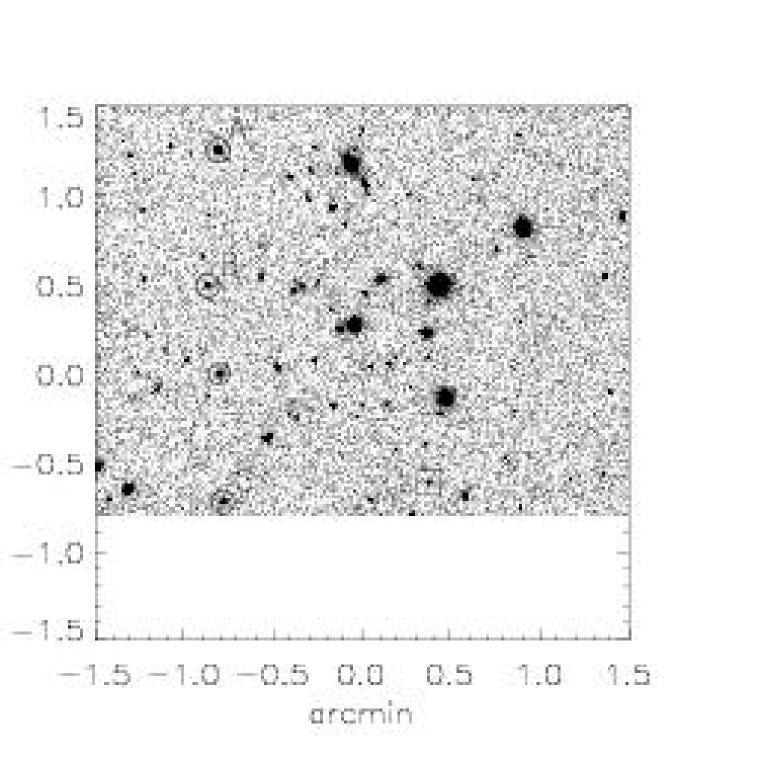
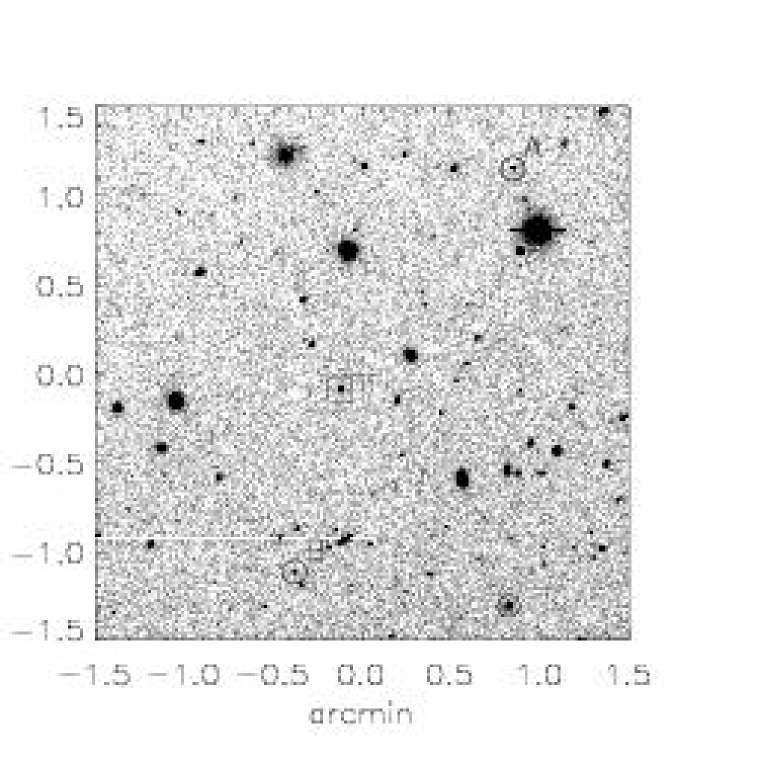
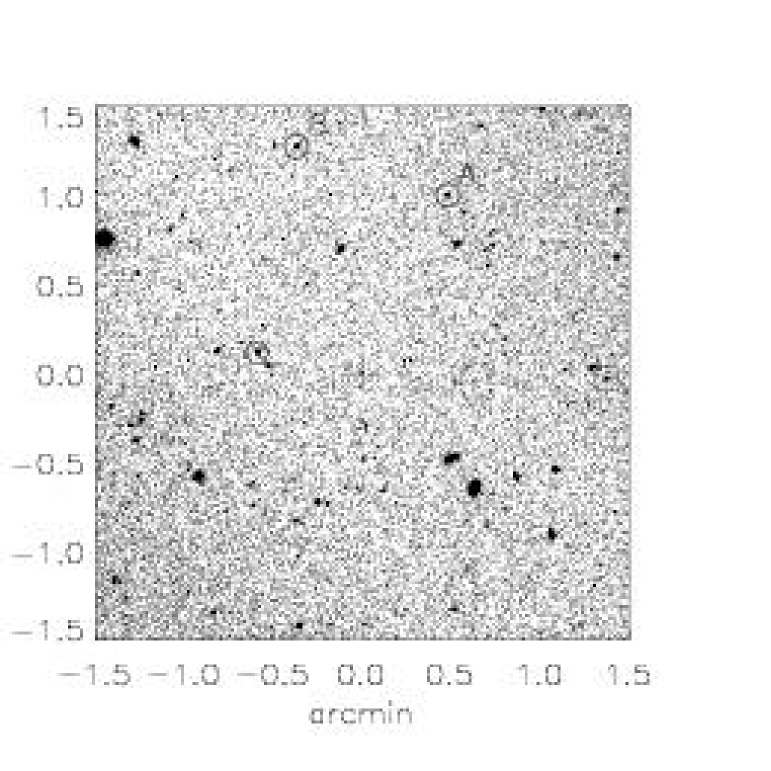
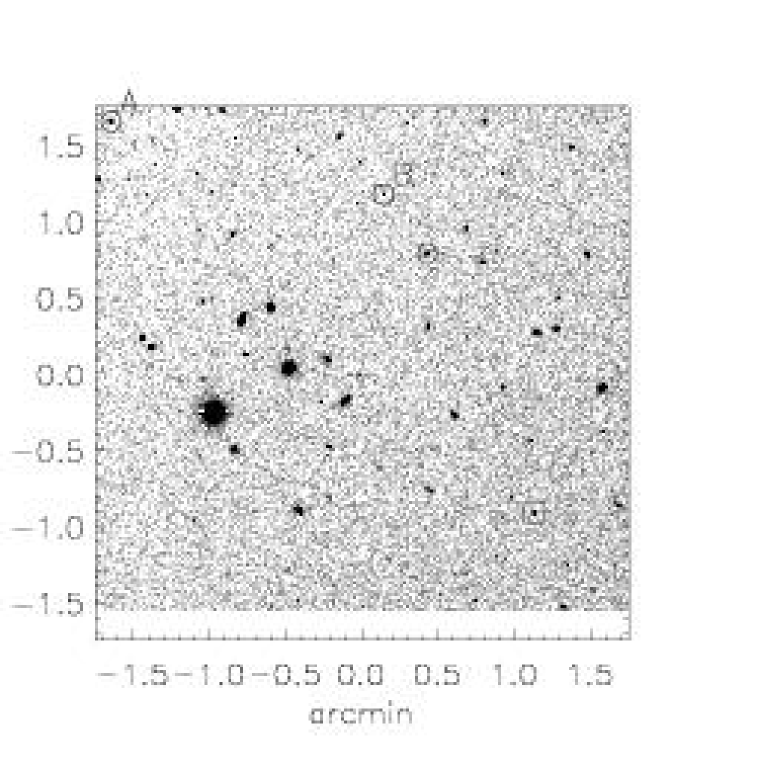
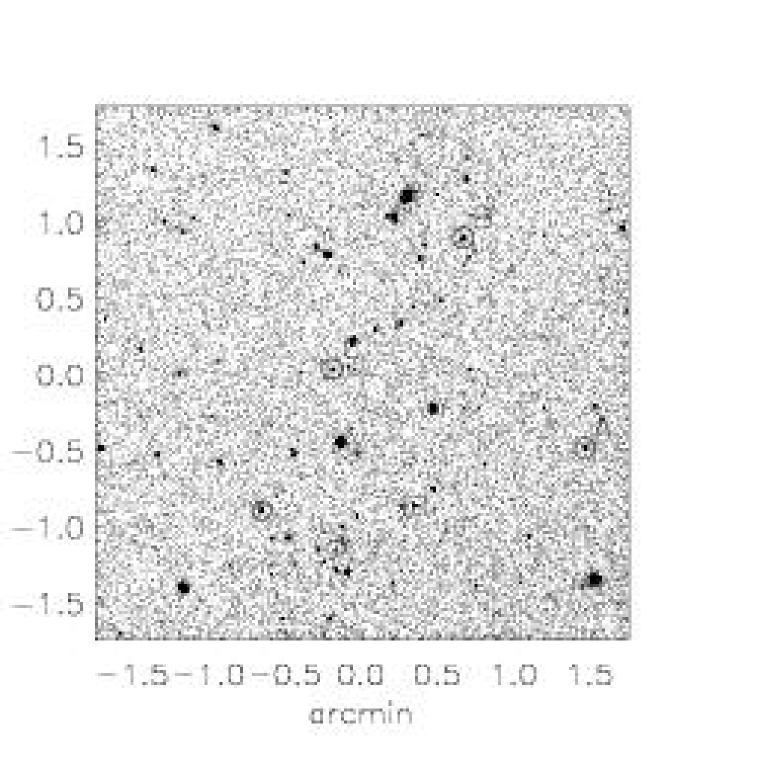
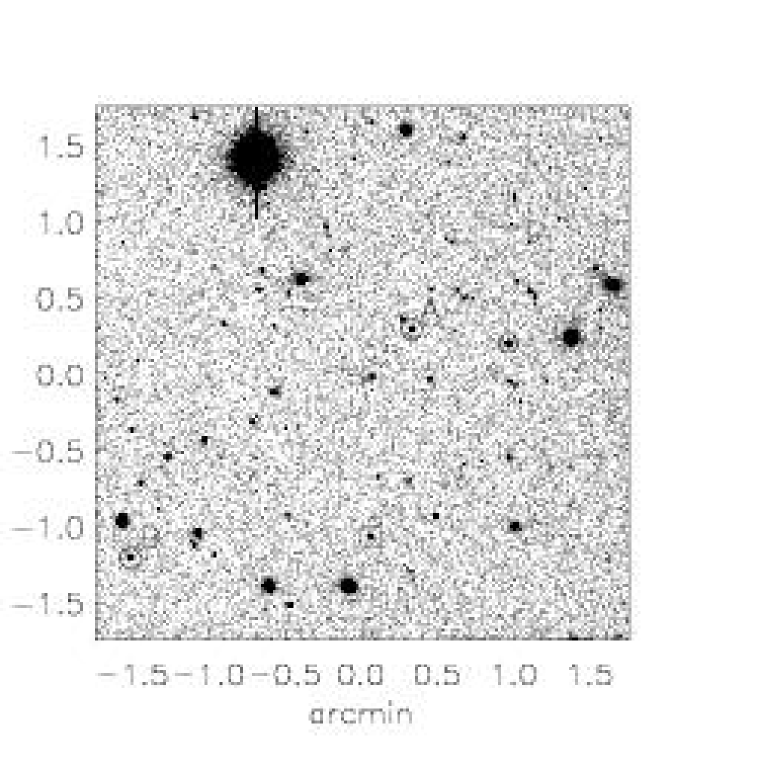
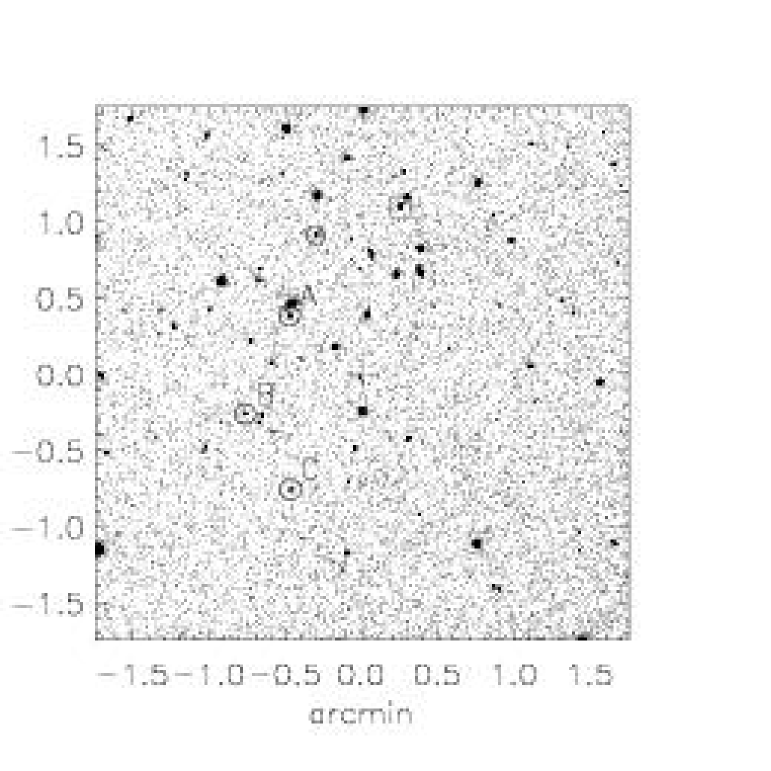
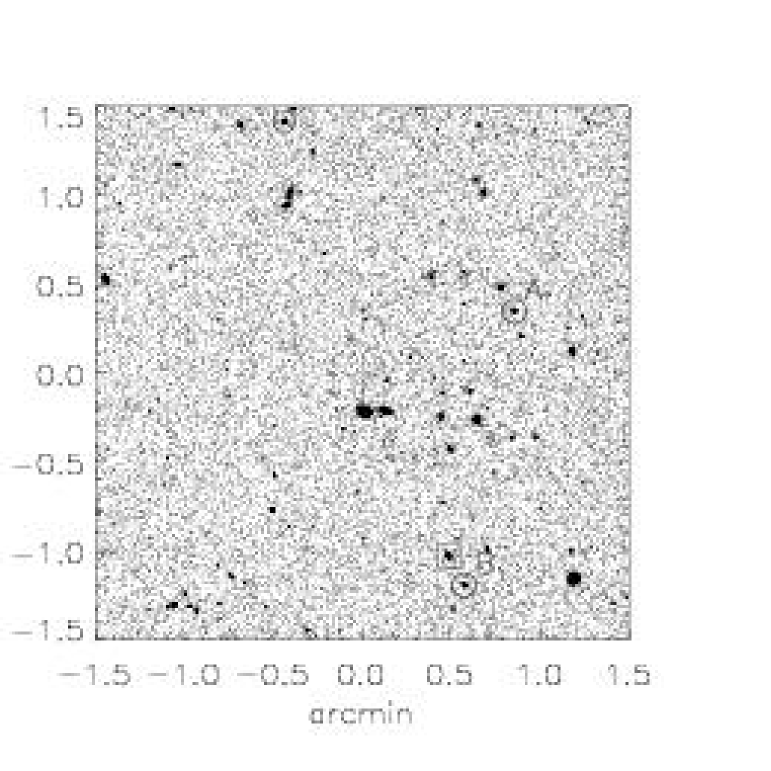
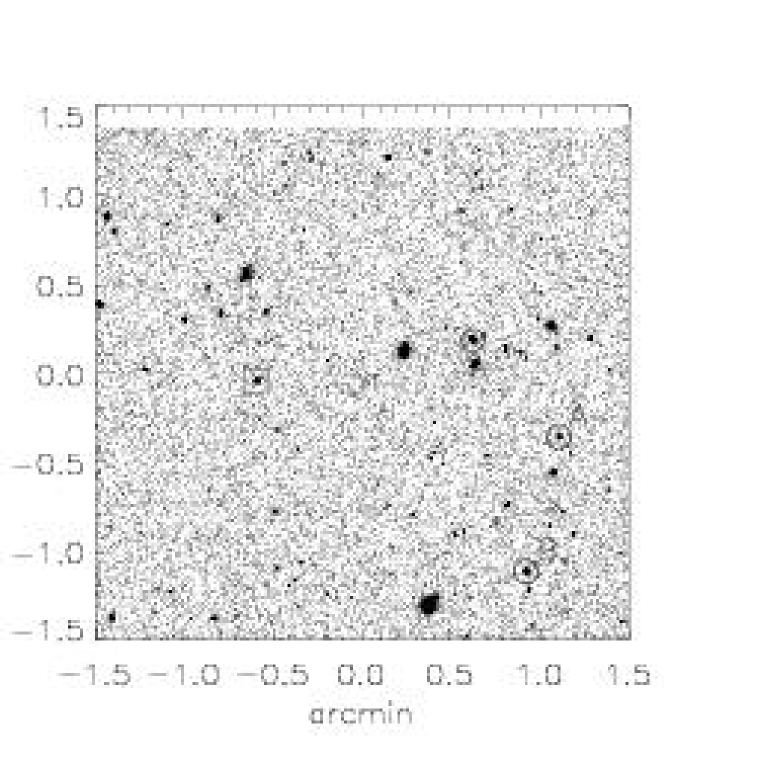
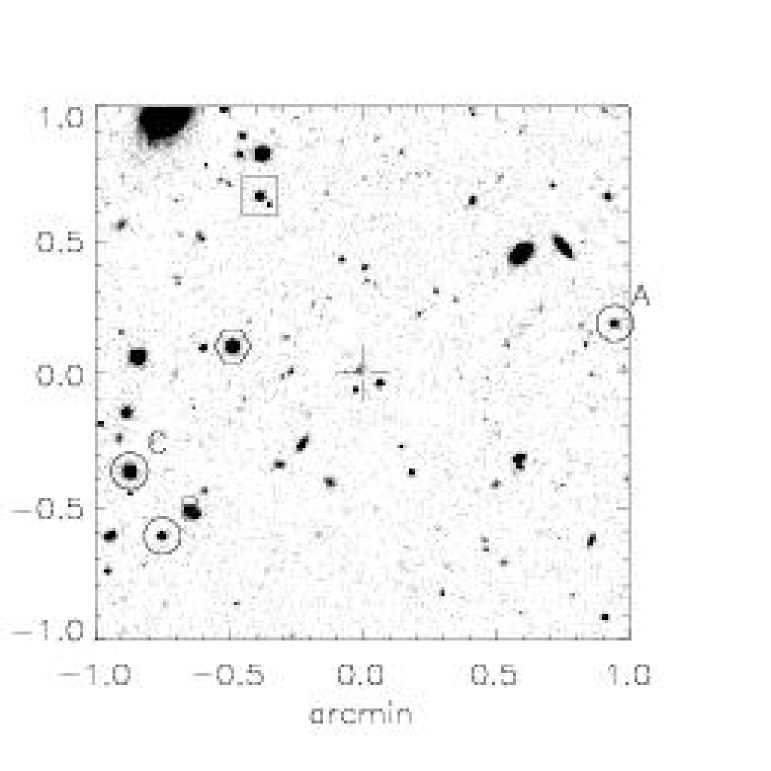
Finding charts showing both the candidate and the pivot star are displayed in Fig. 1 and in Figs. 5 to 43. Candidates are marked with a cross and bright pivot stars are marked with either a box or a hexagon. Fainter pivot stars are circled and labelled alphabetically. The pivot star that was used during the acquisition is recorded in Table 3. In all finding charts, North is up and East is to the left.
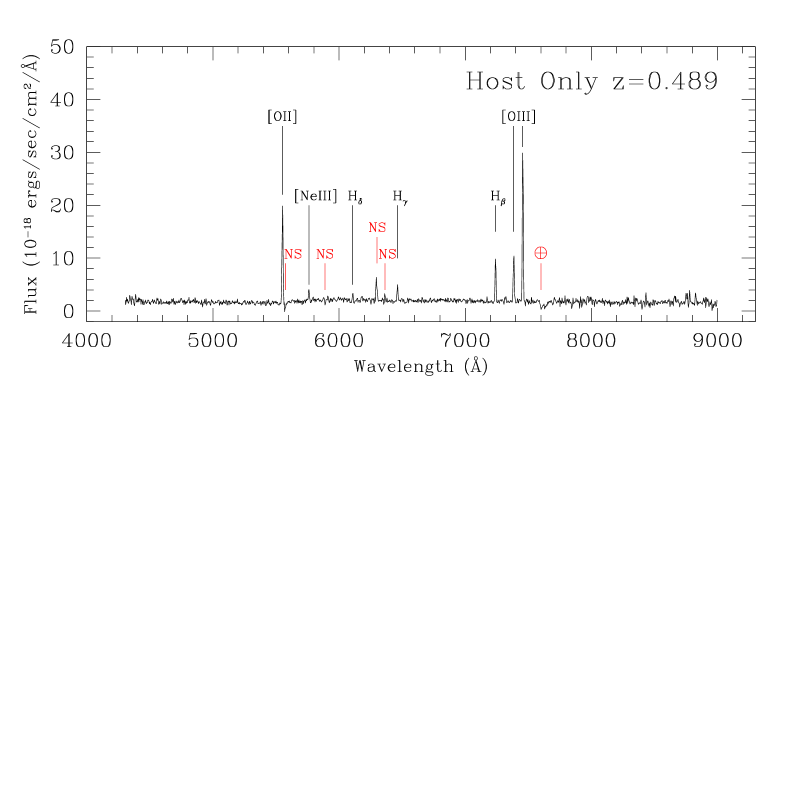
In addition to the 39 candidates that were observed soon after they were discovered, the spectrum of the probable host galaxy of T02-047, which was observed several months after it was discovered, is also reported. The light curve of T02-047 indicates that it is a supernova.
| SCP | IAU | Campaign | Coordinates of | Pivot | Offset | PA | MJD | Grism | Exp. |
| Name | Name | the candidate | Star | (sec) | |||||
| C00-008 | SN 2000fr | Spring 00 | 13 42 00.14 +04 43 42.4 | -1 | -1 | 40.00 | 51676.2 | 300V | 7200 |
| S01-004 | SN 2001gl | Spring 01 | 14 01 16.60 +05 12 48.9 | Hex | -6.07, 0.16 | 92.41 | 52021.2 | 300V | 3600 |
| S01-005 | SN 2001gm | Spring 01 | 14 01 51.18 +05 05 38.5 | Hex | 23.92, 24.80 | 43.97 | 52021.3 | 300V | 2400 |
| S01-0074 | SN 2001go | Spring 01 | 14 02 00.95 +05 00 59.2 | Hex | 34.22, -4.46 | 97.42 | 52021.3 | 300V | 2400 |
| S01-0074 | SN 2001go | Spring 01 | 14 02 00.95 +05 00 59.2 | Hex | 34.22, -4.46 | 97.43 | 52027.2 | 300V | 7200 |
| S01-0074 | SN 2001go | Spring 01 | 14 02 00.95 +05 00 59.2 | Hex | 34.22, -4.46 | 97.43 | 52058.2 | 300V | 9000 |
| S01-017 | SN 2001gr | Spring 01 | 10 04 23.27 +07 40 48.3 | Box | -10.05,-24.64 | 22.19 | 52021.0 | 300V | 3600 |
| S01-028 | SN 2001gs | Spring 01 | 10 00 52.68 +06 07 09.3 | Box | 11.89,-25.79 | -24.75 | 52022.1 | 300V | 4800 |
| S01-031 | SN 2001gu | Spring 01 | 10 03 28.61 +07 24 38.9 | Hex | 37.16, 3.32 | 84.89 | 52021.1 | 300V | 4800 |
| S01-033 | SN 2001gw | Spring 01 | 15 43 45.86 +07 57 50.3 | Hex | -14.09, 32.22 | 156.37 | 52021.4 | 300V | 1200 |
| S01-036 | SN 2001gy | Spring 01 | 13 57 04.54 +04 30 59.8 | Hex | 21.49, 0.43 | 88.85 | 52021.3 | 300V | 2400 |
| S01-037 | - | Spring 01 | 13 55 51.17 +04 48 06.7 | Hex | -56.87, 32.41 | 119.68 | 52021.1 | 300V | 3600 |
| S01-054 | SN 2001ha | Spring 01 | 10 06 33.50 +07 38 03.2 | Hex | 13.51, 22.72 | 30.74 | 52022.0 | 300V | 3600 |
| S01-065 | SN 2001hc | Spring 01 | 09 44 31.52 +08 02 02.8 | Hex | -14.17, 46.46 | -16.96 | 52022.1 | 300V | 1800 |
| S02-000 | SN 2002fd | Spring 02 | 14 03 54.08 +04 59 49.0 | Box | -6.48, 2.62 | 112.01 | 52376.1 | 300V | 600 |
| S02-001 | - | Spring 02 | 14 03 56.42 +05 23 16.6 | Hex | -27.85, 39.10 | 144.54 | 52376.3 | 300I | 2700 |
| S02-002 | SN 2002fe | Spring 02 | 14 04 18.16 +05 19 25.6 | B | -8.49, 1.52 | 100.15 | 52376.2 | 300I | 2700 |
| S02-025 | - | Spring 02 | 13 57 50.11 +05 17 25.5 | Hex | 0.09, 14.94 | 0.34 | 52376.2 | 300I | 2700 |
| S02-075 | SN 2002fg | Spring 02 | 13 24 25.92 +27 44 33.9 | Hex | 57.74,-22.44 | -68.76 | 52431.0 | 300V | 7200 |
| C02-016 | SN 2002fr | Spring 02 | 14 00 46.40 +04 33 41.4 | Hex | -12.67 10.57 | 145.65 | 52400.3 | 300V | 900 |
| C02-028 | SN 2002fm | Spring 02 | 14 00 29.75 +04 46 50.1 | B | -27.76, 21.91 | 128.28 | 52413.0 | 300V | 1800 |
| C02-030 | SN 2002fp | Spring 02 | 14 02 18.40 +04 47 05.9 | Hex | 1.69,-21.86 | -4.43 | 52407.1 | 300I | 3600 |
| C02-031 | - | Spring 02 | 14 01 38.07 +04 38 02.2 | Box | 0.88, 38.36 | 178.69 | 52406.1 | 300I | 3600 |
| C02-034 | - | Spring 02 | 14 00 30.75 +05 13 55.6 | Hex | 5.82,-22.77 | -14.34 | 52413.0 | 300V | 1800 |
| T02-015 | SN 2002gi | Spring 02 | 13 57 12.25 +04 33 16.8 | Hex | 1.17,-68.78 | -0.97 | 52407.2 | 300I | 7200 |
| T02-028 | SN 2002gj | Spring 02 | 15 36 25.48 +09 28 18.2 | Hex | -40.55, 62.58 | 147.06 | 52413.2 | 300V | 3000 |
| T02-029 | SN 2002gk | Spring 02 | 15 37 07.47 +09 36 18.7 | C | -20.24, 16.98 | 129.99 | 52413.3 | 300V | 900 |
| T02-030 | SN 2002gl | Spring 02 | 15 43 24.40 +07 53 57.5 | Hex | 2.32, 43.98 | -176.98 | 52413.1 | 300V | 3000 |
| T02-0473 | - | Spring 02 | 15 36 29.88 +09 38 42.8 | Hex | -42.94,-29.25 | 55.74 | 52494.0 | 300V | 3000 |
| SuF02-002 | SN 2002kq | Fall 02 | 02 17 12.24 -04 55 08.7 | Hex | -21.25, -4.06 | 79.18 | 52586.1 | 300I | 3600 |
| SuF02-005 | - | Fall 02 | 02 18 35.67 -04 31 11.2 | A | 18.26, 0.06 | -90.19 | 52586.1 | 300I | 3600 |
| SuF02-007 | - | Fall 02 | 02 18 52.32 -05 01 14.0 | Hex | 6.63,-40.66 | -9.26 | 52588.7 | 300I | 13200 |
| SuF02-012 | SN 2002lc | Fall 02 | 02 18 51.60 -04 47 25.7 | Hex2 | -19.04, 14.75 | 8.81 | 52588.3 | 600z | 7200 |
| SuF02-017 | SN 2002kn | Fall 02 | 02 16 45.71 -05 09 51.2 | Hex | -48.24, -0.53 | 89.37 | 52590.2 | 300I | 1800 |
| SuF02-025 | SN 2002km | Fall 02 | 02 16 23.93 -04 49 29.4 | Box | -7.30, 5.14 | 125.15 | 52588.1 | 300I | 3600 |
| SuF02-026 | - | Fall 02 | 02 18 51.90 -04 46 57.4 | Hex2 | -19.04, 14.75 | 8.81 | 52588.3 | 600z | 7200 |
| SuF02-028 | SN 2002kz | Fall 02 | 02 16 56.36 -05 00 58.1 | Hex | 26.08,-47.36 | -28.84 | 52587.1 | 300I | 3600 |
| SuF02-051 | - | Fall 02 | 02 17 27.47 -04 40 45.3 | C | -11.62, -2.10 | 79.76 | 52586.3 | 300I | 3600 |
| SuF02-060 | SN 2002kr | Fall 02 | 02 17 34.51 -04 53 46.6 | A | 19.82,-17.49 | -48.75 | 52587.2 | 300I | 3600 |
| SuF02-065 | SN 2002ks | Fall 02 | 02 17 34.53 -05 00 15.4 | A | -28.15,-23.05 | 50.69 | 52586.2 | 300I | 3600 |
| SuF02-081 | - | Fall 02 | 02 20 07.49 -05 08 27.4 | A | 51.24,-20.89 | -67.82 | 52589.2 | 300I | 9600 |
| SuF02-083 | SN 2002kx | Fall 02 | 02 18 06.21 -05 00 38.8 | Box | -35.39, 1.64 | 92.65 | 52587.1 | 300I | 7200 |
1 Centered on the candidate.
2 The slit passed through SuF02-012 and SuF02-026
3 T02-047 was observed several months after maximum light
4 SN 2001go was observed at three epochs
3 Data reduction and classification
Standard IRAF111IRAF is distributed by the National Optical Astronomy Observatories, which are operated by the Association of Universities for Research in Astronomy, Inc., under the cooperative agreement with the National Science Foundation. procedures were used to process the data. The bias was estimated by fitting the over-scan region with a low-order polynomial, flat-fielding was done with lamp flats that were first cleaned of parasitic light, and wavelength calibration was performed with arc frames.
For observations with the 300V grism, fringing is not a significant limitation in the data so the two-dimensional spectra were combined (with suitable clipping to remove cosmic rays) and the sky was removed by estimating the background flux on either side of the object trace.
For observations with the 300I and 600z grisms, fringing is more significant. If it is not treated carefully, the systematic error from fringing residuals can be large. Before combining individual spectra, a fringe correction was applied to the data. The fringe correction consists of the following steps:
-
•
For a given spectrum in which the object was at a certain slit position, a group of similar spectra (the same grism, order sorting filter and slit) with objects at different slit positions was collected.
-
•
Fringe frames are created by clipping object pixels and averaging the remainder. Since the intensity of night sky lines can vary with respect to one another, each column (the spatial direction of the spectra are along columns) is treated individually. Instrumental flexure for FORS1 and FORS2 is small, so some fringe frames were created from data that were taken on different nights.
-
•
The fringe frames are subtracted from the data after suitable scaling. Again, each column is treated individually.
-
•
An average sky spectrum (calculated by averaging along columns of the fringe frame) is added back to the data. This helps with the clipping of cosmic rays when the two dimensional spectra are combined.
-
•
The data are combined with suitable clipping for cosmic rays and the sky is removed by estimating the flux on either side of the object trace.
The resulting two-dimensional sky-subtracted spectra are free of fringes at the expense of a slight reduction in the statistical signal-to-noise ratio.
The spectra of the candidates and, in some cases, the spectra of the hosts were then extracted and calibrated in wavelength and flux. In all cases, we also produce error spectra, which are used to estimate the significance of spectral features.
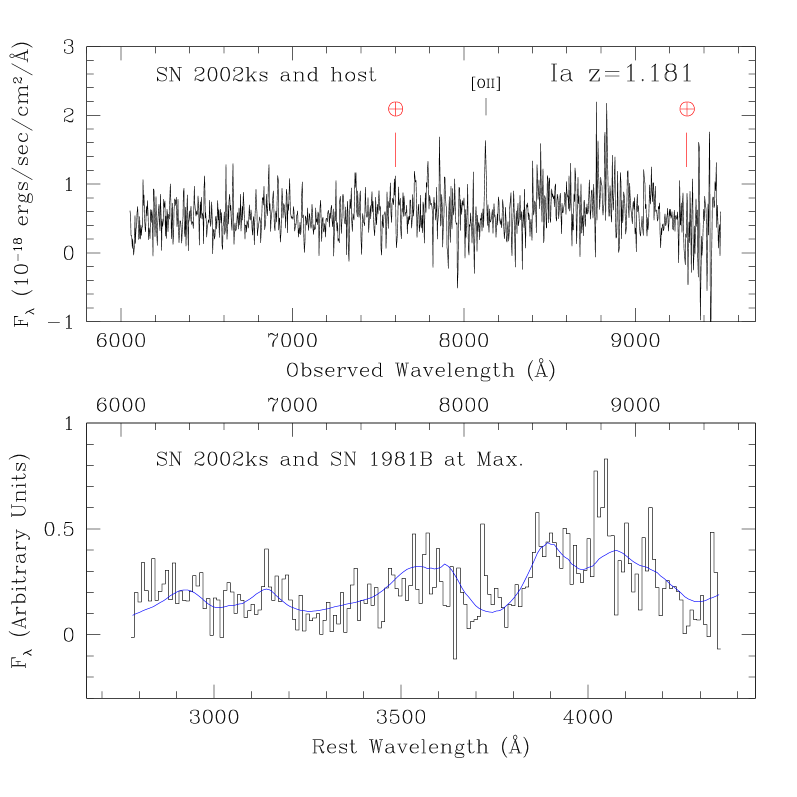
The signal-to-noise ratio varies from very low ( per wavelength element) to moderately good ( per wavelength element). The spectra with the highest signal-to-noise ratios are studied in more detail in Garavini et al. (in preparation). The quality of some of the high-redshift SN Ia spectra that are presented in this paper, SN 2002ks at z=1.181 is one example (see Fig. 41), matches the quality of spectra that have been taken with HST (Riess et al. Riess04 (2004)).
3.1 Classification
At high redshifts (), the broad Si II feature at 6150 Å, which is one of the defining spectral signatures of the SN Ia class, is often outside the wavelength range covered by the spectra. Therefore, we use other features, such as the Si II feature at and the S II ”W” feature at , which are only seen in SNe Ia, to spectrally identify SNe Ia when the Si II feature at is not visible (Hook et al. in preparation).
We also use a library of galaxy and nearby supernova spectra to fit the spectra of candidates (Howell and Wang, Howell02 (2002)), and we use these fits to classify candidates when the Si II and S II features cannot be clearly identified. A representative sample of galaxy spectral templates ranging from early to late types and more than 250 spectra of nearby supernova of all types currently make up the library. For a given candidate and a given nearby supernova, the fit determines the fraction of host galaxy light, the host galaxy spectral type, the redshift of the supernova and the amount of reddening. The quality of the fit is quantified with the reduced , which has little meaning in an absolute sense. The finite size of the spectral library and systematic calibration errors in both low and high samples mean that the reduced is always greater than one. However, it is useful for ordering the fits.
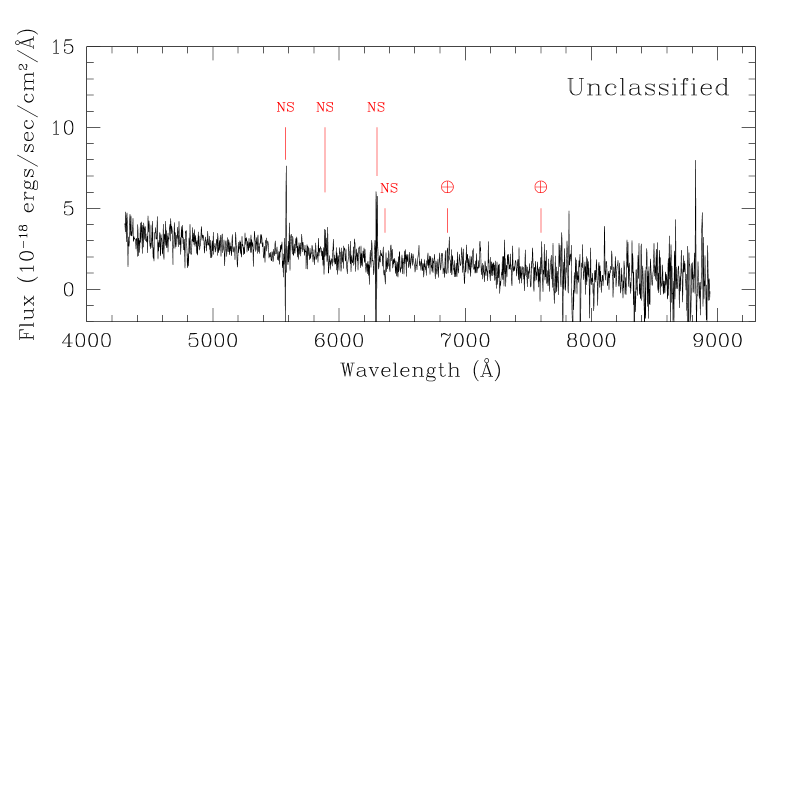
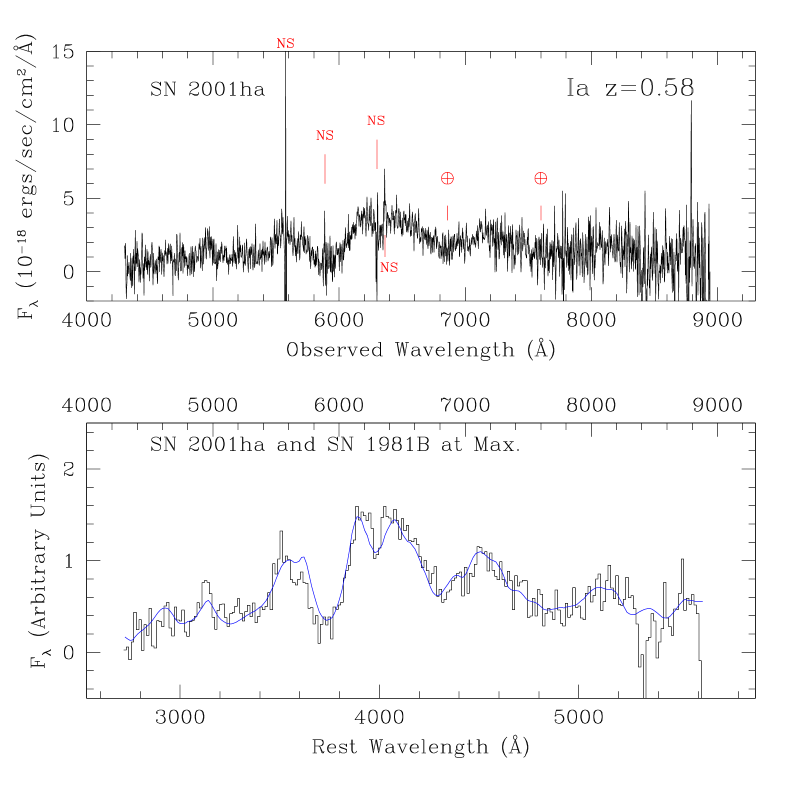
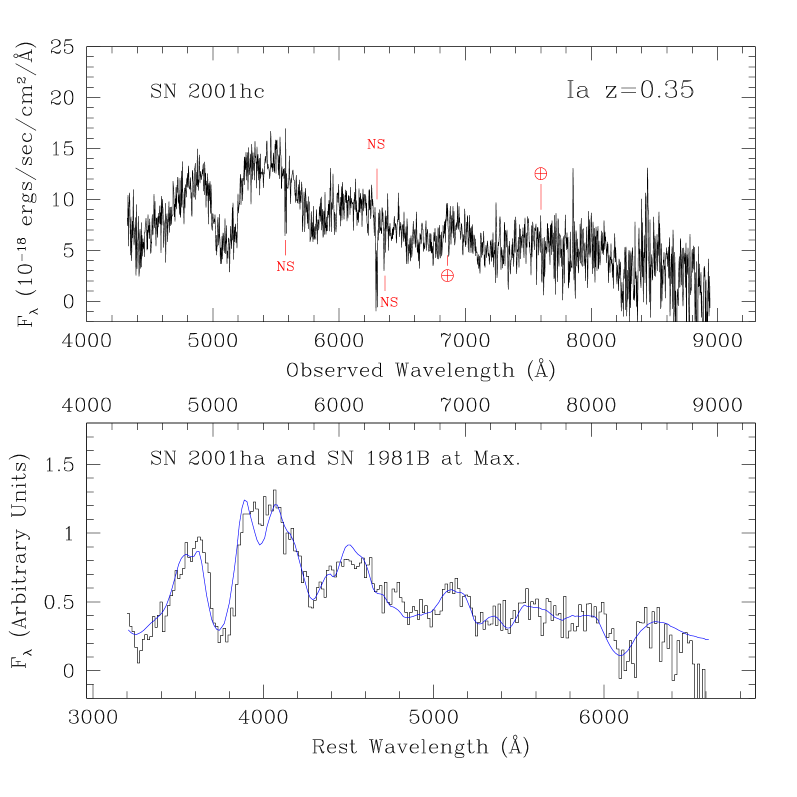
The fit can be constrained by using additional information. For example, if there is no apparent host - SN 2001ha is one example - the fraction of light from the host galaxy is set to zero in the fit. Alternatively, if there is a host and if the redshift of the host galaxy is known, the redshift of the candidate is fixed to this value and the redshift is reported to three decimal places. Otherwise, the redshift is determined from the fit and is reported to two decimal places.
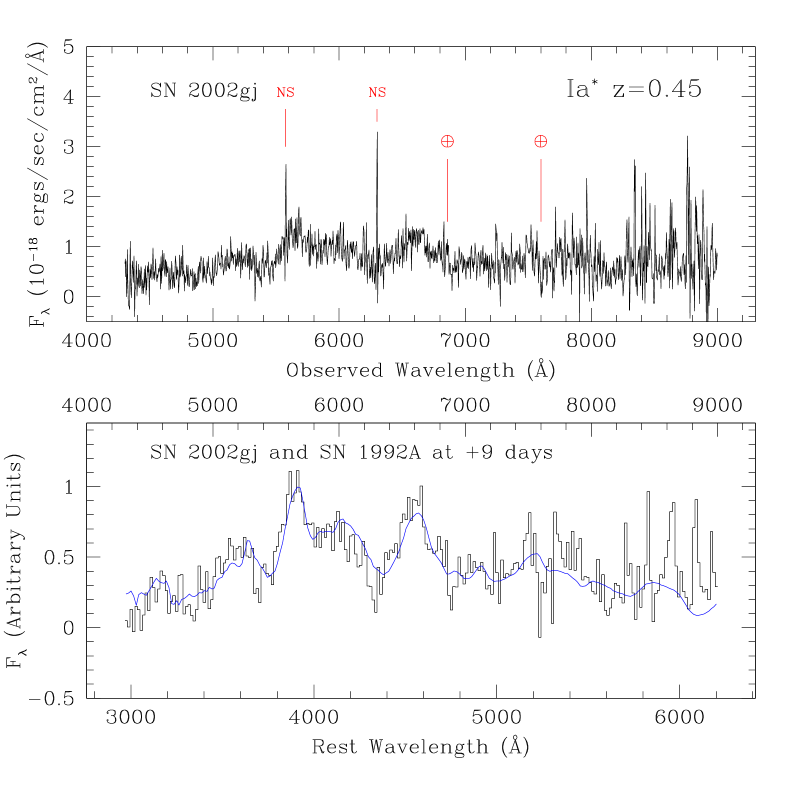
The fits are ordered according to the reduced and the first dozen fits are inspected visually. If Silicon or Sulfur are clearly identified or if the spectrum can be matched with the spectrum of a nearby SN Ia, the candidate is assigned the label “Ia” and the classification is considered secure. Less secure candidates are labelled “Ia∗”. The asterisk indicates some degree of uncertainty. This usually means that we see spectral features that are consistent with a SN Ia classification and can find an acceptable match with a nearby SN Ia, but that other types, such as a SN Ic, also result in acceptable matches and cannot be excluded. For example, the spectra of SNe Ia 10 days after maximum light resemble the spectra of some SNe Ic at maximum light, especially around the 4000 Å region. In these cases, the light curve can be used to estimate the epoch at which the spectra were taken and to distinguish between the two possibilities. A good example is the spectrum of SN 2002gj, which can be matched with either a SN Ia or a SN Ic. By using the light curve to constrain the epoch, SN 2002gj is clearly a SN Ia.
The best matching nearby supernova is chosen by visually examining the best dozen fits and selecting the best qualitative fit. For candidates that are classified as “Ia” or “Ia*”, the best matches are listed in Table 4 and plotted in Fig. 3 and in Figs. 5 to 43.
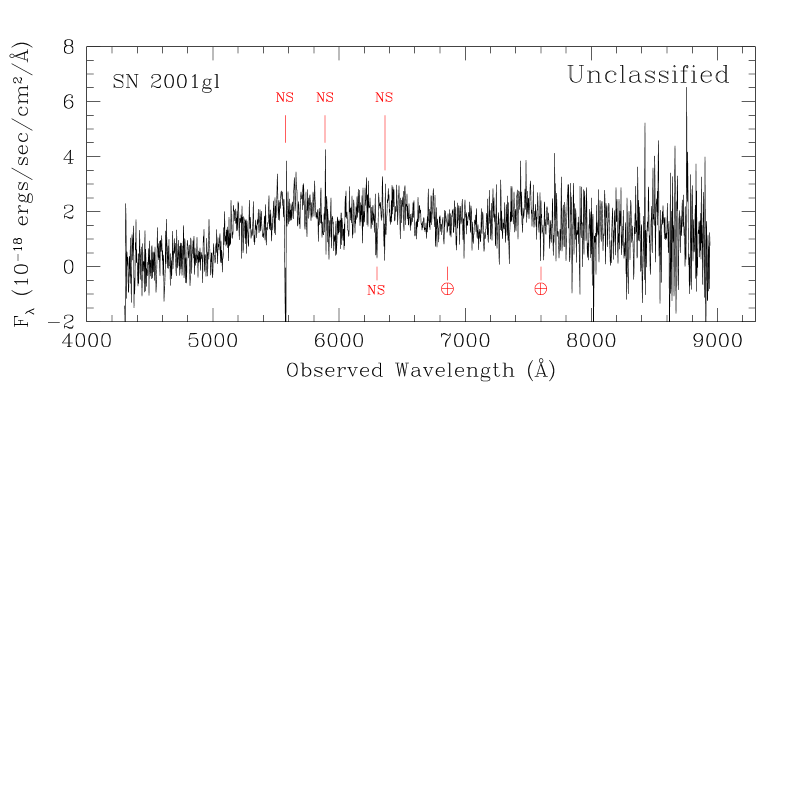
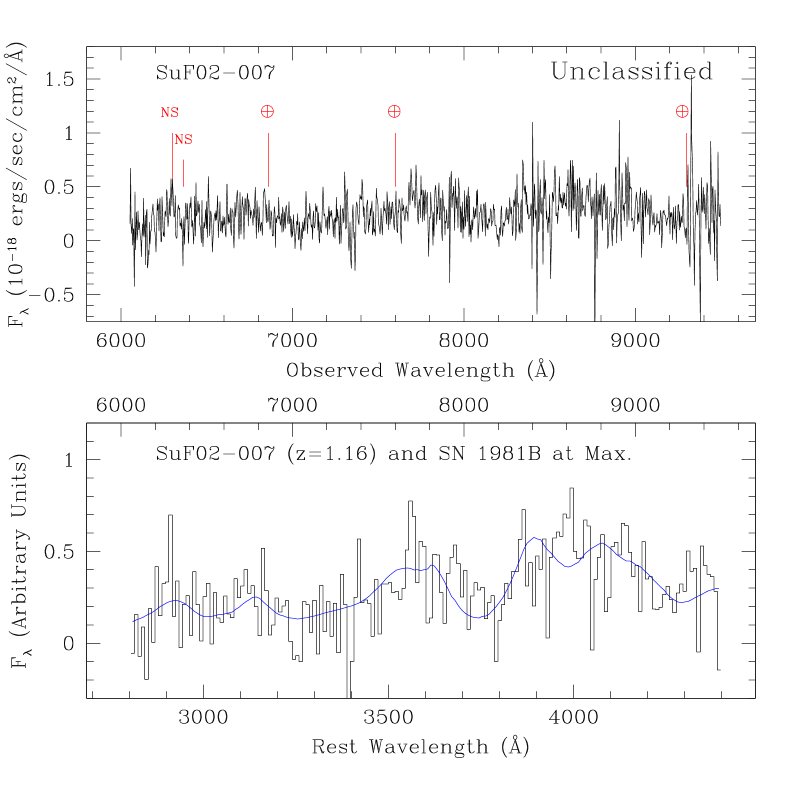
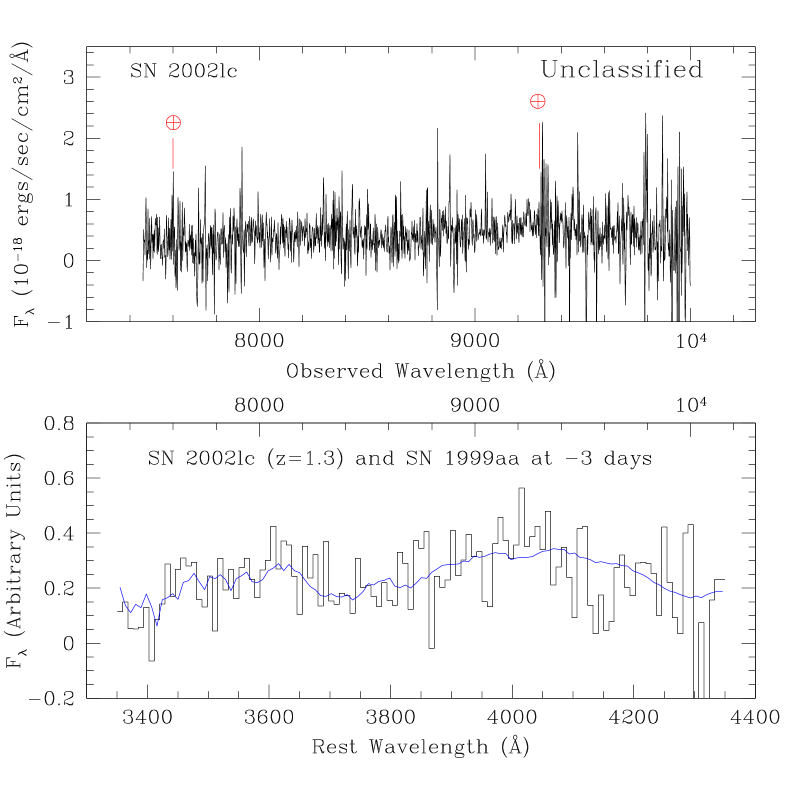
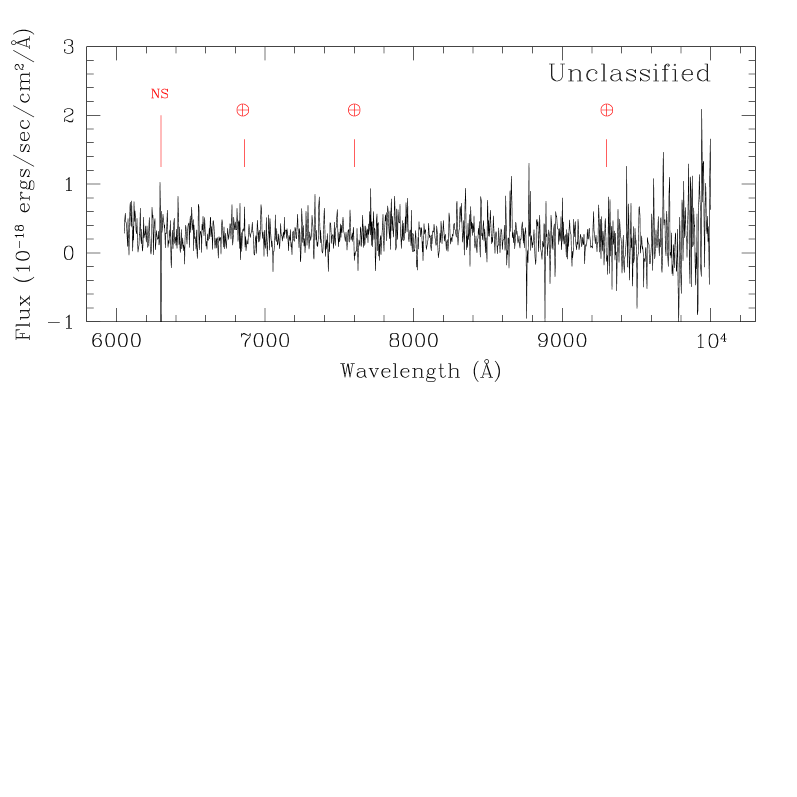
A simple dash indicates that a classification based on the VLT spectrum alone could not be made. This does not mean that these candidates are not supernovae. Some of the unclassified candidates show broad supernova-like features in their spectra, while others have well measured light curves. Candidates that fall in the former category include SN 2001gl, SN 2002lc and SuF02-007. Candidates that fall in the latter category include SN 2002fr, SN 2002fm, C02-034, T02-047, SN 2002kq, SuF02-007, SN 2002lc, SuF02-026, SN 2002kz, SuF02-051 and SN 2002kx.
4 Results
The results of the four SCP campaigns are summarized in Table 4, where each candidate is identified with the internal SCP name. The IAU name, the spectral classification, the redshift and the best template match are also listed if these items are available. Beside each classification, we also give the reason for the classification. If Si II at 4000 Å or 6150 Å or S II at 5400 Å were identified then we attach the label “Si II” to the classification. If the classification was done from the fit, we attach the label “SF”, which stands for spectral fit. The comments provide additional information. For example, in the cases where a classification from the VLT spectrum could not be made, we note down any relevant information from the light curve.
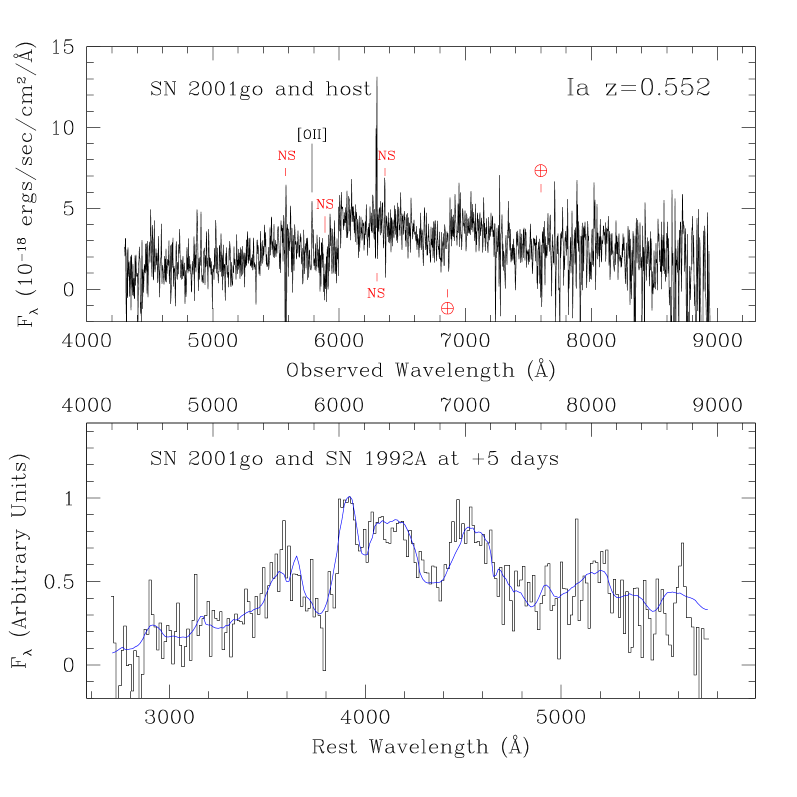
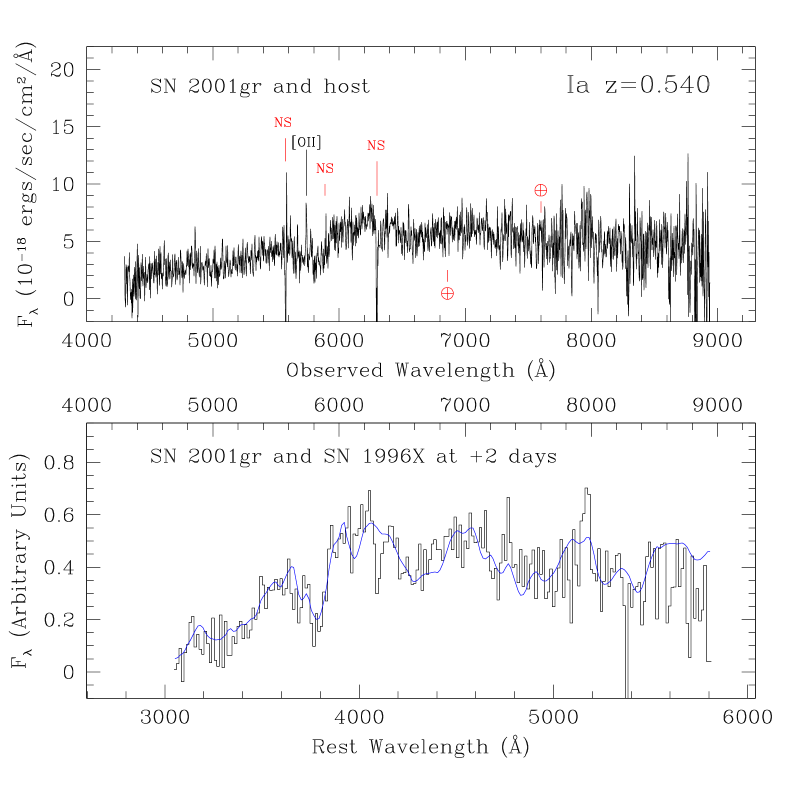
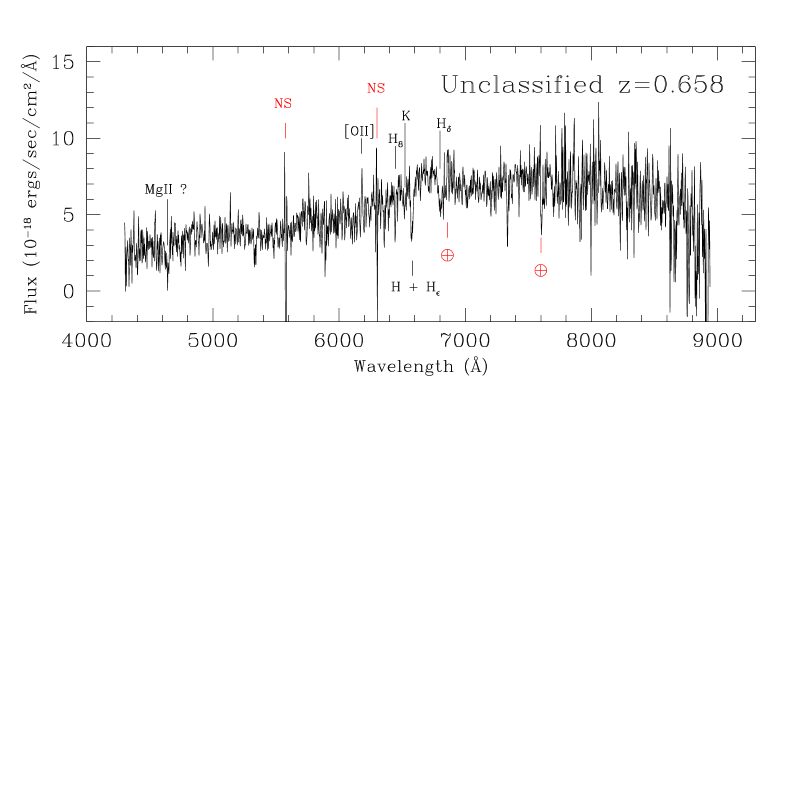
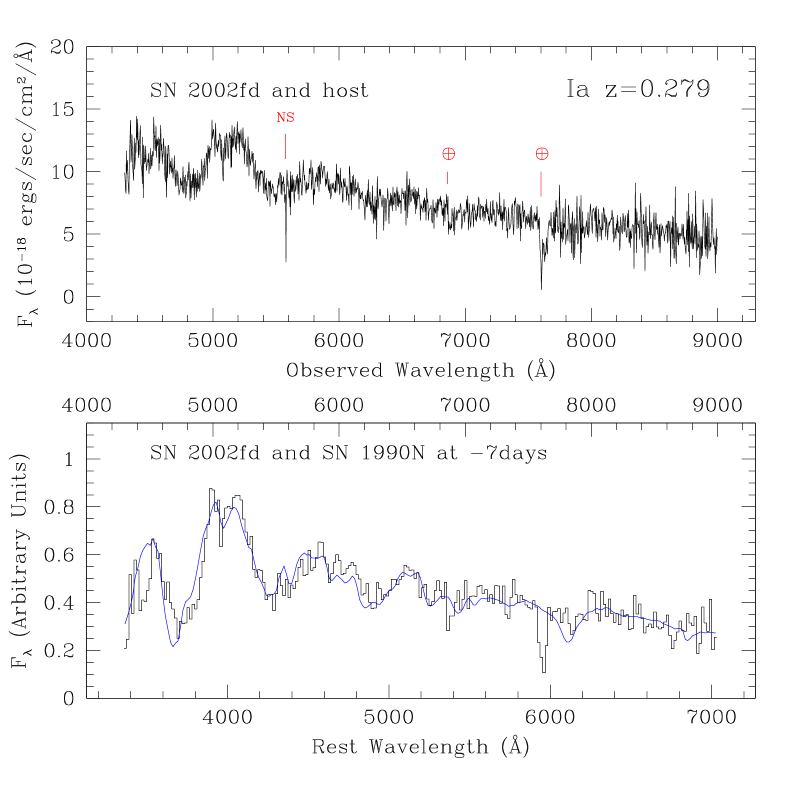
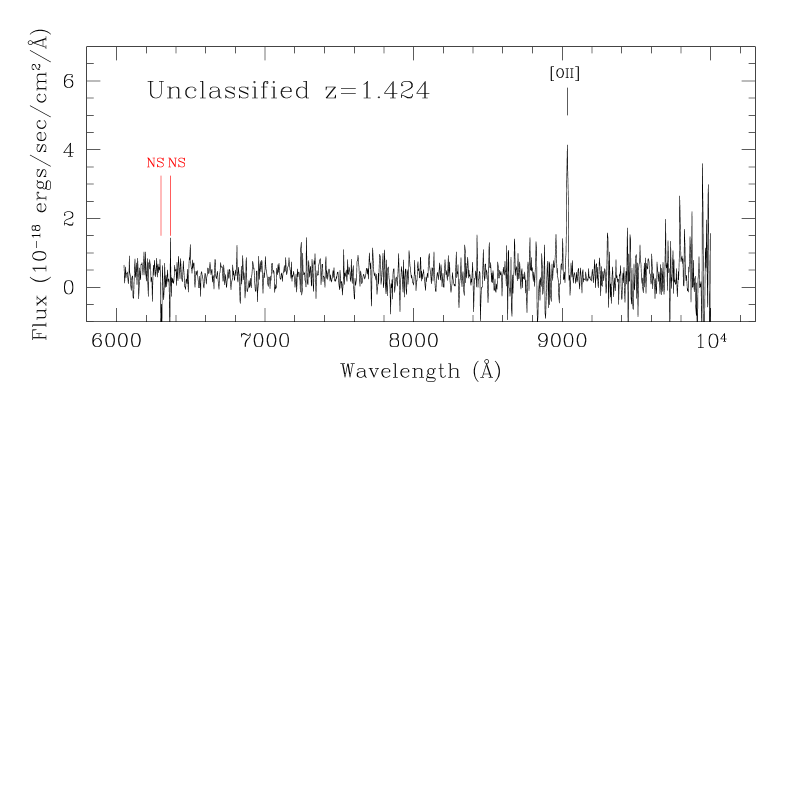
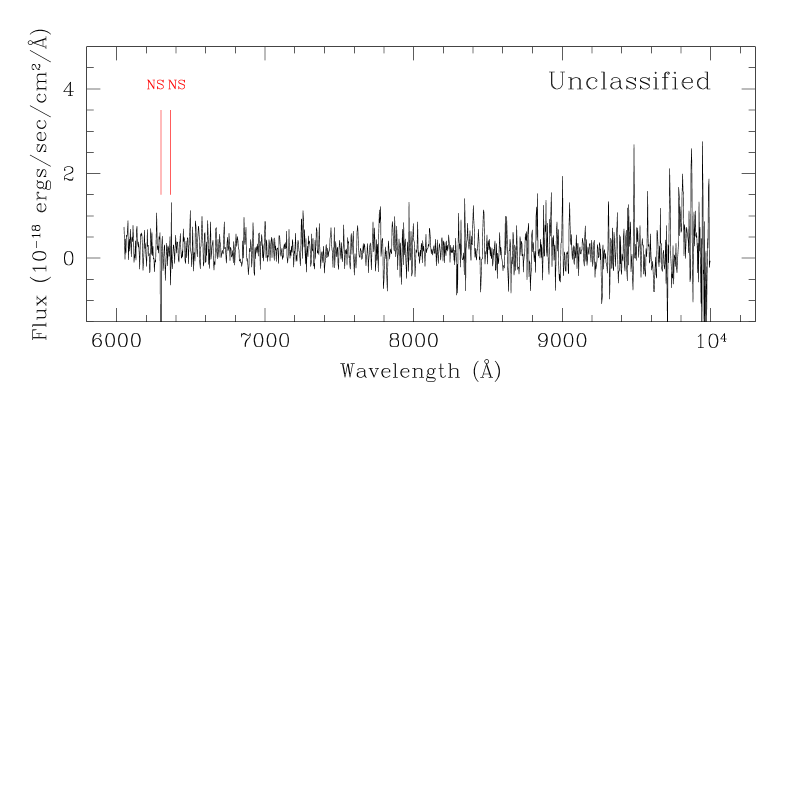
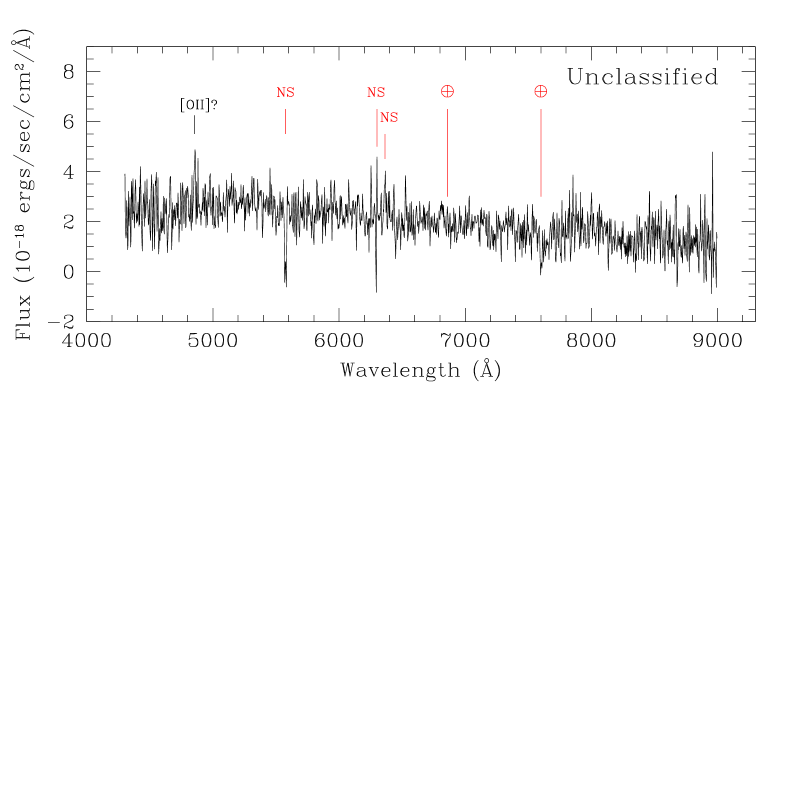
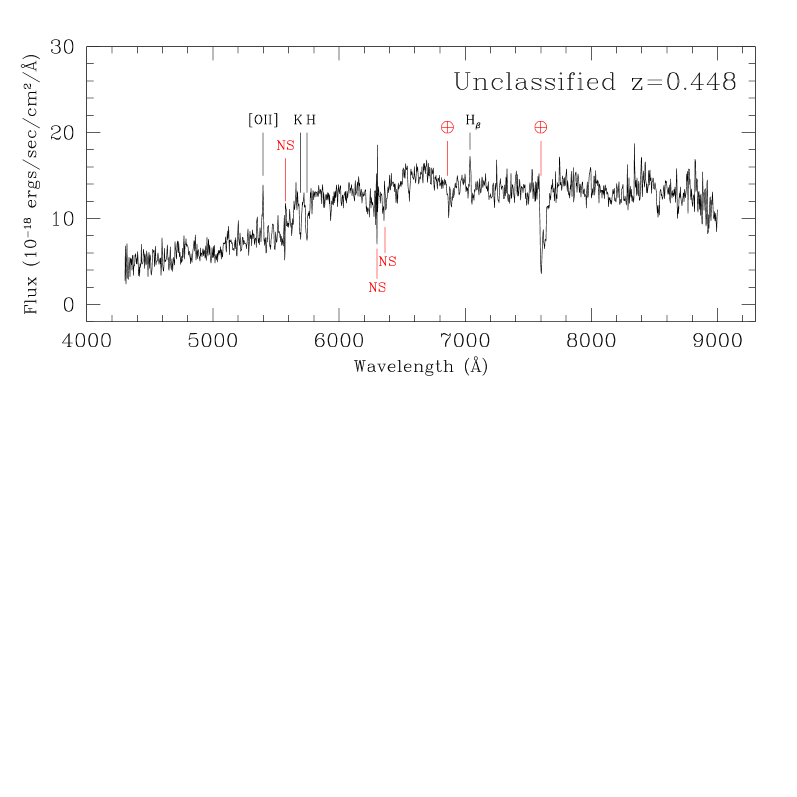
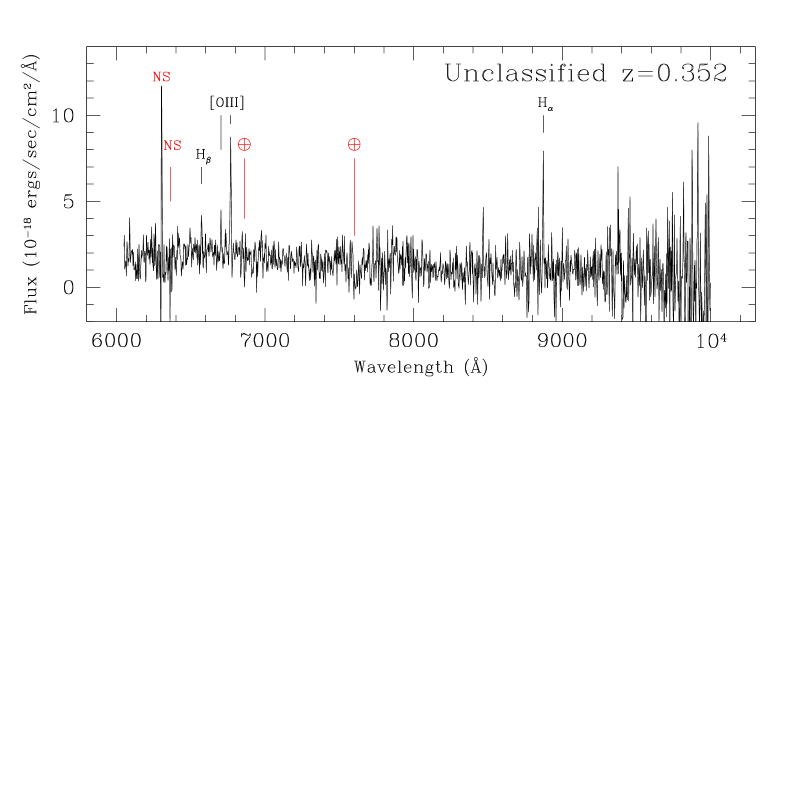
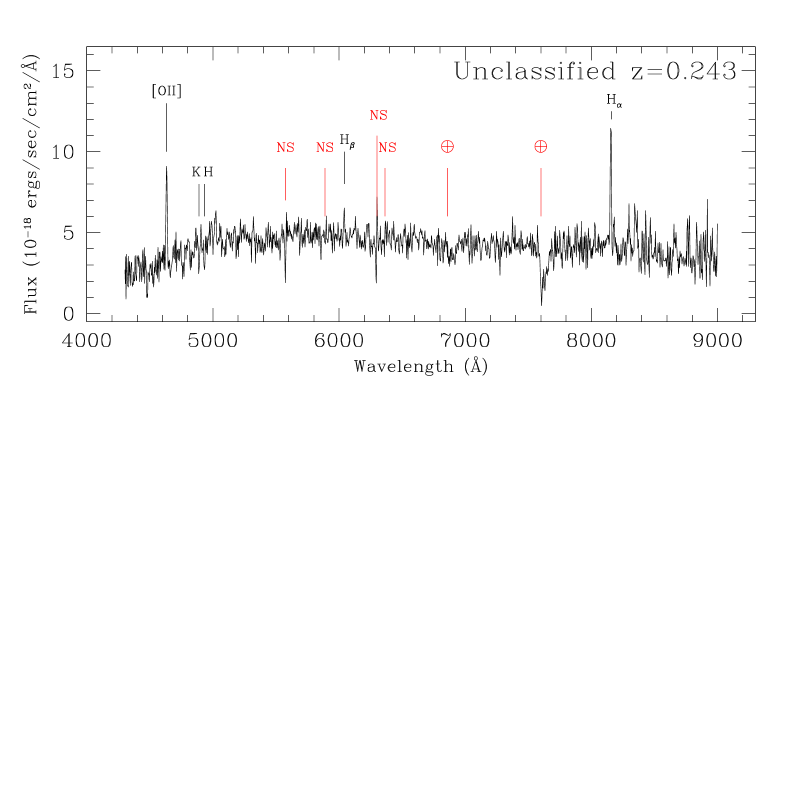
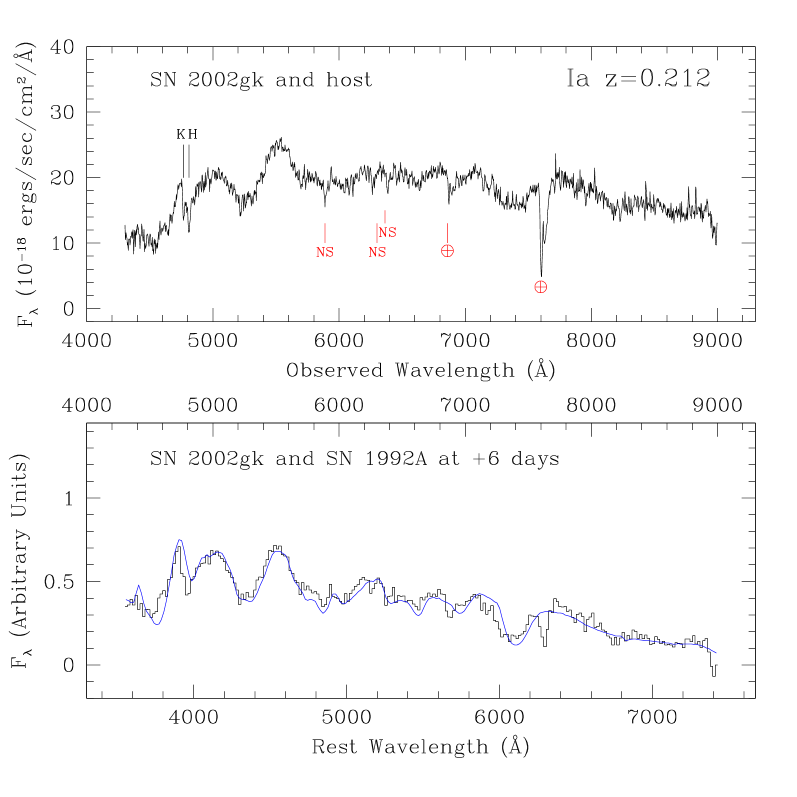
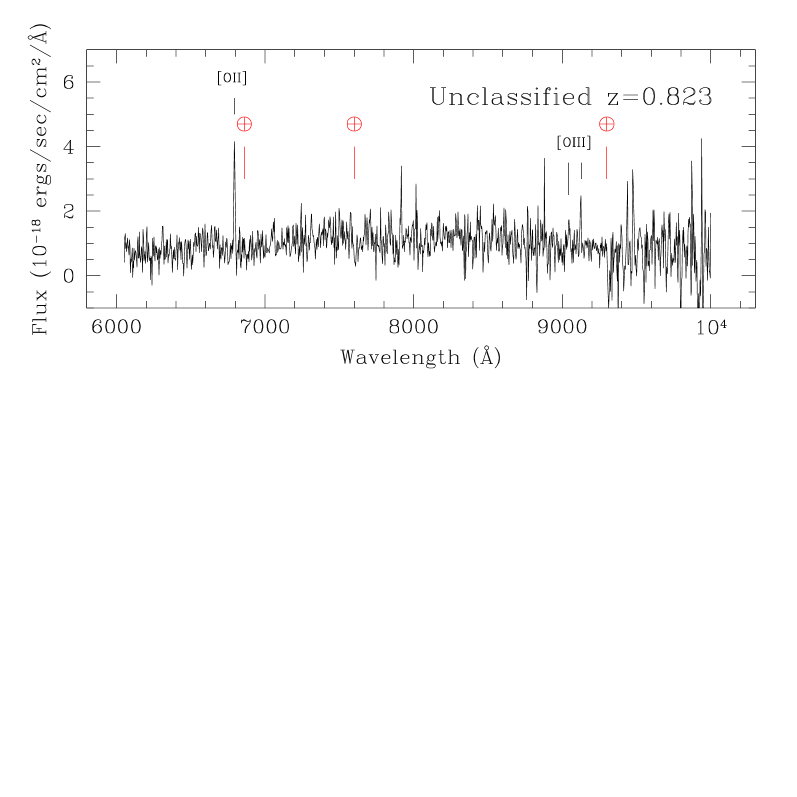
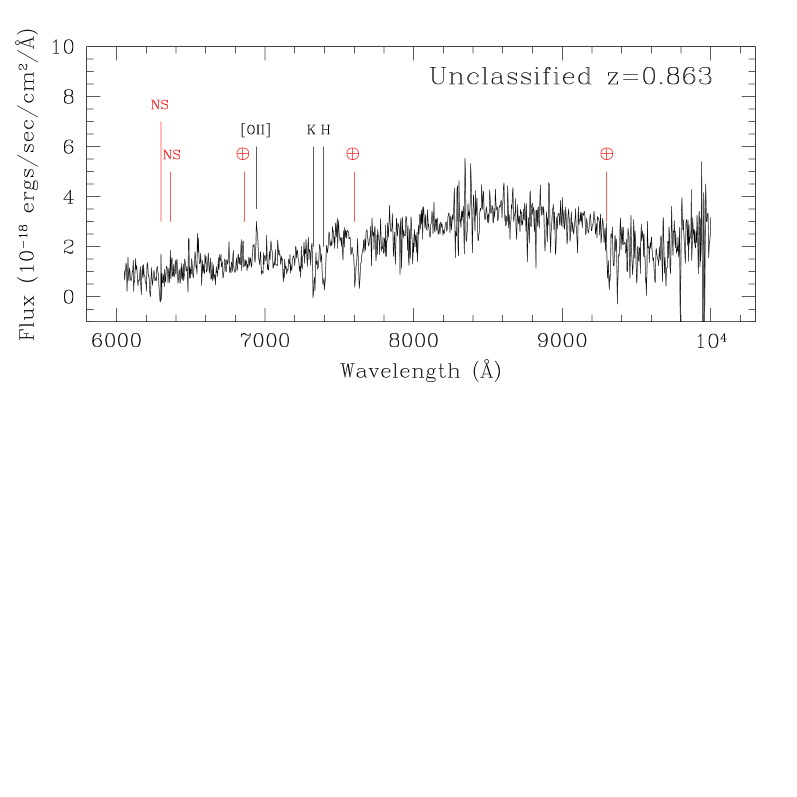
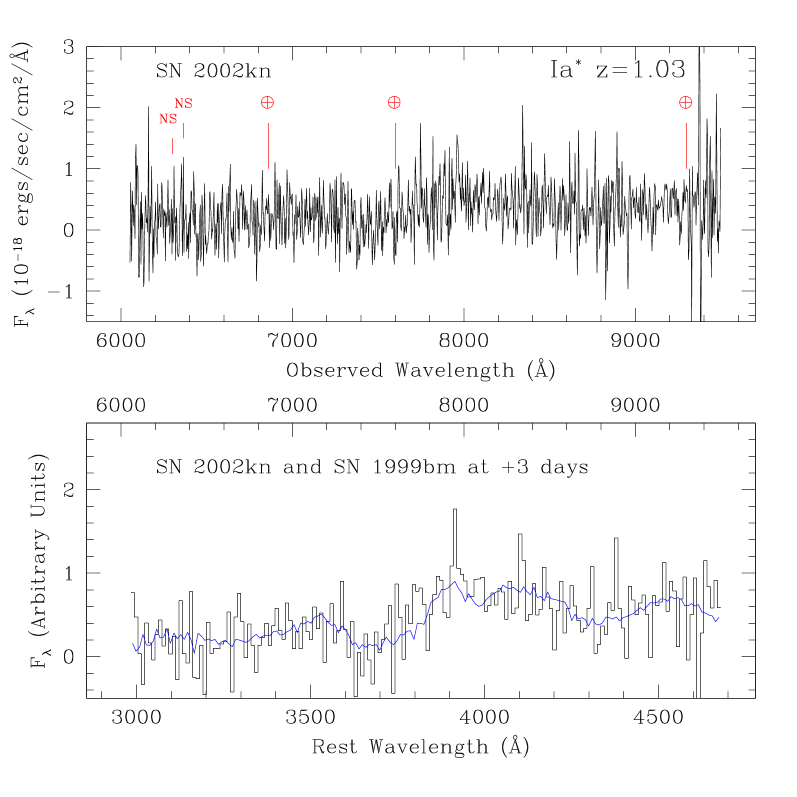
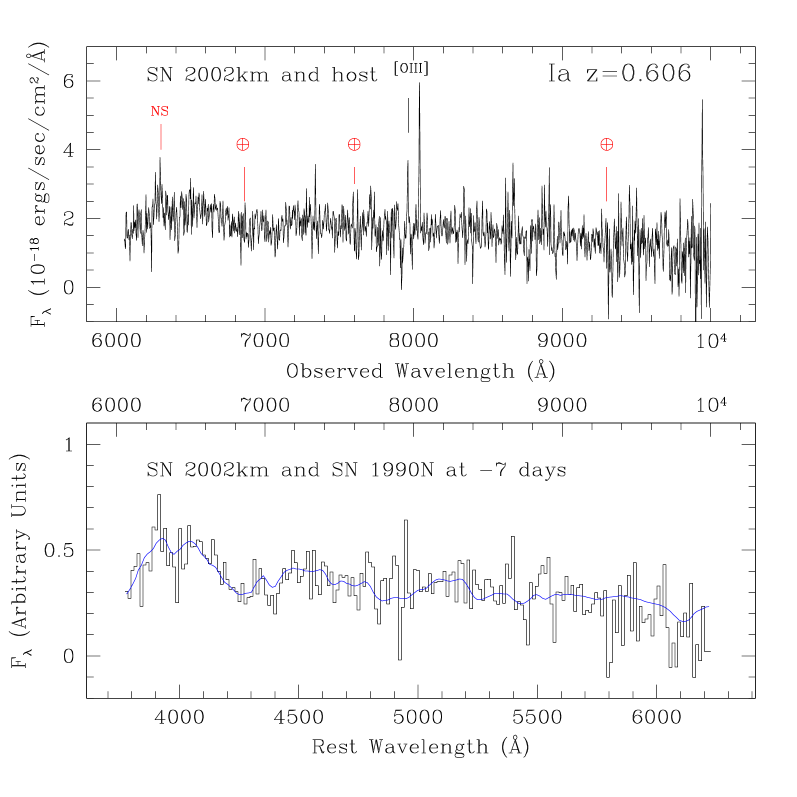
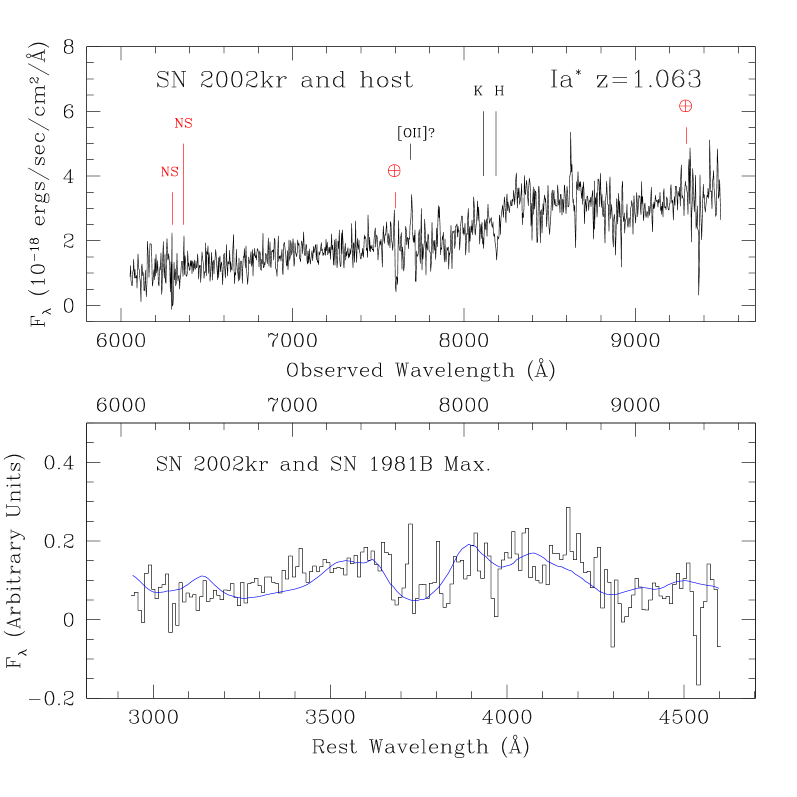
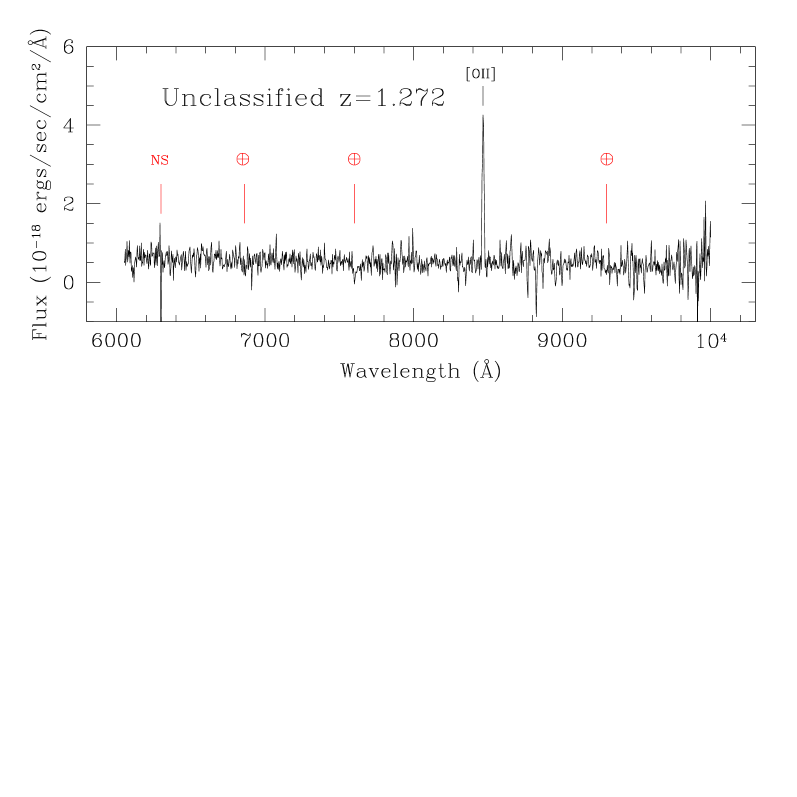
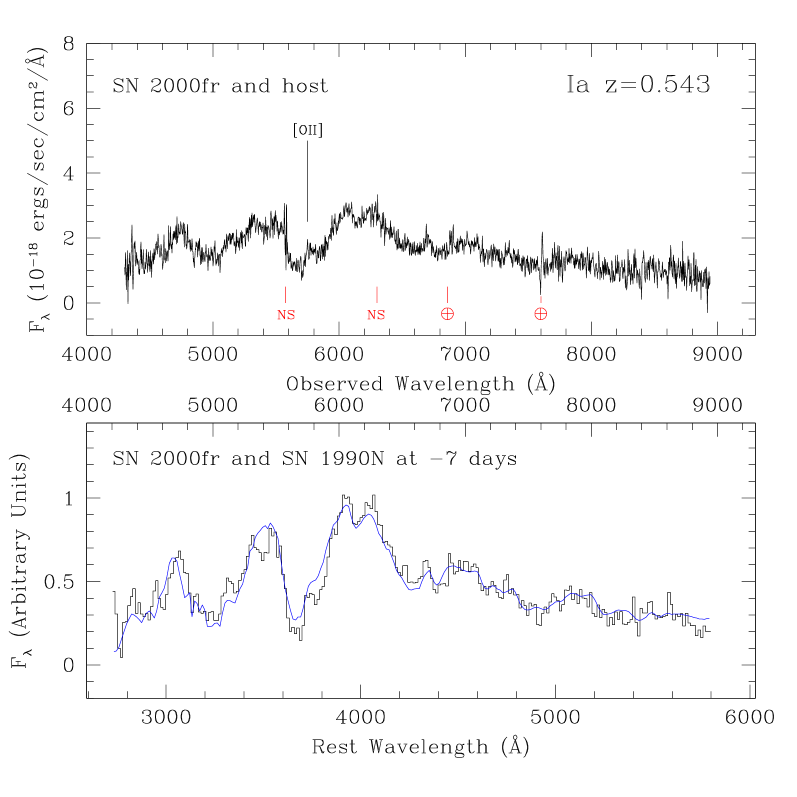
The spectrum of SN 2000fr is shown in Fig. 3 and the spectra of all other candidates are presented in the appendix222The appendix is only available in the electronic version of the journal.. In some cases, we have compensated for telluric absorption by dividing the spectra with a suitably scaled spectrum of the telluric absorption on Cerro Paranal. In any case, the location of telluric absorption features (usually the A and B bands and, for the 300I and 600z grisms, the telluric feature that starts at 9300 Å) are marked in all spectra with the symbol . The location of night sky subtraction residuals (usually from the bright night sky lines at 5577, 5890, 6300 and 6364 Å) are marked with the letters “NS”. Spectroscopic features from the host galaxy are marked where appropriate.
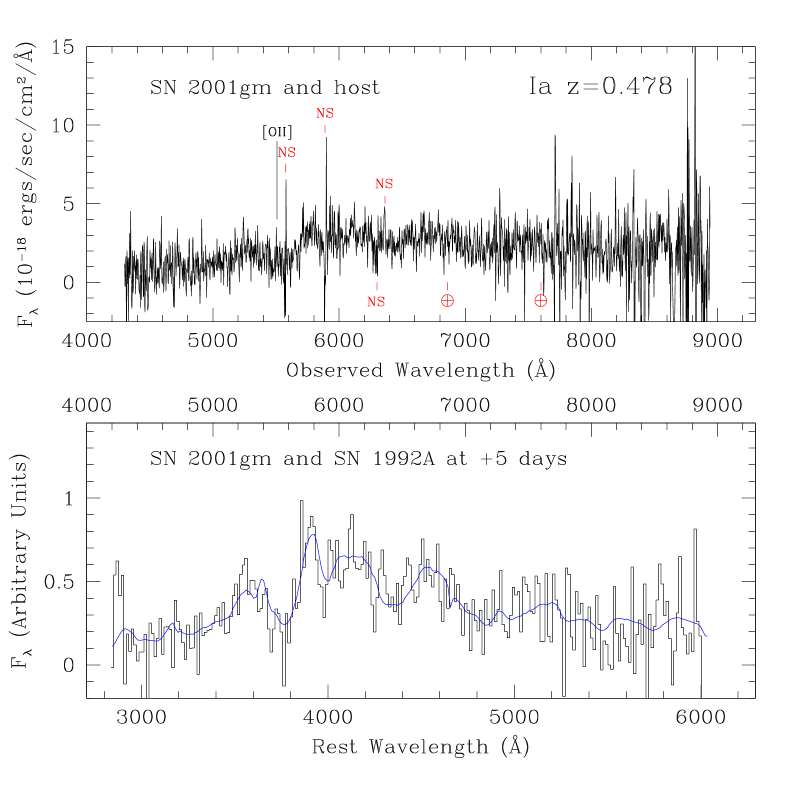
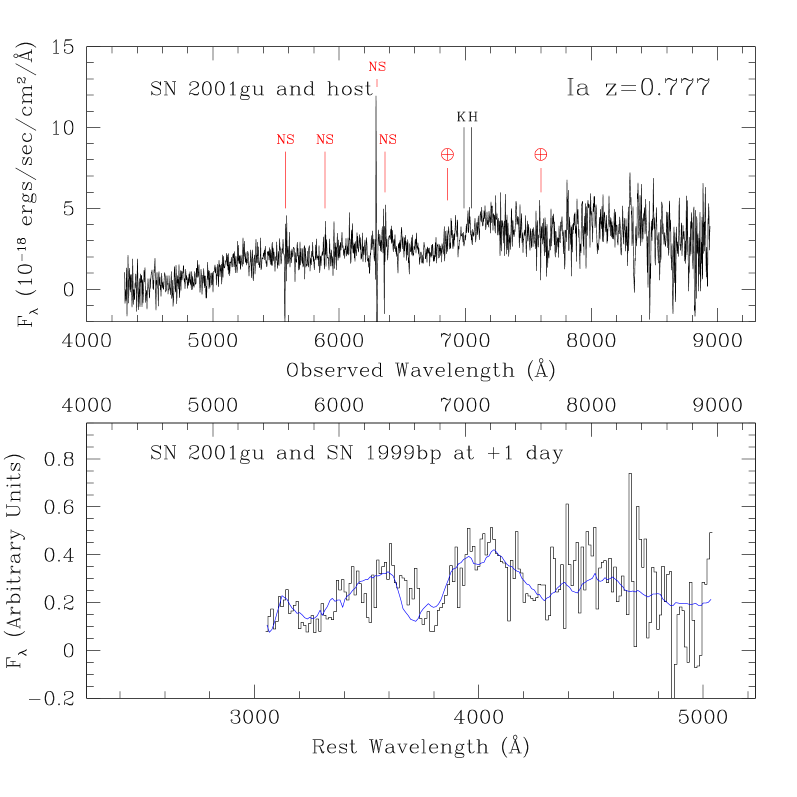
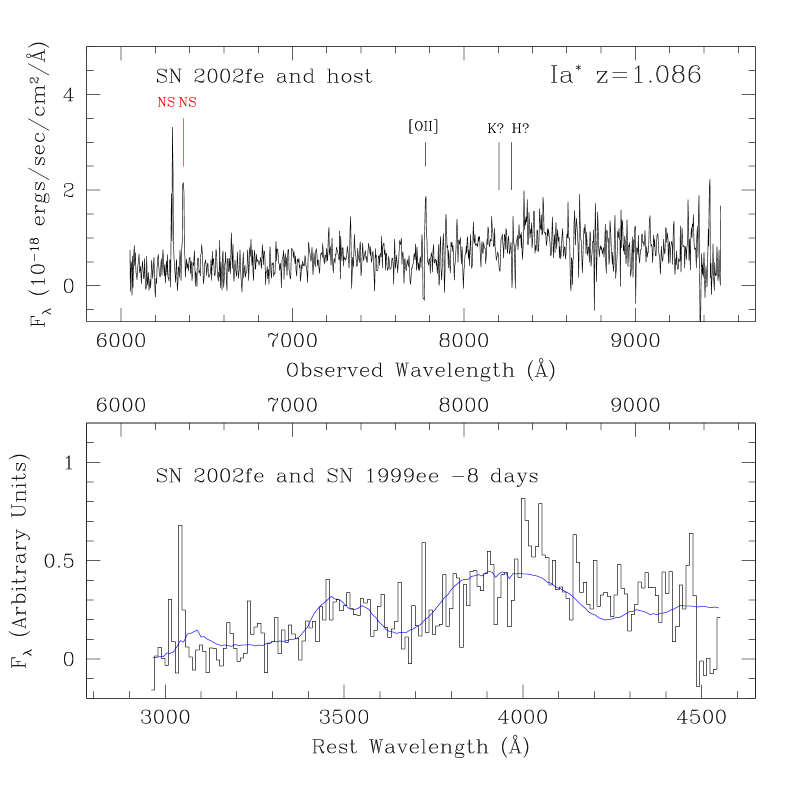
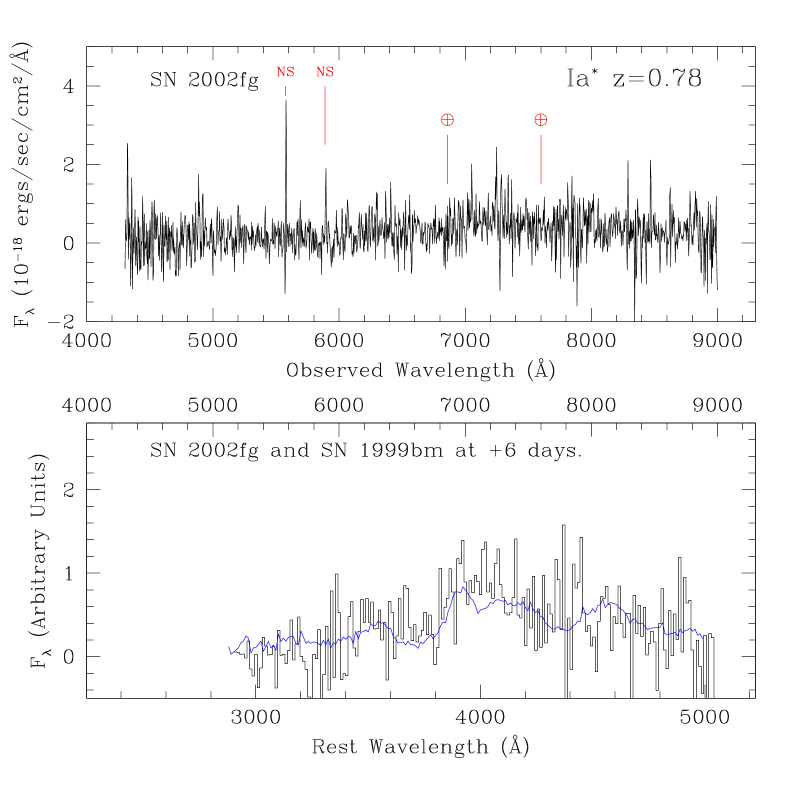
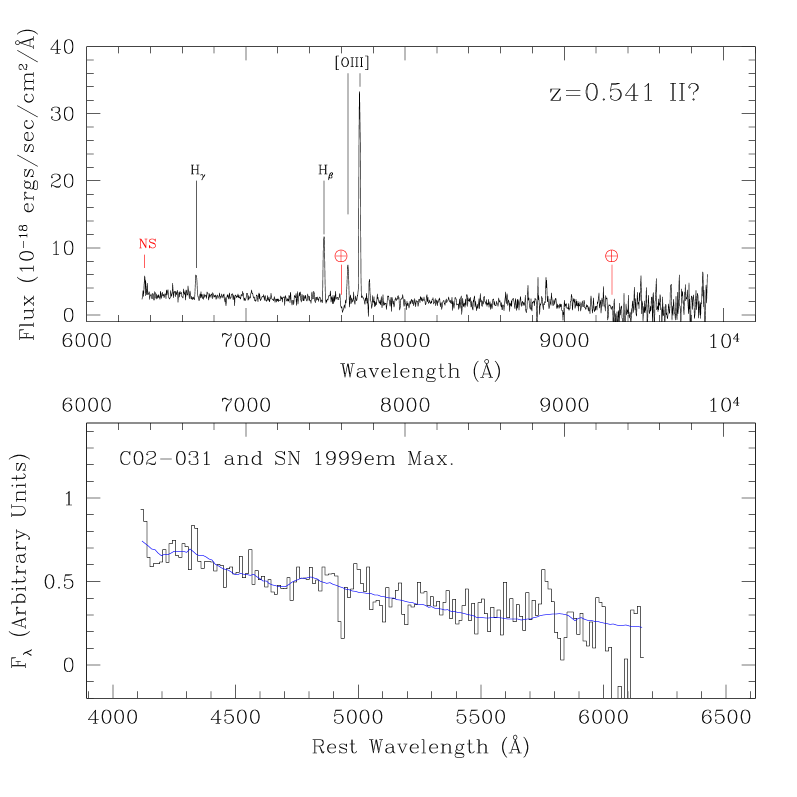
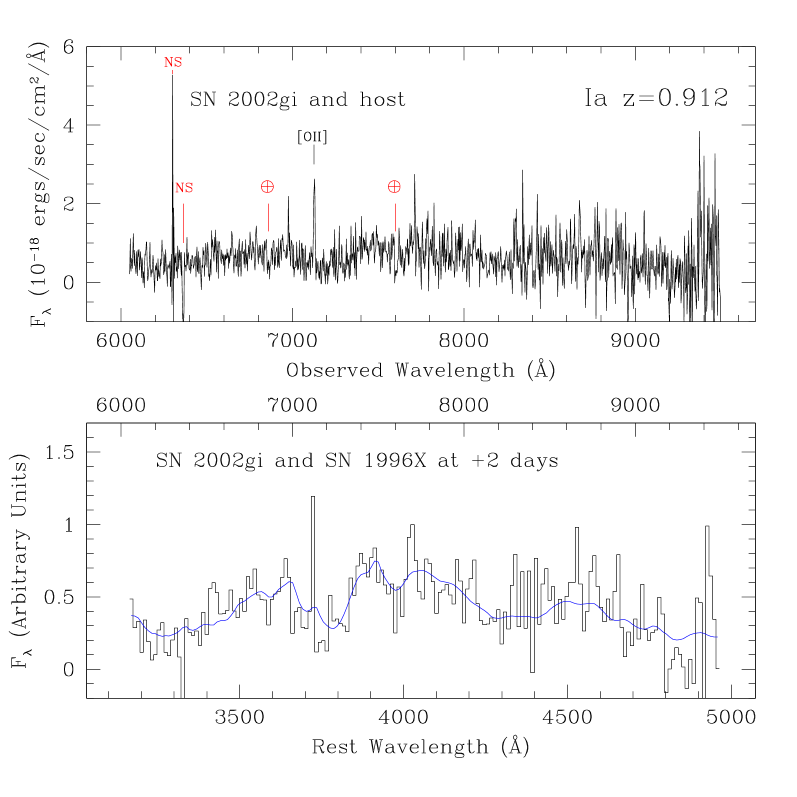
In the comparison plots, nearby SNe are shown in blue, while the observations minus the host galaxy template are shown in black. In most cases, the observations have been re-binned to 20 .
The results333T02-047 is not considered since the spectrum was taken many months after it was discovered. are summarized as follows:
-
•
39 candidates were observed.
-
•
20 candidates are classified as SNe Ia.
-
•
1 candidate is classified as a possible Type II supernova.
-
•
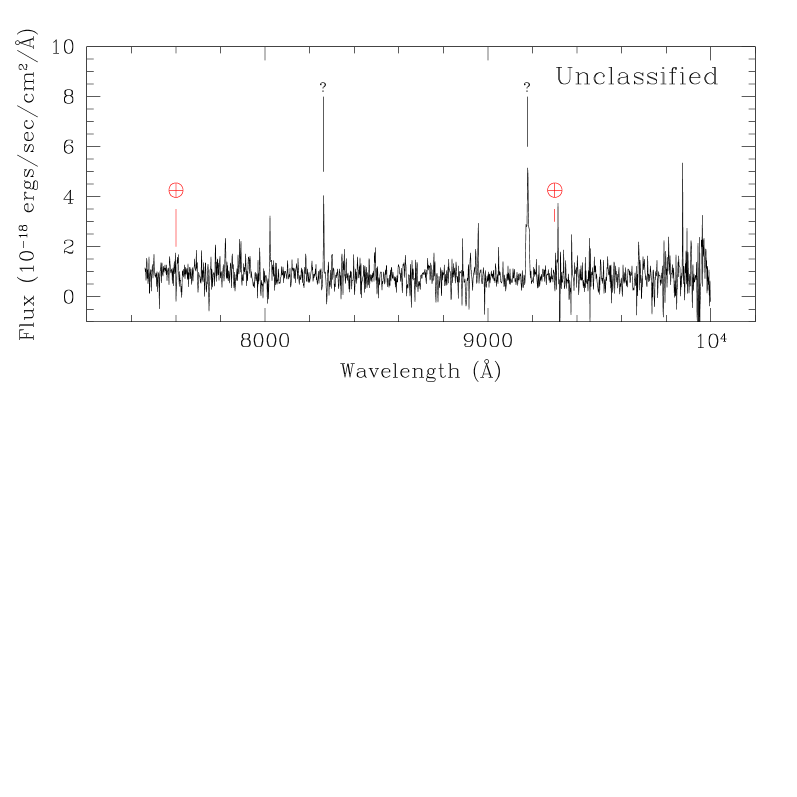
Of the remaining 18 unclassified candidates, labelled with a dash in Table 4, 11 have broad supernova-like spectral features and/or have supernova-like light curves. One of these 11 candidates - SuF02-026 - has two strong emission lines that cannot be identified.
-
•
Of the remaining 7 candidates, 5 have neither clear supernova features nor sufficient photometric follow-up to measure a light curve, but posses a galaxy component from which a redshift can be determined.
-
•
The remaining 2 candidates have featureless continua.
A redshift histogram is shown in Fig. 2. Of the eight candidates that do not have redshifts, three have broad spectral features and two have supernova-like light curves.

| SCP | IAU | Spectroscopic | Redshift | Template | Comments | |
| Name | Name | Classification | Match | |||
| C00-008 | SN 2000fr | Ia | Si II | 0.543 | SN 1990N -7 days | |
| S01-0042 | SN 2001gl | - | - | - | - | Broad spectral features and no detectable host.3 |
| S01-0052 | SN 2001gm | Ia | Si II | 0.478 | SN 1992A +5 days | |
| S01-0072 | SN 2001go | Ia | Si II | 0.552 | SN 1992A +5 days | |
| S01-017 | SN 2001gr | Ia | SF | 0.540 | SN 1996X +2 days | |
| S01-028 | SN 2001gs | - | - | 0.658 | Host dominated. | |
| S01-031 | SN 2001gu | Ia | SF | 0.777 | SN 1999bp +1 day | |
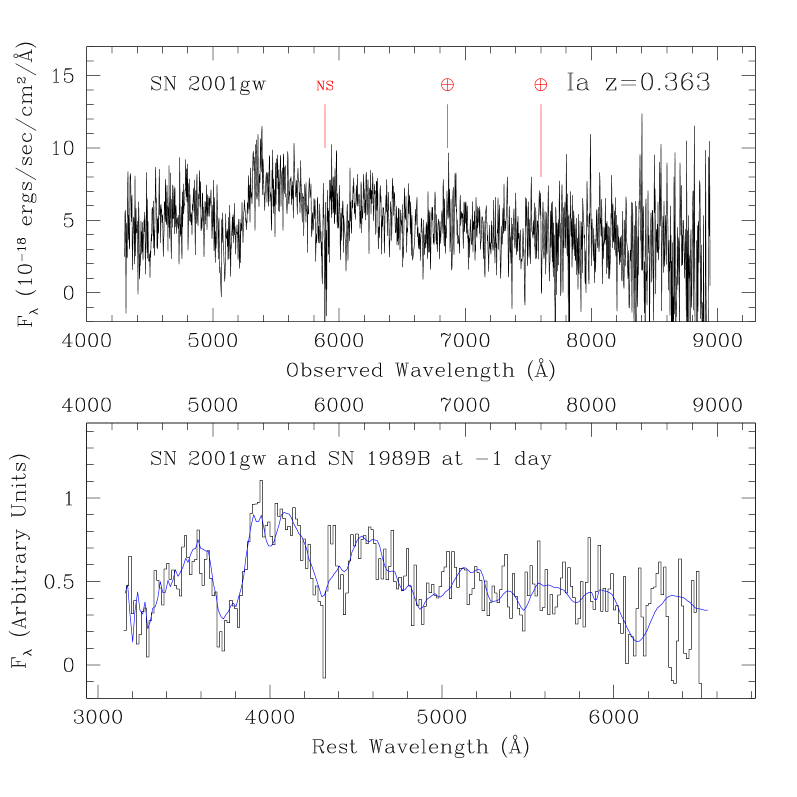
| S01-033 | SN 2001gw | Ia | Si II | 0.363 | SN 1989B -1 day | |
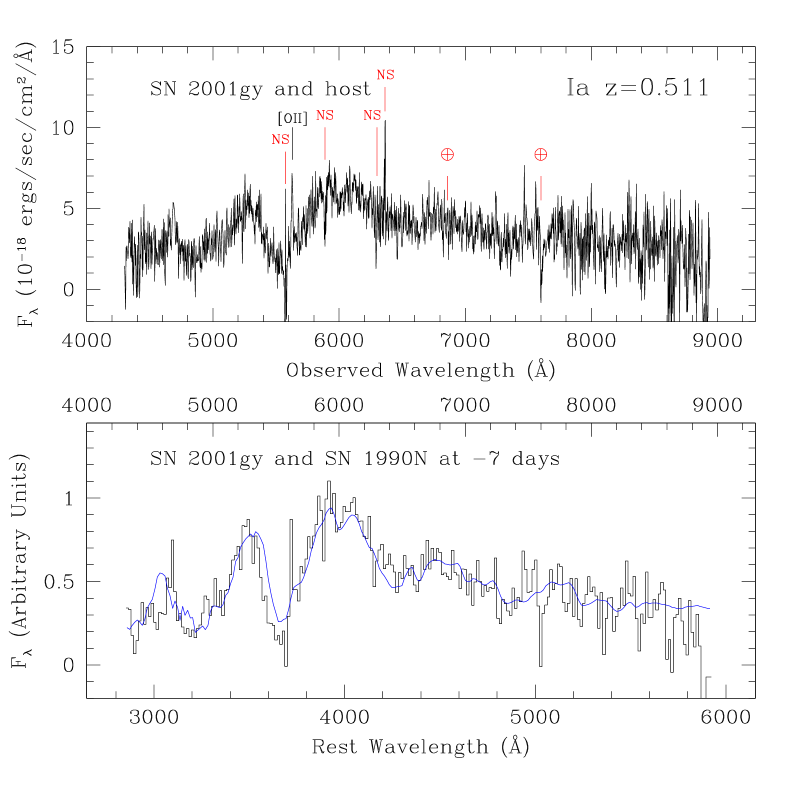
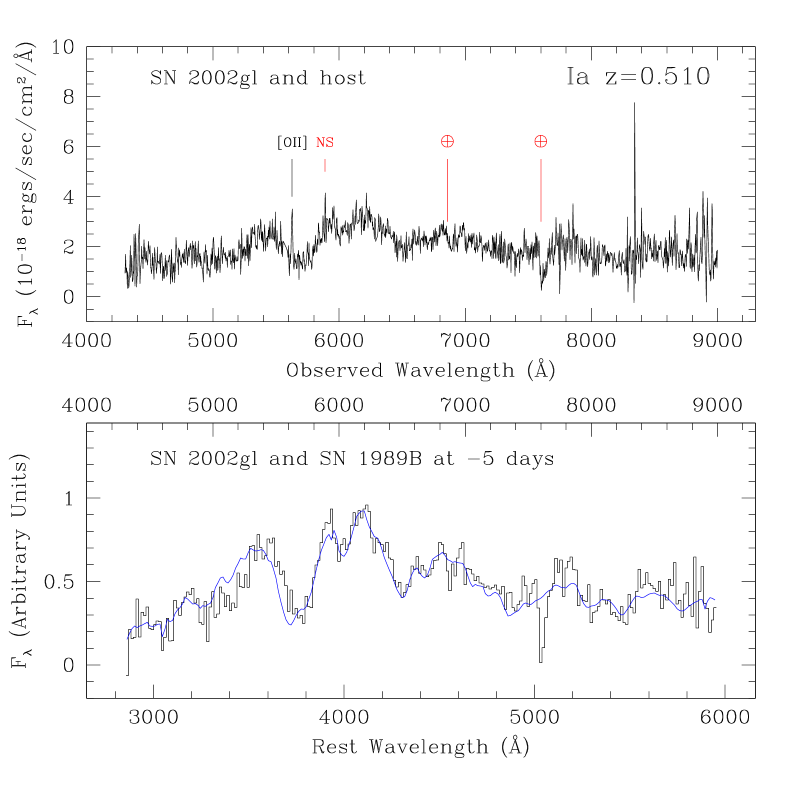
| S01-036 | SN 2001gy | Ia | Si II | 0.511 | SN 1990N -7 days | |
| S01-037 | - | - | - | - | Featureless blue spectra. | |
| S01-054 | SN 2001ha | Ia | Si II | 0.58 | SN 1981B Max. | No detectable host.3 |
| S01-065 | SN 2001hc | Ia | Si II | 0.35 | SN 1981B Max. | Faint host. |
| S02-000 | SN 2002fd | Ia | Si II | 0.279 | SN 1990N -7days | |
| S02-001 | - | - | - | 1.424 | ||
| S02-002 | SN 2002fe | Ia∗ | SF | 1.086 | SN 1999ee -8 days | |
| S02-025 | - | - | - | - | Featureless | |
| S02-075 | SN 2002fg | Ia∗ | SF | 0.78 | SN 1999bm +6 days | |
| C02-016 | SN 2002fr | - | - | 0.303? | Blue spectrum. Supernova-like light curve. | |
| C02-028 | SN 2002fm | - | - | 0.448 | Host dominated. Supernova-like light curve. | |
| Small percentage increase. | ||||||
| C02-030 | SN 2002fp | - | - | 0.352 | ||
| C02-031 | - | II? | SF | 0.541 | SN 1999em Max. | Host dominated. Small percentage increase. |
| C02-034 | - | - | - | 0.243 | Host dominated. Small percentage increase. | |
| T02-015 | SN 2002gi | Ia | Si II | 0.912 | SN 1996X +2 days | |
| T02-028 | SN 2002gj | Ia∗ | SF | 0.45 | SN 1992A +9 days | Small percentage increase. |
| T02-029 | SN 2002gk | Ia | Si II | 0.212 | SN 1992A +6 days | |
| T02-030 | SN 2002gl | Ia | Si II | 0.510 | SN 1989B -5 days | |
| T02-0471 | - | - | - | 0.489 | Supernova-like light curve. | |
| SuF02-002 | SN 2002kq | - | - | 0.823 | Supernova-like light curve. | |
| SuF02-005 | - | - | - | 0.863 | Small percentage increase. | |
| SuF02-007 | - | - | - | 1.16? | SN 1981B Max. | No host.3 Broad spectral features and |
| supernova-like light curve. | ||||||
| SuF02-012 | SN 2002lc | - | - | 1.3? | SN 1999aa -3 days | Broad spectral features. Supernova-like light curve. |
| SuF02-017 | SN 2002kn | Ia∗ | SF | 1.03 | SN 1999bm +3 days | Faint host. Supernova-like light curve. |
| SuF02-025 | SN 2002km | Ia | Si II | 0.606 | SN 1990N -7 days | |
| SuF02-026 | - | - | - | - | Two unidentified lines. Supernova-like light curve. | |
| SuF02-028 | SN 2002kz | - | - | 0.347 | Host dominated. Supernova-like light curve. | |
| SuF02-051 | - | - | - | - | Featureless. No detectable host3 and | |
| supernova-like light curve. | ||||||
| SuF02-060 | SN 2002kr | Ia∗ | SF | 1.063 | SN 1981B Max. | Host dominated. Small percentage increase. |
| Supernova-like light curve. | ||||||
| SuF02-065 | SN 2002ks | Ia | Si II | 1.181 | SN 1981B Max. | |
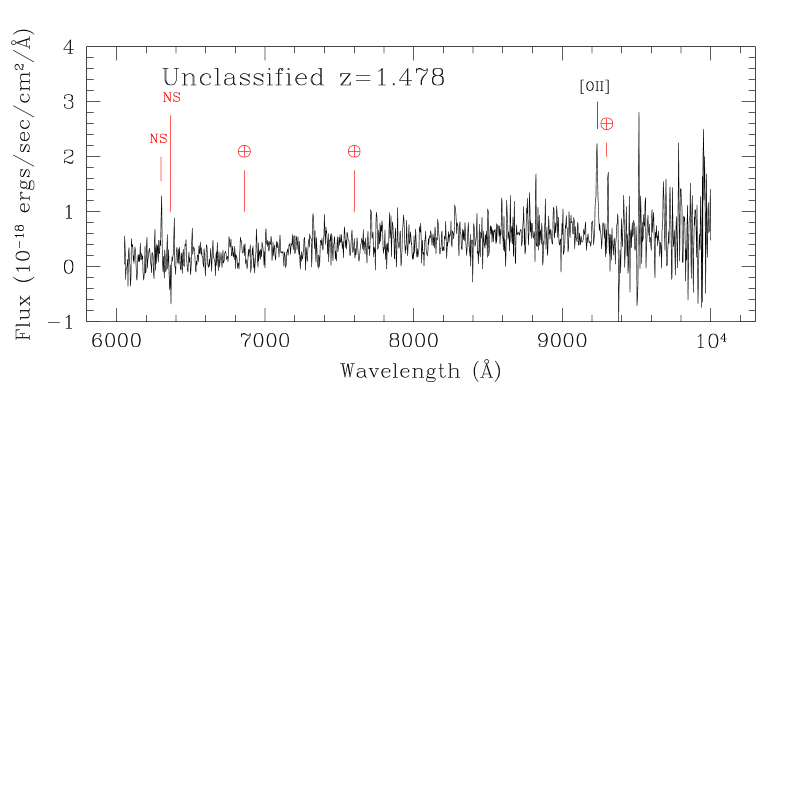
| SuF02-081 | - | - | - | 1.478 | Narrow light curve | |
| SuF02-083 | SN 2002kx | - | - | 1.272 | Small percentage increase. Supernova-like | |
| light curve. | ||||||
1 T02-047 was observed several months after maximum light
2 These candidates were discovered at the CFHT. The remainder of the candidates with the
prefix “S01” were discovered at CTIO.
3 This refers to the reference images. On deeper images, a host might become visible.
5 Discussion
In terms of classifying candidates from the spectra alone, there is a clear correlation between the number of candidates that are classified as SNe Ia and the redshift at which SNe Ia were targeted. In searches 1, 2, 3 and 5, (See Table. 1), where SNe Ia at were targeted for VLT spectroscopic follow-up, 13 out of 16 candidates (excluding T02-049) are classified as SNe Ia. In search 8, where SNe Ia with were targeted for VLT spectroscopic follow-up, 4 out of 13 candidates are classified as SNe Ia.
There are multiple reasons for the large difference. The aim of search 8 was to find several SN Ia and the strategy of the spectroscopic follow-up was tuned to make the best use of the time that was available. In general, each candidate was first observed for one hour. Candidates that were found to have were no longer observed. This included SuF02-002, SuF02-005, SN 2002km and SuF02-028. In one case (SN 2002km) a secure classification could be made. In the other three cases, a supernova might have been identified if we had chosen to integrate longer. Alternatively, if the candidate showed evidence for broad features or if the redshift from host galaxy lines (in particular [OII]) placed the host at , the candidates were re-observed during later nights. As the amount of allocated time was limited, not all promising candidates could be followed. These factors led to a lower overall yield at , but they also enabled us to confirm several SNe Ia and to obtain their redshifts.
Nevertheless, the spectroscopic confirmation of SNe Ia is challenging. At , SNe Ia are about 1.5 magnitudes fainter than at . Additionally, the spectral features that one uses for classification shift further and further into the red where sky subtraction can be difficult because of variable night-sky emission and detector fringing. This can be partially compensated by integrating longer and using instruments and telescopes that are efficient in the 600 to 1000 nm spectral region. Although the spectra of SNe Ia show significant features short-ward of the broad CaII feature at 3900 Å that could be used to aid the classification, the lack of good quality UV spectra for nearby supernovae of all types means that these features cannot be used without using features that are further into the red.
For , which have peak magnitudes near , an additional source of ambiguity appears. Given the typical signal-to-noise that one can achieve with state-of-the-art instrumentation, one can sometimes match the spectra equally well with SNe Ia at two different redshifts. Fortunately, host galaxy lines, either [OII] or H and K or sometimes all three, can be used to measure a precise redshift in most cases. In this paper, SNe 2002fe, 2002gi, 2002kn, 2002kr and 2002ks fall into this category. However, in other cases, such as SuF02-007 and SN 2002lc, there are no clear galaxy lines, even though the spectra of these candidates show broad features.
In terms of classifying candidates from the spectra alone, there is also a correspondence between the selection criteria that are used to select candidates and the percentage of candidates that are spectrally identified as SNe Ia. In the rolling search with the CFHT, none of the 5 candidates could be spectrally confirmed as a SN Ia. For comparison, in the Spring 2002 search with CTIO, all four candidates (excluding T02-049) were confirmed as SNe Ia. Although the numbers are small, they are significant. The search area and candidate selection criteria of the rolling search were such that the search was also sensitive to relatively fainter supernovae (Type II or SN 1991bg-like supernovae) on relatively brighter hosts. The spectra confirm this as many of the candidates from the rolling search are dominated by the light of the host galaxy.
The contribution from the host galaxy can be approximately quantified with the percentage increase in the flux of the candidate between the search and reference images. A small increase usually means a significant amount of host contamination. A very large or formally infinite increase usually means little or no host contamination. The flux is measured over a fixed aperture whose diameter depends on the seeing. The signal-to-noise ratio of the detection over the same fixed aperture provides a measure of the significance of the detection. A low signal-to-noise ratio usually means that the candidate is faint, and this could mean that the candidate, if it is a SN Ia, is either very distant or has been caught very early. In Fig. 4 the signal-to-noise ratio of the detection is plotted against the percentage increase for candidates that were brighter than at the time of discovery.444For the surveys done in R-band, we use Candidates from the CFHT 2002 search are highlighted with large circles. The figure shows that classification from spectroscopy is generally not successful if the percentage increase is below . The boundary of this region is marked with a dashed line in Fig. 4. Candidates in which the percentage increase is less than 25% are thus noted in Table 4.

Not one of the candidates has broad emission lines that would indicate that it is an AGN. This demonstrates that our selection strategy, which selects against candidates having small intensity variations that are also precisely centered on the host galaxy, is quite effective in rejecting AGNs.
In this paper, we have strictly used only the spectra for classification purposes and all the classifications listed in Table 4 are based on the spectra alone. However, in searches like the CFHT Spring 2002 search and the Subaru Fall 2002 search, where spectroscopic confirmation is difficult because the candidates are near relatively bright hosts or because the candidates are relatively faint, additional information such as the light curve or the colour of the candidate can become part of the criteria used for classification. The strategy of these two searches was such that most of the candidates were also monitored during the subsequent weeks and months. Of the 18 candidates that were observed in these two surveys, 5 were spectrally classified as either Ia, Ia∗ or II?. Of the remaining 13 candidates, 10 were followed with sufficient coverage (more than 4 light curve points) and 9 have supernova-like light curves. This includes SN 2002fr, SN 2002fm, SN 2002kq, SuF02-007, SN 2002lr, SuF02-026, SN 2002kz, SuF02-051 and SN 2002kx. These cases are noted in Table 4 and in the comments on individual candidates.
6 Summary
We have presented VLT FORS1 and FORS2 spectra of 39 candidate high-redshift supernovae that were discovered as part of a program to discover SNe Ia over a wide range of redshifts. By comparing these spectra with the spectra of nearby SNe Ia, 20 candidates have been identified as SNe Ia with redshifts ranging from to .
Of the remaining 19 candidates that cannot be spectrally identified as SNe Ia, one candidate might be a Type II supernova at and 11 candidates exhibit broad supernova-like spectral features and/or have supernova-like light curves. Of the final 7 candidates that cannot be confirmed as supernova, (either from the light curves or the spectra), 5 possess a galaxy component, from which redshifts ranging from to have been been measured, and 2 show featureless blue continua.
Acknowledgements.
This work would not have been possible without the dedicated efforts of the daytime and nighttime support staff at the Cerro Paranal Observatory. We thank ECT∗ (European Centre for Theoretical Studies in Nuclear Physics and Related Areas) for the support they provided during the preparation of this paper. The Subaru searches were supported in part with a scientific research grant (15204012) from the Ministry of Education, Science, Culture, and Sports of Japan, and in part by the Japanese Society for the Promotion of Science (a Bilateral Research Program between Japan and USA). The CFHT is operated by the National Research Council of Canada, the Centre National de la Recherche Scientifique of France and the University of Hawaii. The authors would like to thank the CFHT queue team for the efficient operation of the CFHT12k camera. This work was supported in part by the Director, Office of Science, Office of High Energy and Nuclear Physics, of the U.S. Department of Energy under Contract No. DE-AC03-76SF00098. Support for this work was provided by NASA through grants HST-GO-08346.01-A , HST-GO-08585.14-A , HST-GO-09075.01-A , from the Space Telescope Science Institute, which is operated by the Association of Universities for Research in Astronomy, Inc., under NASA contract NAS 5-26555.References
- (1) Aldering, G. 1998, IAUC 7046
- (2) Allen, A. W., Schmidt, R. W., & Fabian, A. C. 2002, MNRAS, 334, L11
- (3) Appenzeller, I., Fricke, K., Fürtig, W., et al. 1998, The Messenger, 94, 1
- (4) Barris, B. J., Tonry, J. L., Blondin, S., .et al. 2004, ApJ, 602, 571
- (5) Bennett, C. L., Halpen, M., Hinshaw, G., et al. 2003, ApJS, 148, 1
- (6) Borgani, S., Rosati, P., Tozzi, P., et al. 2001, ApJ, 561, 13
- (7) Garnavich, P. M., Kirshner, R. P., Challis, P., et al. 1998, ApJ, 493, L53
- (8) Goobar, A. & Perlmutter, S. 1995, ApJ, 450, 14
- (9) Hawkins, E., Maddox, S., Cole, S., et al. 2003, MNRAS, 346, 78
- (10) Howell, D. A. & Wang, L. 2002, AAS, 201, 9103.
- (11) Jaffe, A. H.. Ade, P., Balbi, A., et al. 2001, Phys. Rev. Lett., 86, 3475
- (12) Kniazev, A. Y., Pustilnik, S. A. Grebel, E., et al. 2004, ApJS, 153, 429
- (13) Kodaira,K. Taniguchi,Y. Kashikawa,N. et al. 2003, PASJ, 55L, 17
- (14) Knop, R. A., Aldering, G. A., Amanalluh, R., et al. 2003, ApJ, 598, 102
- (15) Perlmutter, S., Pennypacker, C. R., Goldhaber, G., et al. 1995, ApJ, 440, L41
- (16) Perlmutter, S., Gabi, S., Goldhaber, G., et al. 1997, ApJ, 483, 565
- (17) Perlmutter, S., Aldering, G., della Valle, M., et al. 1998, Nature, 391, 51
- (18) Perlmutter, S., Aldering, G., Goldhaber, G. et al. 1999, ApJ, 517, 565
- (19) Perlmutter, S. and Schmidt, B. 2003, in “Supernovae & Gamma Ray Bursts”, ed. Weller, K. (Springer)
- (20) Riess, A. G., Filippenko, A. V., Challis, P. et al. 1998, AJ, 116, 1009
- (21) Riess, A. G., Strolger, L.-G., Tonry, J. et al. 2004, ApJ, 607, 665.
- (22) Nobili, S. 2004, Ph. D. thesis, Stockholm Univ.
- (23) Schmidt, B. P., Suntzeff, N. B., Phillips, M. M., et al. 1998, ApJ, 507, 46
- (24) Spergel, D. N., Verde, L., Peiris, H. V. et al. 2003, ApJS, 148, 175
- (25) Stern, D. et al. 2000, ApJ, 537, 73
- (26) Tonry, J. L., Schmidt, B. P., Barris, B., et al. 2003, ApJ, 594, 1
Appendix A Finding charts, spectra and notes on individual candidates
This section contains finding charts and spectra of all candidates except SN 2000fr, which are shown in Figs. 1 and 3. The candidates are labelled with either their IAU names or their internal SCP names if no IAU name was assigned.
In the finding charts, North is up and East is to the left. The candidate is marked with a cross and bright pivot stars are marked with either a box or a hexagon. Fainter pivot stars are circled and labelled alphabetically. The pivot star that was used during the acquisition is recorded in Table 3. The finding charts were created from the images that were taken during the reference and search runs. Regions that appear blank are regions that are outside the field of view.
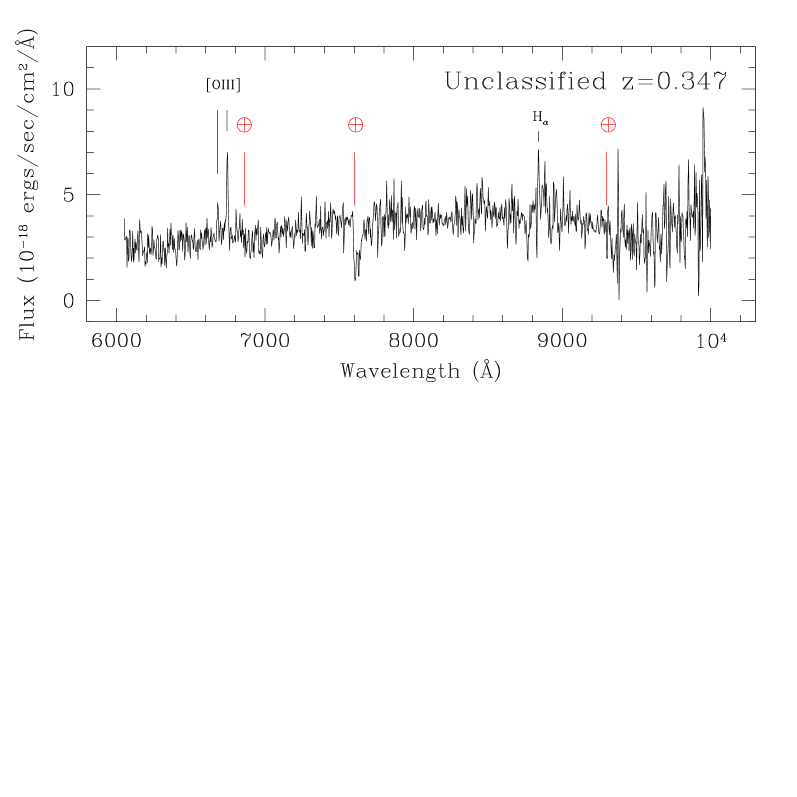
In general, the spectrum of the candidate is plotted twice. In the upper spectrum, the unbinned spectrum of the candidate is plotted in the observer’s frame and is uncorrected for host galaxy light. Night sky subtraction residuals are marked with the letters “NS” and telluric absorption features are marked with the symbol . In the lower spectrum, the spectrum is rescaled, contamination from the host (if any) is removed, an extinction correction is applied and the spectrum is re-binned, typically by 20 Å. This spectrum is plotted in black and it is plotted in both the rest frame (lower axis) and the observer’s frame (upper axis). For comparison, the best fitting nearby supernova is plotted in blue. The extinction correction can correct for extinction either in the host or the comparison spectrum. If the candidate could not be classified, only the upper spectrum is plotted.