Discovery of Irradiation Induced Variations in the Light Curve of the Classical Nova Cygni 2001 No.2 (V2275 Cyg)
Abstract
We present the CCD photometry, light curve and time series analysis of the classical nova V2275 Cyg (N Cyg 2001 No.2). The source was observed for 14 nights in total using an filter in 2002 and 2003 with the 1.5 m Russian-Turkish joint telescope (RTT150) at the TUBITAK (The Scientific and Technical Research Council of Turkey) National Observatory in Antalya Turkey, as part of a large program on the CCD photometry of Cataclysmic Variables (CVs). We report the detection of two distinct periodicities in the light curve of the nova : a) P1=0.31449(15) d – 7.6 h, b) P2=0.017079(17) d – 24.6 min. The first period is evident in both 2002 and 2003 whereas the second period is only detected in the 2003 data set. We interpret the first period as the orbital period of the system and attribute the orbital variations to aspect changes of the secondary irradiated by the hot WD. We suggest that the nova was a Super Soft X-ray source in 2002 and, perhaps, in 2003. The second period could be a QPO originating from the oscillation of the ionization front (due to a hot WD) below the inner Lagrange point as predicted by King (1989) or a beat frequency in the system as a result of the magnetic nature of the WD if steady accretion has already been re-established.
keywords:
novae, cataclysmic variables - stars: individuals: V2275 Cygni - accretion, accretion disks - stars: binaries - eclipsing - stars: oscillations - stars: white dwarf1 INTRODUCTION
Classical novae are a subset of cataclysmic variables which are interacting binary systems hosting a main-sequence secondary (sometimes a slightly evolved star) and a collapsed primary component, a white dwarf (Warner 1995). An outburst on the surface of the white dwarf as a result of a thermonuclear runaway in the accreted material causes the ejection of 10-3 to 10-7 M⊙ of material at velocities up to several thousand kilometers per second (Shara 1989; Warner 1995). V2275 Cyg (Nova Cyg 2001 No.2) was discovered at a magnitude 7.0-8.8 on 2001 August 18 simultaneously by Nakamura et al. (2001) and Nakano et al. (2001). Early optical spectroscopy showed hydrogen Balmer lines with P Cygni profiles and H lines indicating expansion velocities of 1700 km s-1 (Ayani 2001). At later stages, high energy coronal lines were found to dominate the spectrum (e.g., [Si X], [Si IX] and [Al IX]). The nova was found to belong to the ”He/N” subclass of novae defined by Williams (1992), because of the broad lines of H, He and N in its spectrum (Kiss et al. 2002). In addition, Kiss et al. (2002) measured t2=2.90.5 d, t3=71 d and MV= -9m.70.m7 which were used to derive a distance of 3-8 kpc for the nova. A USNO star of =18m.8 and =19m.6 was suggested as a possible progenitor star (Schmeer et al. 2001).
This paper is on the CCD photometry of V2275 Cyg covering years 2002 and 2003 obtained with the 1.5 m Russian-Turkish joint telescope (RTT150) at the TUBITAK National Observatory (TUG) in Antalya, Turkey. We present the discovery of a distinct period reported by Balman et al. (2003) (which we mark as P1) and the detection of a highly coherent QPO (Quasi-periodic oscillations) on 6 different nights in 2003 (using , , filters). Fast variations from V2275 Cyg similar to this second period (which we mark as P2) were also reported by Garnavich et al. (2004) derived from a data set of two nights obtained with a filter.
| UT | Time of Start | Run | Number of | Filter |
|---|---|---|---|---|
| Date | (HJD-2452000) | Time (hr) | Frames | |
| 020610 | 436.484518 | 1.8 | 30 | R |
| 020612 | 438.486060 | 1.9 | 29 | R |
| 021001 | 549.246533 | 7.1 | 88 | R |
| 021002 | 550.248770 | 5.3 | 68 | R |
| 021003 | 551.256457 | 5.9 | 99 | R |
| 021005 | 553.293507 | 5.4 | 80 | R |
| 021201 | 610.238175 | 1.5 | 40 | R |
| 021222 | 631.188612 | 2.9 | 68 | R |
| 030825 | 877.367836 | 5.8 | 136 | R |
| 030826 | 878.376911 | 4.1 | 114 | R |
| 030827 | 879.299621 | 7.5 | 204 | R |
| 031101 | 945.196586 | 6.2 | 81,82 | R,I |
| 031102 | 946.208050 | 5.6 | 65,64 | R,V |
| 031228 | 1002.221443 | 2.0 | 23,23 | I,V |
2 OBSERVATIONS AND DATA REDUCTION
V2275 Cyg is observed during 8 nights in 2002 and 6 nights in 2003 using the standard filters (Johnson and Cousins) at TUG (see Table 1 for a time table of observations). The data are obtained with the imaging CCD (a Loral LICK3 20482048 pixels back illuminated CCD chip at 0.26 arcsec/pix resolution) on 2002 June 10, 2002 June 12 and Ap47p CCD (10241024 pixels with 13 microns/pix resolution) on 2002 October 1-5, 2002 December 01, and 2002 December 22. The rest of the data are taken with the ANDOR CCD (20482048 pixels at 0.24 arcsec/pix resolution) on 2003 August 25-27 and the imaging CCD on 2003 November 1-2. The exposure time is 90 seconds for each frame. A total of 1149 images are obtained in the R band and reduced using standard procedures calibrating the frames with the bias/dark current frames and dome flat fields. In addition, a total of 105 frames in the band and 87 frames in the band have been compiled for comparison (in 2003 November 1-2; in 2003 December 28). After the raw data are cleaned and calibrated, the instrumental magnitudes of the nova are derived by the PSF fitting algorithms DAOPHOT (Stetson 1987) and ALLSTAR in the MIDAS software package (version 02FEBpl1.0 and 03FEBpl1.0) using 25 stars as PSF stars. Also, another reference group of four constant stars close to the nova in the same field is formed in order to reduce the scintillation effects and to derive the relative magnitudes. The calibrated apparent magnitude of the nova in the R band varied in the range from 15m.1 to 16m.2 in 2002. The fading of the nova continued, changing this range to 17m.3–19m.0 in 2003.
3 ANALYSIS AND RESULTS
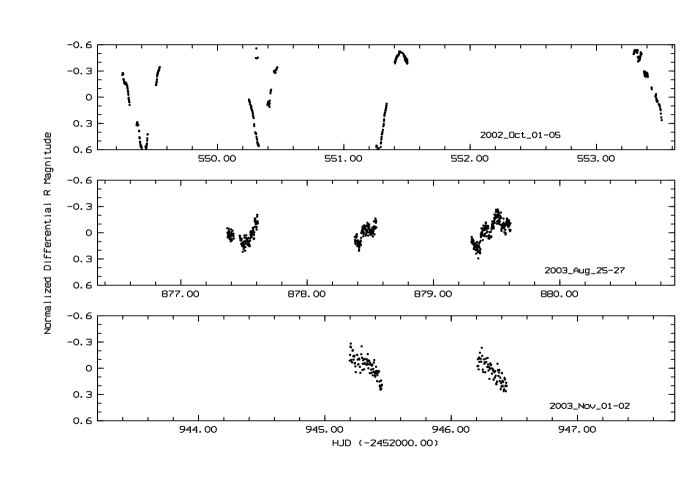
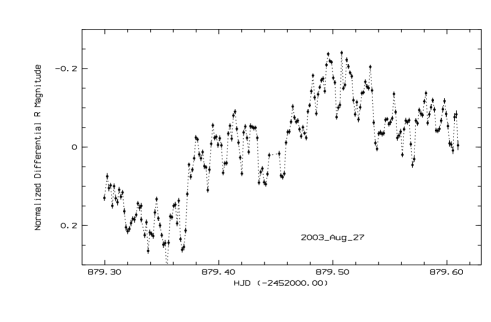
Using our reduced and calibrated band data, we constructed light curves for the given nights in Table 1. A collection of normalized light curves obtained from runs that are longer than 5 hrs is displayed in Fig. 1. The top panel is of 2002 October 01-05, the middle panel is of 2003 August 25-27 and the bottom panel is of 2003 November 01-02. A Deep modulation of the light curve can be seen in Fig. 1. Figure 2 shows the data obtained in the longest run (7.5 hr) on 2003 August 27. This figure, not only reveals the long period that is causing the deep modulation (which we mark as P1), but also the other sumperimposed faster variations (which we mark as P2) and humps that are observed in the system.
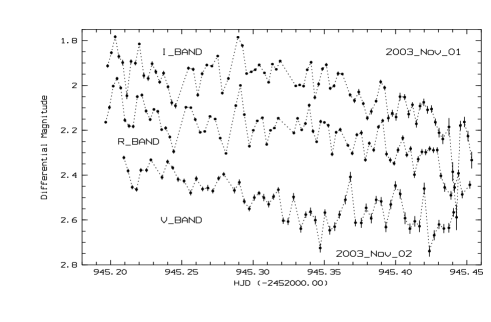
We also accumulated data using the standard filter on 2003 November 01 and filter on 2003 November 02 together with the filter observations (see Fig. 3). The short timescale variations (which we mark as P2) are apparent in the figure. Subtraction of a linear trend from the and band light curves in Fig. 3 suggests that the long period variations (i.e., P1) are larger in amplitude in the and bands than the band which can be expected (see Discussion).
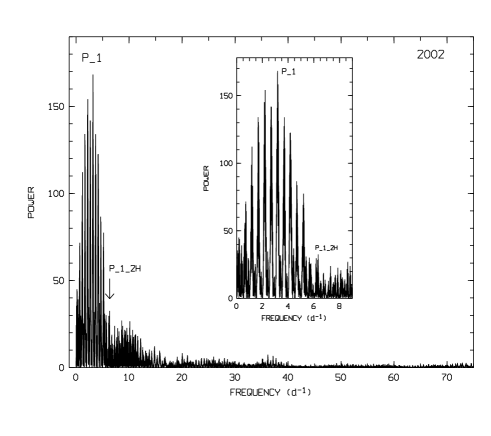
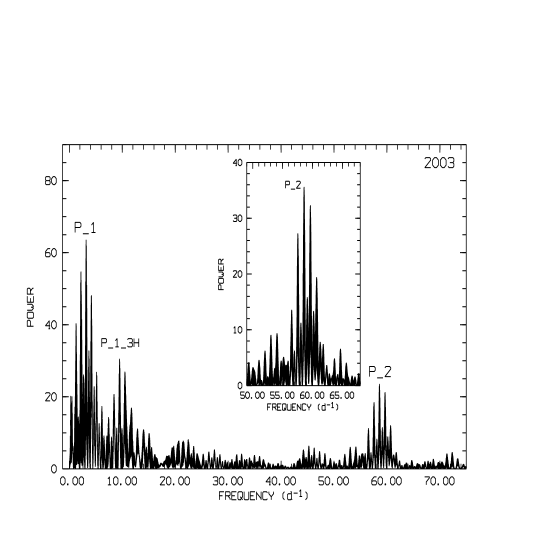
We performed fourier analysis of the time series obtained from the data in order to derive the periods of these modulations. In general, several standard programs have been used like the Scargle Algorithim (Scargle 1982) and Discrete Fourier Analysis using Leahy normalization (Leahy et al. 1983). Figure 4 shows the power spectrum of the data for the year 2002 and Fig. 5 for the year 2003 where the Scargle algorithm is used to calculate the power spectra. The detection limit of a period at the 3 confidence level (99) is a power of 14.2 in Fig. 4 (2002 data) and 15.6 in Fig. 5 (2003 data) (see also Scargle 1982). In order to correct for the effects of windowing and sampling functions on power spectra, synthetic constant light curves are created and a few very prominent frequency peaks that appear in these light curves are prewhitened from the data in the analysis. Before calculating the power spectra, the individual or consecuitive nights are normalized by subtraction of the mean magnitude. Moreover, when necessary, the red noise in the lower frequencies is removed by detrending the data.
We found a prominent period at P1=0.31449(15) d using the whole data set.
The power spectra in Fig. 4 and Fig. 5
show the highest peak at this period
and the group of peaks around
it are some of the 1/3, 1/2, 1, and 2 day
aliases of the detected period.
In Fig. 4 (2002 data) a weak second harmonic of P1 (P1/2) is present (it is significant).
In Fig. 5 (2003 data) the third harmonic
of P1 (P1/3) is also present, but the second harmonic is not significantly detected.
The period (P1) shows an amplitude variation of
0.m420.m06 in 2002 (measured by fitting a sine wave).
The amplitude of the variations are decreased significantly in
2003 to 0.m220.m12 .
The decrease in modulation depth is about 50 (in magnitude).
The ephemeris for P1 determined by fitting a sine curve are :
Tmin= HJD 2452549.4163(0.0154) + 0.31449(0.00015)E
We also detect a second periodicity at P2=0.017079(17) with an amplitude of 0.m030.m01. These rapid variations are revealed in all the nights in 2003 with varying intensity. They are also clearly seen in Figs. 2 and 3 (in the , , bands). We do not recover the beat period between P2 and P1 in the 2003 data set.
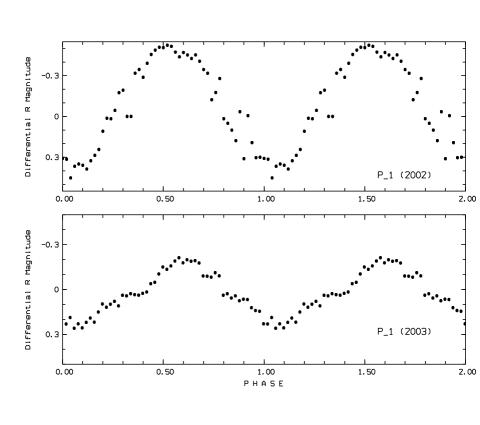
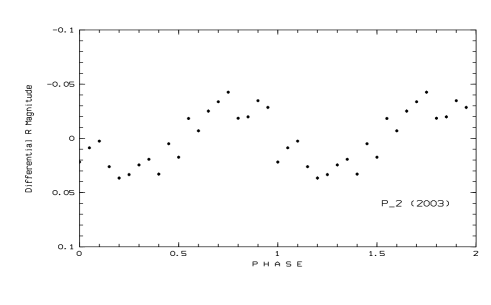
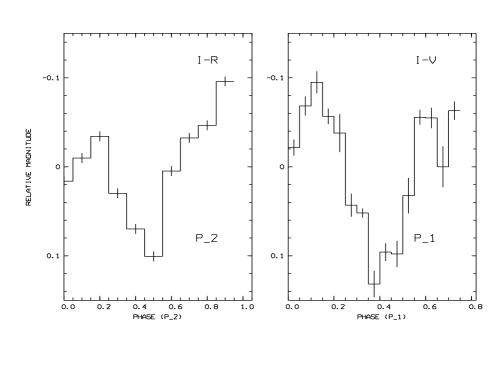
Figures 6 and 7 display the mean light curves folded on P1 using the 2002 and 2003 data set, and P2 using the 2003 data set, respectively. The shape of the profiles are sinusoidal for both P1 and P2 (in 2002-2003) with a slight asymmetry. Hump-like features are apparent on both profiles, as well. The ingress in the mean light curve of P1 and P2 is shorter by 10 of the photometric phase than the egress. In adition, we have constructed color diagrams , , and to search for color variations over the photometric phases of the periods (light curves are calibrated before the construction of the color diagrams). The right-hand panel of Fig. 8 shows the existence of a significant modulation of the color difference over the photometric phase of P1. The magnitudes plotted on the left-hand panel of Fig. 8 indicates color variation over the photometric phase of the second period as well.
4 DISCUSSION
We presented 14 nights of data on V2275 Cyg obtained with the TUG 1.5 m telescope using mainly standard filters in 2002 and 2003. We discover large modulations =0.42 at P1=0.31449(15) d in the light curve of the classical nova in 2002 and the amplitude of this modulation decrease to =0.22 in 2003. This period is discovered in the and the band as well. Since the periodicity is persistent and coherent, we propose that this is the binary period of the system. The orbital period can be detected as a result of the aspect variations of the secondary due to heating from the hot WD (Kovetz, Prialnik, Shara 1988). The decrease in the modulation depth from 2002 to 2003 and the color variations (, , ) support a scenario where the heated secondary is the source of the light and the color variation rather than a hot spot on the disk. The Mass-Period relation M20.11Phr (Warner 1995) yields a secondary mass of about 0.83 M⊙ for V2275 Cyg using the discovered binary period in this paper, which is in accordance with the fact that a massive secondary will be hot and prone to irradiation effects. In addition, the mean light curves (Fig. 6 and 7) indicate an asymmetry in the R band as would be expected from the differential rotation of the secondary spreading the heated atmosphere into a nonspherical shape (tear-drop model). An eclipse can be ruled out because the modulation amplitude would be larger in time as observed for some other novae (e.g., V838 Her: Leibowitz et al. 1992, V1494 Aql: Kato et al. 2004). A recent search for variations/periodicities in the light curve of faint CVs (including old novae) reveals that irradiation yields larger amplitude for modulations (Woudt Warner 2003a,b) as detected in our study.
After a nova explosion, the hot WDs are candidates for heating their cooler companion. Some classical nova systems were recovered to show this irradiation effect like: (1) V1500 Cyg (N Cyg 1975) which showed an unperturbed temperature of 3000 K for the secondary and 8000 K for the heated side (Schmidt et al. 1995; Somers Naylor 1999); (2) DN Gem (N Gem 1912) (Retter, Leibowitz Naylor 1999); (3) WY Sge (N Sge 1783) which indicated that the accretion luminosity from the disk could even be responsible for the irradiation of the secondary (Somers, Ringwald Naylor 1997). However, only one of such systems resemble V2275 Cyg closely: orbital modulations due to aspect variations of the heated face of the secondary was detected for Nova Cygni 1992 (V1974 Cyg) at the outburst stage (about a year and a half after outburst) by DeYoung Schmidt (1994) before the WD cooled to a point where it was no longer a strong X-ray source. The orbital variations in V1974 Cyg were 0.1 in the band and 0.05 in the band when the H-burning had just turned-off (the WD temperature was about 3-4 105 K; Balman et al. 1998). V1974 Cyg was discovered as a Super Soft X-ray source (SSS) while burning the hydrogen over its surface (Balman et al. 1998 and references therein) consistent with the fact that most novae are expected to be a SSS at a certain point during their outburst stage (see Krautter 2002 for a review). A hot WD at a temperature above 1105 K (i.e., emits mostly in the soft X-ray wavelengths) with a radiative wind can be the source of an ionization front irradiating the secondary star. Therefore, we suggest that V2275 Cyg was also a SSS during 2002-2003, and the radiative winds/ionization front of a SSS reaching out well into the photosphere of the secondary, can explain the observations of V2275 Cyg in 2002. The decrease of 50 in the modulation depth from 2002 to 2003 is another indication of the changing conditions in the ionization front. The strong third harmonic of P1 detected in 2003 could support the existence of several hot zones over the total surface of the secondary along with the significantly heated inner face resulting in the higher harmonics becoming prominent.
We also detected another periodicity P2=0.017079(17) d in the light curve of 2003. We suggest that this is a highly coherent QPO from the system. The power of the signal varies on different nights (independent of length of the observation together with the small changes of the periodicity which differ according to the color (i.e., filter). The characteristics of the oscillations revealed in 2003 does not strongly support a WD-spin period as the origin. The timescale and characteristics of the QPOs (1475 s) resemble flickering, or reprocessing from blobs orbiting within the inner regions/magnetosphere of the accretion disk in accreting CVs. It could also be the beat period between the spin period and the orbital period of the system (P1). However, since the nova is still in its early outburst stage during the TUG observations, it is not clear whether the disk is completely disrupted, or if re-established, the accretion is steady, sporadic or unstable. For example, the existence of an accretion disk was revealed in V1974 Cyg two years after the outburst (Retter et. al 1997) which was long after the discovery of the variations due to irradiation of the secondary.
There have been recent detections of oscillations in classical nova systems of about 2500 s (V1494 Aql: Drake et al. 2003) and 1300 s (V4743 Sgr: Ness et al. 2003) in the X-ray wavelengths. These oscillations are attributed to expected WD pulsations (i.e., nonradial nonadiabatic modes) from the 1.5 105 K and L2000L⊙, hot WDs (Starrfield et al. 1985). The P2 detected in V2275 Cyg is similar to these in timescale. However, it is expected that the higher luminosity (a factor of 10) and the temperature (a factor of 4-5) of the WDs, as the H is burned over the surface, should decrease the pulsational timescale (Starrfield et al. 1985), which makes this scenario unfavorable for V2275 Cyg. In addition, the 2002 data set should have revealed the same oscillations, if they were solely due to WD pulsations.
A more plausible explanation for the origin of P2 is, yet again, the effect of an ionization front (IF) resulting from an alleged SSS phase and the radiative winds of the WD in the outburst stage. If the IF reaches well into the photosphere of the secondary, favorable conditions could result in ionization over the face of the secondary (IF penetrates photosphere) resulting in ”boiling off” (may be ”ripping off”) material from a dense static/neutral medium which could be the case in 2002. If IF does not reach as far as the photosphere, it could still reach out below the inner Lagrangian point (L1 : a sonic point) where conditions can not be steady and the IF then oscillates on a timescale of the order of the dynamical timescale of the secondary near L1 which could result in QPOs as suggested by King (1989). This oscillation time scale is proportional to tqpoH/cs (scaleheight/sound-speed) which is equivalent to tqpo(R3/GM)1/2176 Phr. Given the orbital period derived in this paper (P1), the predicted oscillation period of L1 is similar to P2 (assuming the size R of the secondary will be larger on the equatorial plane). By late 2003 the IF could be withdrawn toward the WD irradiating only the inner Lagrangian point (L1) which yields the QPOs.
5 CONCLUSIONS
We detected two periodicities in the light curve of the classical nova V2275 Cygni (2001). The first one is 0.31449(15) d which we attribute to the orbital period of the binary system. The modulation depth of the mean light curve folded on this period indicates a change from 0m.420m.06 to 0.m220.m12 over the course of one year. We propose that these variations are due to the illumination of the secondary by the hot WD where the aspect variations of the heated/irradiated secondary reveals the binary period of the system. The reduction in the modulation depths indicates the changing conditions in the ionization front at the location of the secondary. This highly ionizing radiation could originate from a hot WD which went through a Super Soft X-ray phase while burning H on its surface. We also detect a second period 0.017079(17) d in the year 2003 which we interpret as a QPO from our data in 2002-2003. For the origin of this period we propose either a magnetic cataclysmic variable scenario (e.g, the interaction of blobs with the magnetosphere) or a scenario where the QPOs are a result of oscillations of the inner lagrangian point (L1) due to irradiation from a cooling hot WD. Both scenarios indicate that some form of accretion is being established in the nova system after the outburst. Our preliminary analysis reveal that both periods exist in 2004 data and the modulation depth of the first period is further reduced. The photometric observations of V2275 Cyg in 2004 (still conducted at TUG) should reveal the changing shape and depth of the orbital modulations and QPOs which will, inturn, portray the evolution of the WD itself.
Acknowledgments
We would like to thank an anonymous referee for critical reading of the manuscript]. We also thank the TUBITAK National Observatory Institute and Ü. Kızıloğlu for the support of the observations. We thank Tansel Ak for obtaining data for us. SB also acknowledges the support by the Turkish Academy of Sciencies TUBA-GEBIP fellowship (Distinguished Young Scientist Award). AR was partly supported by a postdoctoral fellowship from Penn State University.
References
- Ayani (2001) Ayani K., 2001, IAUC, 7686, 3
- Balman (1998) Balman S., Krautter J., Ögelman H., 1998, 499, 395
- Balman (2003) Balman S., Yilmaz A., Retter A., Ak T., Saygac T., Esenoglu H., Aslan Z., 2003, IAUC, 8074, 3
- Deyoung (1994) DeYoung J.A., Schmidt R.E., 1994, ApJ, 431, L47
- Drake (2003) Drake J. et al., 2003, ApJ, 584, 448
- Garnavich (2004) Garnavich P.M., Macdonald A.J., Wu, B., Easterday S.M., Libal, A.J., Palumbo A., Quinn, M.A., 2004, IBVS, 5519
- Kato (2004) Kato T., Ishiuka R., Uemura M., Starkey D.R., Krajci T., 2004, PASJ, 56, 125
- King (1989) King A.R, 1989, MNRAS, 241, 365
- Kiss (2002) Kiss L.L., Gogh N., Vinko J., Furesz G., Csak B., DeBond, H., Tompson J.R., Derekas A., 2002, AA, 384, 982
- Gilman (1988) Kovetz A., Prialnik D., Shara M.M., 1988, ApJ, 325, 828
- Krautter (2002) Krautter J., 2002, in Classical Nova Explosions, AIP Conf. Proc., Vol. 637, ed. M. Hernanz, J. Jose, 345
- Leahy (1993) Leahy D.A., Elsner R.F., Weisskopf M.C., 1983, 272, 256
- Leibowitz (1995) Leibowitz E.M., Mendelson H., Mashal E., Prialnik D., Seitter W.C., 1992, ApJ, 385, L49
- Nakamura (2001) Nakamura A., Tago A., Abe H., 2001, IAUC, 7686, 2
- Nakano (2001) Nakano S. et al., 2001, IAUC, 7687
- Ness (2003) Ness J-U. et al., 2003, ApJ, 594, L127
- Retter (1999) Retter A., Leibowitz E.M., Naylor T., 1999, MNRAS, 308, 140
- Retter (1997) Retter A., Leibowitz E.M., Ofek E.O., 1997, MNRAS, 286, 745
- Schmeer (2001) Schmeer P. et al., 2001, IAUC, 7688
- Scargle (1982) Scargle J.D., ApJ, 263, 835
- Shara (1989) Shara M., 1989, PASP, 101, 5
- Somers (1989) Somers M.W., Naylor T., 1999, AA, 352, 563
- Somersa (1989) Somers M.W., Mukai K., Naylor T., 1996, MNRAS, 278, 845
- Sumner (1985) Starrfield S., Cox A.N., Kidman, R.B., Pensnell W.D., 1985, ApJ, 293, L23
- Stetson (1987) Stetson P.B., 1987, PASP, 99, 191 AA, 312, 121
- Williams (1992) Williams R.E., 1992, AJ, 104, 725
- Warner (1995) Warner B., 1995, Cataclysmic Variable Stars, (Cambridge University Press, Cambridge)
- Woudt (2003a) Woudt P.A., Warner B., 2003a, MNRAS, 339, 731
- Woudt1 (2003b) Woudt P.A., Warner B., 2003b, MNRAS, 340, 1011