Symmetry in the changing jets of SS 433
and its true distance from us
Abstract
We present the deepest yet radio image of the Galactic jet source, SS 433, which reveals over two full precession cycles ( days) of the jet axis. Systematic and identifiable deviations from the traditional kinematical model for the jets are found: variations in jet speed, lasting for as long as tens of days, are necessary to match the detailed structure of each jet. It is remarkable that these variations are equal and opposite, matching the two jets simultaneously. This explains certain features of the correlated redshift residuals found in fits to the kinematic model of SS 433 reported in the literature. Asymmetries in the image caused by light travel time enabled us to measure the jet speeds of particular points to be within a range from to , consistent with, yet determined independently from, the speeds derived from the famous moving optical emission lines. Taken together with the angular periodicity of the zigzag/corkscrew structure projected on the plane of the sky (produced by the precession of the jet axis), these measurements determine beyond all reasonable doubt the distance to SS 433 to be kpc, significantly different from the distance most recently inferred using neutral hydrogen measurements together with the current rotation model for the Galaxy.
1 Introduction
SS 433 is famous as the first known relativistic jet source in the Galaxy. Red- and blue-shifted optical lines, indicating velocities of , were discovered by Margon et al (1979a, b) and interpreted as being from gas accelerated in oppositely-directed jets (Fabian & Rees, 1979; Milgrom, 1979). Margon (1984) successfully fitted a kinematic precessing jet model, finding an intrinsic jet speed of , a precession period of , a cone opening angle of , and an inclination to the line-of-sight of the precession axis of . Subsequent radio imaging was consistent with this model (e.g., Hjellming & Johnston, 1981; Vermeulen et al, 1987, 1993), with the images of Hjellming & Johnston (1981) resolving ambiguities in the parameters from optical studies.
While optical spectroscopic data observed over many precession cycles (e.g. Margon, 1984; Eikenberry et al, 2001) have confirmed the basic parameter values of what has come to be known as the kinematic model, a detailed analysis of any deviations of the data from this model is hindered by inherent degeneracies in the parameters to be fitted, since the measurement is that of line-of-sight Doppler shifts. Detailed analyses from quasi-daily milli-arcsec scale monitoring are similarly afflicted by such degeneracies since, for example, a variation in observed proper motion can in principle arise from changes in jet velocity projected on the plane of the sky, or changes in the angle the jet axis makes with our line-of-sight, perhaps caused by a change in precession rate. Moreover, in milli-arcsec scale monitoring only a limited fraction of the precession period of 162 days has been sampled to date. However, the extended and spatially resolved jet output observed over several arcseconds, while not time-resolved in the conventional sense, is an historical record of the geometry of the jet ejection over two complete precession periods.
2 The deepest yet image of SS 433
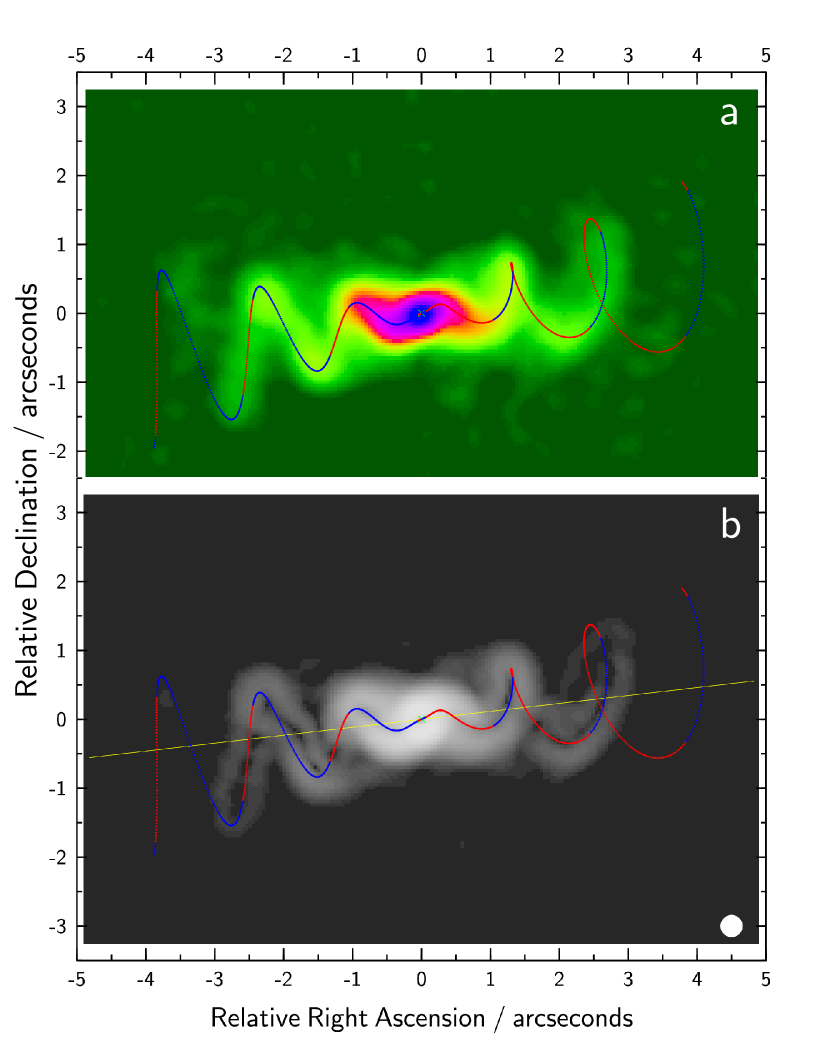
On 2003 July 10, SS 433 was observed for 10 hrs with the VLA in its most extended A-configuration. The primary flux calibrator was 3C 286 and the secondary calibrator was 1922+155. The data were reduced using standard techniques within the AIPS software and the rms background noise was 29 Jy/beam. The resulting total intensity image is shown in Fig 1a and reveals two oppositely directed jets, each of which can be followed over more than 2 complete precession periods. The compression to a zigzag on the sky of the eastern (mainly approaching) jet and corkscrewing of the western (mainly receding) jet, both due to the finite speed of light, are remarkably clear. Superimposed on the image is the path traced on the sky in the simple kinematic model of Hjellming & Johnston (1981), assuming a jet speed of , period 162 days and a distance of 5.5 kpc. The match in Fig 1a is sufficiently good for it to be obvious that if the mean speed is and the period 162 days then the distance to SS 433 is 5.5 kpc with an uncertainty of perhaps kpc. If the true distance were 3.1 kpc (Dubner et al, 1998) the path traced on the sky would, for a speed of , have almost twice the angular periodicity. The image could only be (approximately) matched for a mean speed of . Then the bolides would have had to decelerate from (Eikenberry et al, 2001) and in doing so have lost MeV per hydrogen atom, two thirds of the original bulk energy, in a distance less than light days. We regard this as so implausible that one might conclude without further analysis that the distance to SS 433 is kpc. However, we establish this distance below without assuming the mean speed.
3 The true distance to SS 433
Close inspection of Fig 1a shows that the real trace departs from the simple kinematic model significantly. This is clearer in Fig 1b. The image shown is that of Fig 1a but with a Sobel operator having been applied to delineate the ridgeline. The Sobel operator (Sobel, 1990) is a simple edge detect filter which is widely used in magnetic resonance imaging of brains. The algorithm generating the filter computes the square root of the sum of the squares of the directional derivatives in two orthogonal directions. The ridgeline shows up as dark since the gradient changes from positive to negative across the jet profile.
Distortions in the image introduced by the finite speed of light are independent of distance so in the absence of such detailed departures as are evidence in Fig 1, the jet speed and hence the distance would be extremely accurately determined. Nonetheless, the speed can be determined quite accurately under the assumptions that the jets are symmetric and that special relativity is correct: for a pair of bolides launched simultaneously but ejected in opposite directions, each having velocity of magnitude in units of and making an angle to our line-of-sight, the ratio of their separations from the central core is given by
| (1) |
where is the separation of the bolide which is approaching us from the central core projected on the plane of the sky and is the same for the receding bolide. The validity of the assumption of symmetry is established in § 4.
A comparison of the separations from the central core to opposite pairs of well-defined points where the ridgeline crosses the mean jet axis (shown as the yellow line in Fig 1b) yielded speeds of , , and hence a distance of kpc. Note that this is independent of assumptions from optical data, in contrast with previous estimates. This value of the distance is rather larger than that derived from quasi-daily milli-arcsec monitoring (Stirling et al, 2002), which is vulnerable to temporary deviations from the kinematic model, which we explore in §4, during observation, together with the degeneracies mentioned in §1.
A distance of kpc is somewhat above the weak upper limit of 3.8 kpc for the distance to SS 433 which van Gorkom, Goss & Shaver (1980) found from HI absorption measurements (together with a strong lower limit of 3.0 kpc). kpc is substantially greater than the distance of 3.1 kpc inferred from neutral hydrogen measurements by Dubner et al (1998). They suggested that a gas cloud, seen in HI emission, is interacting with W50: the inferred velocity of this cloud implies a distance of 3.1 kpc if the rotation model of the Galaxy is correct (SS 433’s Galactic co-ordinates are [39.69, ]). However, this model assumes purely circular motion and takes no account, for example, of the presence of a bar in the Galaxy on the motion of gas near SS 433 (Binney et al, 1991). A distance of 5.5 kpc for SS 433 implies the same distance to the W50 nebula.
4 Deviations from the kinematic model
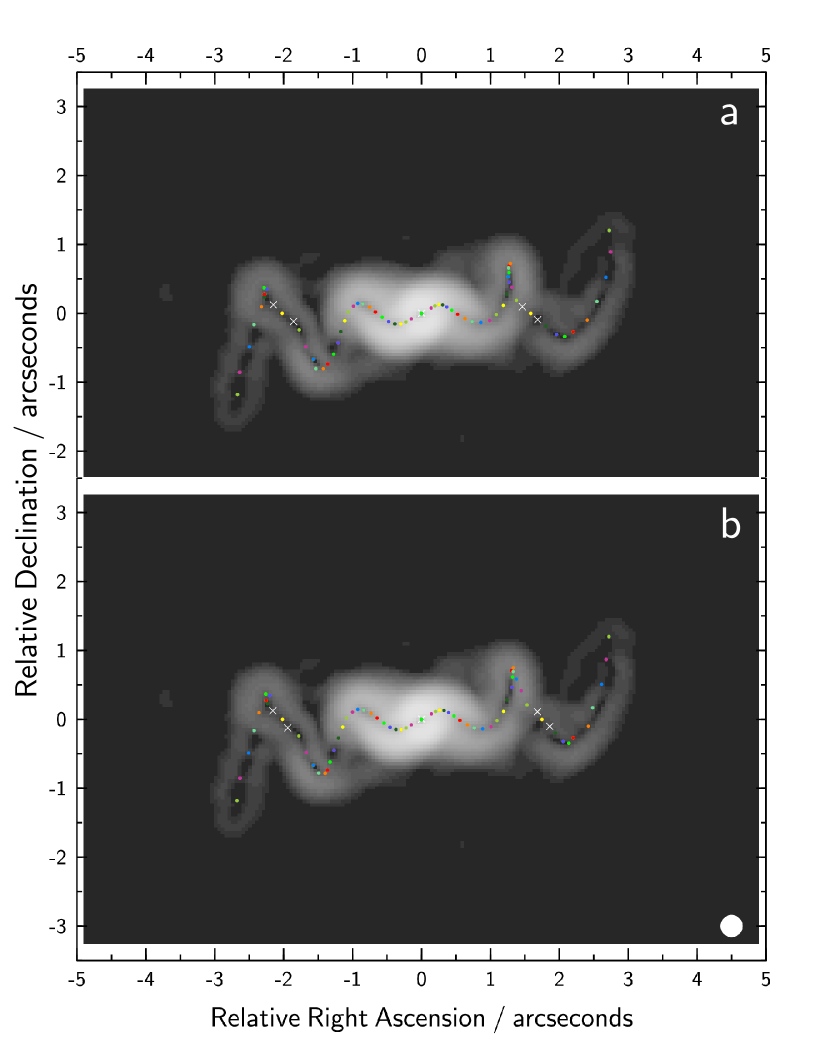
To verify the assumption of symmetry and investigate deviations from the simple kinematic model, the distance was set to 5.5 kpc and simulated bolides were launched every ten days with equal speeds in each jet, but the speeds were chosen to match the ridgeline of the east jet. This is illustrated in Fig 2a, where the beads are colour coded such that matching colours on opposite sides correspond to bolides launched simultaneously. The beads shown for the west jet are the symmetric counterparts of the eastern beads. The assumption of symmetry is very well justified over the entire image, and outside the innermost precession period the test has precision. (Note that although the FWHM of the point spread function of these images is , the accuracy with which the centroid of the peak of the jet cross-section may be found (and hence the jet ridgeline known) is .) The astonishing accuracy with which the western jet is reproduced for a distance of 5.5 kpc validates the assumption of symmetry, our delineation of the ridgeline and our distance to SS 433. Fig 2b shows the best fit that can be found for the eastern jet if the distance to SS 433 is 3.1 kpc. The beads shown for the west jet are the mirrors of those shown for the east jet; inspection of Fig 2b reveals that this does a very poor job of fitting the west jet (quantified in Table 1) and is wholly inconsistent with jet symmetry. As a consistency check on the measurements of Table 1, we calculated for the east-jet beads at an assumed distance of 3.1 kpc against the east-jet beads at an assumed distance of 5.5 kpc (this was 19.9) and for the west-jet beads at an assumed distance of 3.1 kpc against the west-jet beads at an assumed distance of 5.5 kpc (this was 110.3).
| Measure | Distance | |
|---|---|---|
| 5.5 kpc (Fig. 2a) | 3.1 kpc (Fig. 2b) | |
| for East jet (20 beads) | 16.2 | 17.3 |
| for West jet (22 beads) | 17.3 | 140.1 |
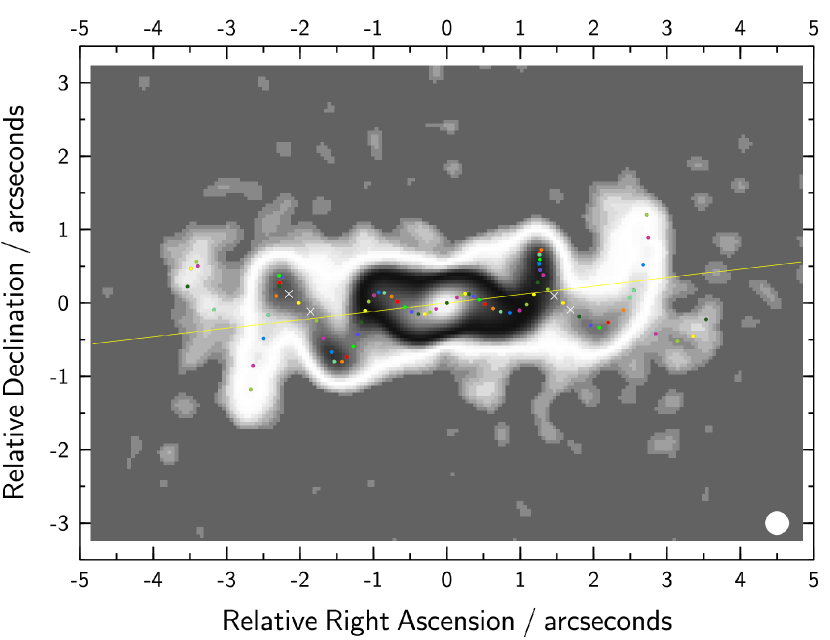
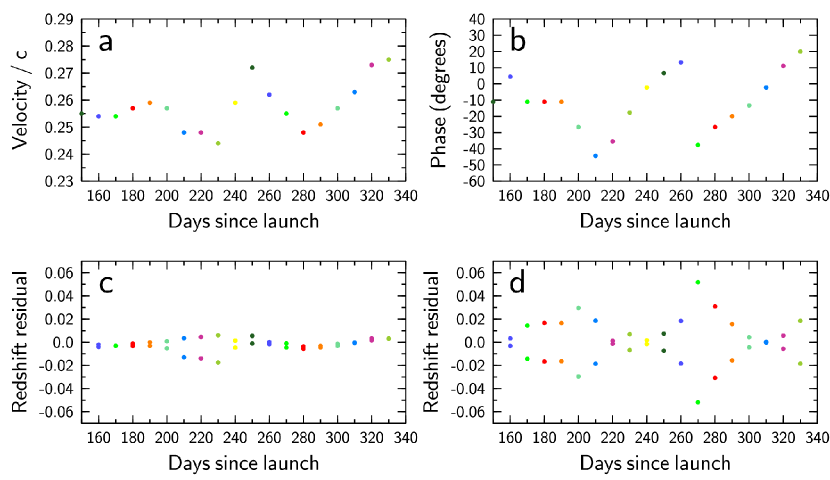
Fig 3 is a different rendering of the total intensity image shown in Fig 1a, with the beads from Fig 2a (5.5 kpc distance) superimposed, to clearly demonstrate the consistency between the total intensity image and that which had the Sobel operator applied. The jet speeds vary between and . These are shown in Fig 4a, with the corresponding Doppler redshifts for (hypothetical) optical spectroscopy shown in Fig 4c plotted as residuals with respect to the kinematic model. These residuals are very modest compared with those presented in Eikenberry et al (2001).
There is nothing in the accumulated data on optical Doppler shifts (e.g., Margon, 1984; Eikenberry et al, 2001) which contradicts our attribution of the observed departures from the simple kinematic model to these small variations in velocity. On the contrary, there is in fact independent evidence of speed variations in the spectroscopic data presented by Eikenberry et al (2001). The principal features of the correlation between their and are readily explained by (symmetric) velocity variations in addition to symmetric pointing angle variations (as is the lack of marked correlation with phase); we will discuss this in more detail in a forthcoming paper (Blundell & Bowler, submitted, see astro-ph).
The same symmetric match to the radio image may be obtained by keeping the jet speed constant at and varying the phase of the precession. The image on the sky is less sensitive to the phase than is optical spectroscopy; the necessary phases are shown as a function of time in Fig 4b, with the corresponding Doppler residuals shown in Fig 4d. The phase (in the outer regions) varies approximately linearly with time, corresponding to a rotation period of 276 days, rather different from the mean period of 162 days. There is also a phase jump of in less than 10 days. The corresponding Doppler residuals are much larger than those reported by Eikenberry et al (2001), precluding phase-only variations being responsible for the observed deviations from the kinematic model (unless our radio image captured a highly anomalous episode).
We suggest that the systematic deviations from the kinematic model observed in optical spectroscopy arise from a combination of both strictly symmetric oscillations in jet speed and strictly symmetric variations in pointing angle.
5 Concluding remarks
We have presented the deepest yet radio image of SS 433 on arcsecond scales, from which we have derived its distance from us to be 5.5 kpc, independently of any assumptions from optical data. We have identified deviations from the simple kinematic model in our image, which last over timescales of 10s of days. These may be formally fitted in either of two extreme scenarios: by small oscillations purely in jet velocity about a mean of (which are perfectly symmetric in both jets) or by large oscillations purely in the rate of precession about a mean of 162 days (which are perfectly symmetric in both jets). Additional information from redshift residual data (Eikenberry et al, 2001) strongly suggests that variations in velocity and in phase are both occurring.
We speculate that the phase (precession rate) variations might arise because of a varying effective moment of inertia of the nozzle (which in turn might arise because of variations in the mass transfer rate). We suggest that these same changes in mass distribution might cause variation in the inner radius of the accretion disc which may determine the speed of jet bolide ejection (Meier, Koide, & Uchida, 2001).
References
- Binney et al (1991) Binney, J., Gerhard, O.E., Stark, A.A., Bally, J. & Uchida, K.I., 1991, MNRAS, 252, 210
- Dubner et al (1998) Dubner, G.M., Holdaway, M., Goss, W.M., & Mirabel, I.F., 1998, AJ, 116, 1842
- Eikenberry et al (2001) Eikenberry, S.S., Cameron, P.B., Fierce, B.W., Kull, D.M., Dror, D.H., Houck, J.R., & Margon, B. 2001, ApJ, 561, 1027
- Fabian & Rees (1979) Fabian, A.C. & Rees, M.J., 1979, MNRAS, 187, 13p
- Hjellming & Johnston (1981) Hjellming, R.M. & Johnston, K.J. 1981, Nature, 290, 100
- Margon (1984) Margon, B. 1984, ARA&A, 22, 507
- Margon et al (1979a) Margon, B., Ford, H.C., Katz, J.I., Kwitter, K.B., Ulrich, R.B., Stone, R.P.S., & Klemola, A., 1979a, ApJ, 230, l41
- Margon et al (1979b) Margon, B., Ford, H.C., Grandi, S.A., & Stone, R.P.S., 1979b, ApJ, 233, l63
- Meier, Koide, & Uchida (2001) Meier, D.L., Koide, S., & Uchida, Y. 2001, Science, 291, 84
- Milgrom (1979) Milgrom, M., 1979, A&A, 76, l3
- Sobel (1990) Sobel, I., 1990, in “Machine Vision for Three-Dimensional Scenes” eds H. Freeman, Academic Press, p376
- Stirling et al (2002) Stirling, A.M., Jowett, F.H., Spencer, R.E., Paragi, Z., Ogley, R.N., & Cawthorne, T.V. 2002, MNRAS, 337, 657
- van Gorkom, Goss & Shaver (1980) van Gorkom, J. H., Goss, W. M., & Shaver, P. A. 1980, A&A, 82, L1
- Vermeulen et al (1987) Vermeulen, R.C., Schilizzi, R.T., Icke, V., Fejes, I., & Spencer, R.E., 1987, Nature, 328, 309
- Vermeulen et al (1993) Vermeulen, R.C., Schilizzi, R.T., Spencer, R.E., Romney, J.D., & Fejes, I., 1993, A&A, 270, 177