11email: daszynska@astro.uni.wroc.pl
Metallicity of mono- and multiperiodic Cephei stars
Analyzing IUE ultraviolet spectra of Cep pulsating stars we have noticed that multiperiodic variables have a larger mean metal abundance in the photosphere, [m/H], than monoperiodic ones. We apply statistical tests to verify this dichotomy. We obtain that, with a large probability, the multiperiodic Cep stars have greater values of [m/H]. This result is consistent with the linear non-adiabatic theory of pulsation of early B-type stars.
Key Words.:
stars: Cephei variables – stars: oscillation – stars: chemical composition1 Introduction
The Cephei pulsators are a well-known and well studied group of early-type pulsating stars. Oscillations in these stars are strictly connected with the metal abundance , as they are driven by the classical -mechanism operating in the layer of the metal opacity bump caused by the lines of Fe-group elements (Moskalik & Dziembowski 1992, Dziembowski & Pamyatnykh 1993, Kiriakidis et al. 1992 and Gautschy & Saio 1993). The size of the instability domain of Cep stars is very sensitive to the heavy element abundance , and is smaller for lower values of (Dziembowski & Pamyatnykh 1993, Pamyatnykh 1999). Therefore, the information about the metal abundance in Cep stars is of special importance.
In previous works (Daszyńska 2001, Daszyńska et al. 2003) we derived the metallicity parameter in the atmosphere, [m/H], and the mean stellar parameters for all Cephei stars monitored by the International Ultraviolet Explorer. We showed that the metallicity values obtained are independent of effective temperature and surface gravity. Additionally, they are not correlated with the stellar rotation and any of the pulsational parameters, like a dominant period or amplitudes of the light and the radial velocity variations.
In the scope of her PhD thesis, Daszyńska (2001) suggested that, in general, the multiperiodic Cep stars have higher values of [m/H] than the monoperiodic ones. We mentioned this result in Daszyńska et al. (2003), and we confirmed it in Niemczura & Daszyńska-Daszkiewicz 2004 (Paper I), where we applied a more accurate method of determination of stellar parameters. Using the results of Paper I, we verify here this hypothesis by means of statistical tests.
The paper is composed as follows. In Sect. 2 we remind derived values of [m/H]. Sect. 3 contains the test of statistical hypotheses about equality of two means. In Sect. 4 we discuss the dichotomy of Cep variables with regard to the metallicity. Conclusions are given in Sect. 5.
2 Metallicity of Cephei variables from UV spectra
In previous work (Paper I) we obtained the values of metallicity in the atmosphere for 31 field Cep stars and 16 ones belonging to three open clusters: NGC 3293, NGC 4755 and NGC 6231. Our approach consisted of fitting theoretical fluxes of Kurucz (1996) to low resolution IUE spectra, using the method based on the least-squares optimalization algorithm (Bevington 1969). Errors were estimated by the method of bootstrap resampling. For more details about the method we refer the reader to Niemczura (2003).
We analyzed IUE spectra from two calibrations: NEWSIPS and INES.
The estimated values of the sample mean, standard deviation and
standard error of the mean, for [m/H] derived from these two date
sets, are
NEWSIPS:
INES:
As we have shown in Paper I, these two populations follow a normal distribution. Applying the two sample t-Test and the one-way ANOVA test, we found that the two means are not significantly different up to the significance level . Also, these two data sets give the same dichotomy of Cep stars with regard to the value of metallicity: higher [m/H] for multiperiodic pulsators and lower [m/H] for monoperiodic pulsators. Therefore, from now on, we will focus only on the NEWSIPS results.
For the purpose of this work, we remind the obtained values of [m/H]. In Table 1 we put the field Cep stars, while in Table 2 - Cep stars belonging to the three open clusters. The following columns contain the HD number, the star name, the value of the dominant period and the value of [m/H]. The information about mono- or multiperiodicity at the present knowledge is given in the last column (Y=yes, N=no).
| HD | Name | P [d] | [m/H] | Multi. |
|---|---|---|---|---|
| 886 | Peg | 0.15175 | N | |
| 16582 | Cet | 0.16114 | N | |
| 29248 | Eri | 0.17351 | Y | |
| 44743 | CMa | 0.25002 | Y | |
| 46328 | CMa | 0.20958 | N | |
| 50707 | 15 CMa | 0.18456 | Y | |
| 52918 | 19 Mon | 0.1912 | Y | |
| 56014 | 27 CMa | 0.0918 | N | |
| 111123 | Cru | 0.19120 | Y | |
| 116658 | Vir | 0.1738 | N | |
| 118716 | Cen | 0.16961 | Y | |
| 120307 | Cen | 0.195 | Y | |
| 122451 | Cen | 0.157 | Y | |
| 126341 | Lup | 0.17735 | N | |
| 129056 | Lup | 0.25985 | Y | |
| 129557 | BU Cir | 0.12755 | Y | |
| 129929 | V836 Cen | 0.14313 | Y | |
| 132058 | Lup | 0.232 | Y | |
| 136298 | Lup | 0.1982 | N | |
| 144470 | Sco | 0.067 | N | |
| 147165 | Sco | 0.24684 | Y | |
| 157056 | Oph | 0.14053 | N | |
| 158926 | Sco | 0.21370 | Y | |
| 160578 | Sco | 0.19987 | Y | |
| 163472 | V2052 Oph | 0.13989 | N | |
| 199140 | BW Vul | 0.20104 | N | |
| 203664 | SY Equ | 0.16587 | N | |
| 205021 | Cep | 0.19049 | Y | |
| 214993 | 12 Lac | 0.19308 | Y | |
| 216916 | 16 Lac | 0.16917 | Y | |
| HN Aqr | 0.15218 | N |
| Name | ID | P [d] | [m/H] | Multi |
|---|---|---|---|---|
| NGC 3293 | ||||
| V380 Car | N3293-27 | 0.2273 | Y | |
| V400 Car | N3293-11 | 0.1458 | Y | |
| V401 Car | N3293-10 | 0.1689 | Y | |
| V404 Car | N3293-23 | 0.1621 | Y | |
| V405 Car | N3293-14 | 0.1524 | Y | |
| V412 Car | N3293-65 | 0.1135 | Y | |
| NGC 4755 | ||||
| BW Cru | N4755-F | 0.203 | Y | |
| N4755-G | 0.156 | N | ||
| N4755-I | 0.179 | N | ||
| N4755-I-13 | 0.232 | N | ||
| N4755-III-01 | 0.130 | N | ||
| NGC 6231 | ||||
| V947 Sco | N6231-110 | 0.1079 | Y | |
| V920 Sco | N6231-150 | 0.1012 | Y | |
| V964 Sco | N6231-238 | 0.0878 | Y | |
| V946 Sco | N6231-261 | 0.0988 | Y | |
| N6231-282 | 0.1193 | Y |
Let us divide the sample of Cep stars in two groups: monoperiodic Cep stars (a random variable ) and multiperiodic ones (a random variable ). These samples have sizes and , respectively. The sample parameters in these two groups are the following
The same parameters obtained from Gaussian fitting are
Distributions of monoperiodic and multiperiodic stars as a function of [m/H], together with Gaussian fits and normal curves, are shown in Fig.1. In the left panel, the distribution of [m/H] for monoperiodic Cep stars is shown, whereas in the right panel the distribution of [m/H] for multiperiodic Cep stars is shown.
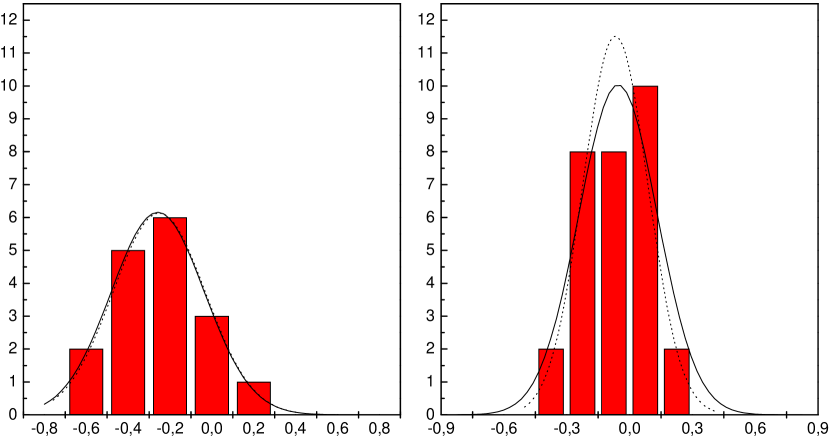
Comparing the sample parameters with those derived from Gaussian fitting we can say that they are the same within the error limits. Additionally we checked the normality of these distributions by using the Shapiro-Wilk test. Thus, we may assume that and have independent normal distributions and , respectively, where and are the mean and the variance, respectively.
3 Statistical tests
We are interested in comparing the means of the metallicity of the monoperiodic and multiperiodic Cep stars, called the random variables and , respectively. Because the sample sizes are small, we have to do that in two steps. Firstly, we have to test whether the variances of these two variables are equal, and then, if we accept this hypothesis, we will test the equality of the two means.
3.1 Test for the variances
The null hypothesis will be tested against the alternative hypothesis . For this purpose we use the statistic
which has an -Snedecore distribution with and degrees of freedom. Thus, is needed to obtain the significance level. and are assumed to be unbiased estimates of the corresponding variances, and , of two independent normal distributions with unknown means. To test the hypothesis against a two-sided hypothesis , we assume the critical region given by
and
Taking and as the observed values of unbiased estimates of the variances, we get . At the significance level , the critical region, based on the random samples of size and , is
or
hence
Because our value of does not belong to the critical region , there are no reasons to reject the hypothesis . In this case, the p-value, i.e. the smallest level of significance, , at which would be rejected, amounts to 0.83. Thus, with a very high probability we may assume the equality of variances.
3.2 Test for the means
Given that the hypothesis of equal variances is accepted, we are ready to test the hypothesis about the means. If random samples of small sizes and are taken, the test can be based on the statistic
where
The statistic has a Student’s distribution with degrees of freedom. The critical regions for testing the null hypothesis against the alternative ones are
-
(a)
-
(b)
-
(c)
We remind that the random variable represents [m/H] for the monoperiodic stars, and the random variable represents [m/H] for the multiperiodic ones. The case means that we test whether the mean values of [m/H] for the monoperiodic Cep stars and the multiperiodic ones are equal or not. In the case we verify the hypothesis of equality of these means against the hypothesis that the mean for monoperiodic variables is less than for the multiperiodic ones. And the last one, , is the test whether the monoperiodic stars have a greater value of [m/H] than the multiperiodic ones.
If and represent the observed unbiased estimates of the respective parameters and of two independent normal distributions, then the empirical value of the test statistic is . At and we have the following critical regions for these three alternative hypotheses
-
(a)
,
-
(b)
,
-
(c)
The values of the observed belong to the first and the second critical regions. Thus is clearly rejected at an significance level in favor of the alternative hypothesis , as well as in favor of the hypothesis . On the other hand we would not reject the hypothesis if the alternative one is . In this case we have to accept that , but it is impossible because has already been rejected.
The value for the two-side hypothesis, , is 0.002, and for the one-side hypothesis, , amounts to 0.001. Thus, with a large probability, on the basis of these data sets, we can conclude that the mean metallicity for multiperiodic Cep stars is higher than that for monoperiodic ones.
4 Discussion of the metallicity dichotomy
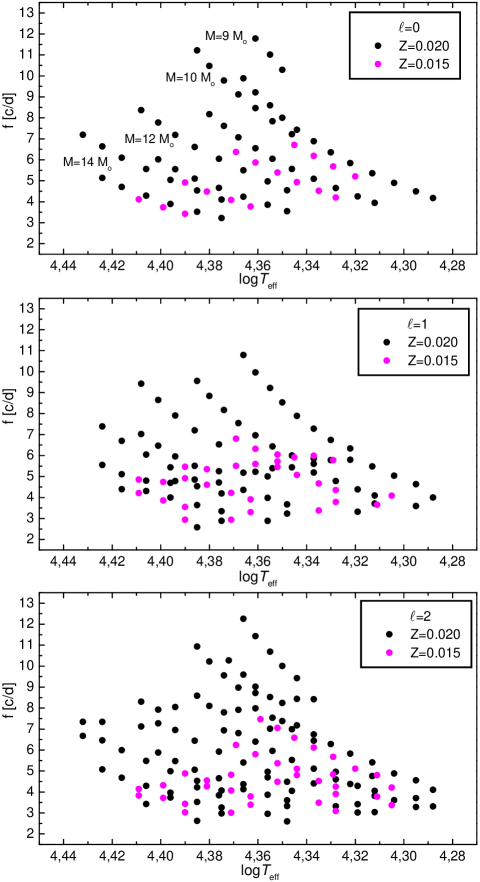
The result from our statistical analysis is in agreement with the linear non-adiabatic theory of pulsation of Cep stars. As was shown by Dziembowski & Pamyatnykh (1993), for greater metal abundance we get more unstable modes. In Fig. 2 we plot the evolution of oscillation frequencies in the Main Sequence phase for four indicated masses and two values of the heavy element abundance . We considered low degree modes with . In these computations we used the Warsaw-New Jersey stellar evolution code and the non-adiabatic pulsation code of Dziembowski (1977). We took OPAL opacities and did not include effects of rotation and convective core overshooting. As we can see from Fig.2, for the higher value we get a wider range of unstable frequencies.
Guided by this property, we plot in Fig.3 two dependencies, taking all studied multiperiodic Cep stars. In the top panel we show the range of the observed frequencies as a function of [m/H], whereas in the bottom panel, the range normalized by the sum of the lowest and highest frequency as a function of [m/H]. In both cases we did not find any correlation. The correlation coefficients, , calculated including errors as weights, are equal to -0.31 and -0.45 for the frequency range and the normalized frequency range, respectively.
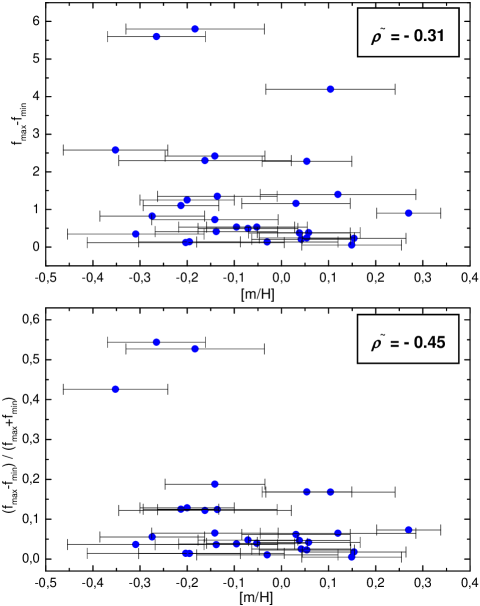
This result is not surprising. Cep stars are pulsating variables with small amplitudes both in photometry as well as in spectroscopy, and we do not know how many modes we do observe amongst the excited ones. The number of known frequencies increases every year. This is mainly thanks to large multi-site and multi-technique campaigns, organized already for many Cep variables. For example, the last campaign of Eri (Aerts et al. 2004, Handler et al. 2004) gave an increase of the frequency range from up to . The data from the 12 & 16 Lac campaign set up by Gerald Handler are already analyzed. Great hopes are pinned also on forthcoming space mission, e.g. the COROT project. Therefore the dependencies in Fig. 3 are just a first trial, which should be constantly updated.
5 Conclusions
Using statistical tests, we have shown that with a very high probability the multiperiodic Cephei stars have a higher mean metallicity in their atmospheres than the monoperiodic ones. The statistical analysis was based on our last determinations of the metallicity parameter [m/H] (Paper I). Getting a normal distribution of [m/H] for the mono- and multiperiodic stars, we applied the test about equality of variances of these two samples, represented by X and Y random variables. The test based on the statistic allowed clearly to accept the null hypothesis . Then we could test the hypothesis about the mean values of metallicity for the mono- and multiperiodic variables. We used the statistic to define the critical regions for a small size of random samples. The null hypothesis was rejected in favor of , as well as in favor of .
The higher value of the mean metal abundance in the case of multiperiodic Cep stars is understandable in the framework of the linear non-adiabatic theory, which predicts more unstable frequencies for higher metal abundance . Therefore, we tried to find a dependence between the range of observed frequencies and the metal abundance. We can not make a statement about any correlation between these two parameters, because the value of the weighted correlation coefficient amounts to -0.45. In fact, we should not expect more, as a number of detected modes is much lower than theory predicts. We have to remember also that the values of [m/H] give information mainly about photospheric metal abundances. Moreover, we do not take into account phenomena like diffusion, element mixing etc.
To improve this analysis, a few things must be done. Firstly, we need determinations of the [m/H] parameter for a larger sample of Cep stars. Secondly, a high accuracy in the period search analysis is needed to estimate better the range of the excited modes in a given star. Here put our hope on next multi-site and multi technique campaigns, as well as on space missions. Finally, the analysis of the chemical composition of Cep variables from high resolution spectra would be very helpful.
These results require further studies and must be treated with caution. Firstly, they were obtained for small samples of stars, and secondly, we do not know how many modes from the excited ones have been already identified. Our aim was only to show some properties which could be extracted from such determinations of the metal abundance parameter [m/H] for Cep variables. Having in mind that from a theoretical point of view all Cep stars should be multiperiodic ones, the metallicity dichotomy we obtained is rather a qualitative confirmation of the dependence of the pulsation instability in these stars on the heavy element abundance.
Acknowledgements.
We thank Wojtek Dziembowski and Alosha Pamyatnykh for the use of the Warsaw-New Jersey evolutionary code and the non-adiabatic pulsation code.References
- (1) Aerts, C., De Cat, P.; Handler, G. et al., 2004, MNRAS, 347, 463
- (2) Bevington, P.R. 1969, in Data Reduction and Error Analysis for the Physical Science, New York: McGraw-Hill
- (3) Daszyńska, J. 2001, PhD Thesis, Wrocław University, Poland
- (4) Daszyńska, J., Niemczura E. & Cugier, H. 2003, Adv. Space Res. 31, 387
- (5) Dziembowski, W. A., 1977, Acta Astron., 27, 203
- (6) Dziembowski, W. A. & Pamyatnykh, A. A. 1993, MNRAS, 262, 204
- (7) Gautschy, A. & Saio, H. 1993, MNRAS, 262, 213
- (8) Handler G., Shobbrook R.R., Jerzykiewicz M., et al., 2004, MNRAS, 347, 454
- (9) Kiriakidis M., El Eid M.F., Glatzel W. 1993, MNRAS, 255, 1P
- (10) Kurucz, R.L. 1996, CD-ROM No. 13 and 19
- (11) Moskalik P., Dziembowski W.A. 1992, A&A, 256, L5
- (12) Niemczura E., 2003, A&A 404,689
- (13) Niemczura E., Daszyńska-Daszkiewicz J., 2004, Paper I, A&A
- (14) Pamyatnykh, A. A. 1999, Acta Astron. 49, 119