SDSSJ140228.22+632133.3:
A New Spectroscopically
Selected Gravitational Lens11affiliation:
Based on observations made with the NASA/ESA Hubble Space Telescope,
obtained at the Space Telescope Science Institute, which is operated
by the Association of Universities for Research in Astronomy, Inc.,
under NASA contract NAS 5-26555. These observations are associated
with program #10174. Support for program #10174 was provided by
NASA through a grant from the Space Telescope Science Institute, which
is operated by the Association of Universities for Research in
Astronomy, Inc., under NASA contract NAS 5-26555. 22affiliation:
Also based on observations obtained under program GN-2004A-Q-5 at the
Gemini Observatory, which is operated by the Association of
Universities for Research in Astronomy, Inc., under a cooperative
agreement with the NSF on behalf of the Gemini partnership: the
National Science Foundation (United States), the Particle Physics and
Astronomy Research Council (United Kingdom), the National Research
Council (Canada), CONICYT (Chile), the Australian Research Council
(Australia), CNPq (Brazil) and CONICET (Argentina).
Abstract
We present Gemini integral-field unit (IFU) spectroscopy and Hubble Space Telescope (HST) F435W- and F814W-band images of a newly discovered four-image gravitational lens, SDSSJ140228.22+632133.3 (hereafter SDSSJ1402). The system was identified as one of 49 gravitational-lens candidates in the luminous red galaxy sample of the Sloan Digital Sky Survey, based on higher-redshift emission lines in the spectra of the lower-redshift galaxies. We are imaging the most promising lens candidates with HST as part of a Snapshot program designed to expand the sample of known gravitational lenses amenable to detailed photometric, lensing and dynamical studies; SDSSJ1402 was the first of our targets to be observed with the ACS-WFC on board HST. The lens is a smooth elliptical galaxy at a redshift of with a Sloan -band magnitude of and a stellar velocity dispersion of 267 17 km s-1, obtained from its SDSS spectrum. Multiple emission lines place the quadruply-imaged source at a redshift of . The best-fitting singular isothermal ellipsoid lens model gives an Einstein radius (or kpc), corresponding to a total mass of within the critical curve. In combination with HST photometry this gives a rest-frame -band mass-to-light ratio of times solar within the same region. The lens model predicts a luminosity-weighted stellar dispersion within the -diameter SDSS aperture of km s-1, in good agreement with the observed value. Using the model to de-lens the four lensed images yields a source with a smooth, monotonically-decreasing brightness distribution. Taken in combination, the HST ACS images, Gemini IFU spectroscopy, and self-consistent mass model show SDSSJ1402 to be a genuine lens system.
Subject headings:
Gravitational lensing—galaxies: elliptical and lenticular, cD—surveys1. Introduction
In the last decade, galaxy-size gravitational lenses have become an increasingly important tool for the study of cosmology and galaxy evolution. The number of known lenses has now reached almost 100 (see the CASTLES web page at http://cfa-www.harvard.edu/castles/), and subsets of lenses with suitable properties are now available for a variety of applications: the determination of the cosmological parameters from lens statistics (e.g. Turner et al., 1984; Kochanek, 1996; Chae, 2003), the measurement of the Hubble Constant from lens time delays (e.g. Kundić et al., 1997; Schechter et al., 1997; Koopmans et al., 2003), and the study of the mass distribution of E/S0 galaxies and their dark matter halos outside the local Universe (e.g. Kochanek, 1994; Rusin et al., 2003; Treu & Koopmans, 2004).
Despite the great progress, the small subsample sizes of suitable lenses is a major limitation. This is particularly true for the study of the properties of lens galaxies (typically E/S0s). Most currently known lenses have been discovered as bright quasars that show multiple images when observed at high spatial resolution. For optical quasar lenses, this biases the sample in favor of systems where the lensed source outshines the lens galaxy. Radio surveys such as the Cosmic Lens All-Sky Survey (CLASS; Myers et al., 2003; Browne et al., 2003) are less susceptible to this bias, but redshifts in radio lens systems can be difficult to obtain, and the lensing galaxies are often faint. This situation makes it very difficult to obtain high-quality photometry, redshifts, and internal kinematics of lens galaxies, which are essential ingredients for detailed modeling. It is not a coincidence that 3/5 lenses analyzed by the Lenses Structure and Dynamics Survey (LSD; Koopmans & Treu 2002, 2003; Treu & Koopmans 2002, 2003, 2004; hereafter collectively KT) so far have been discovered serendipitously in Hubble Space Telescope (HST) images.
To overcome this limitation we have initiated the Sloan Lens ACS (SLACS) Survey, a new survey for gravitational lenses that exploits the Sloan Digital Sky Survey (SDSS) archive and the angular resolution of HST to find and confirm new gravitational lenses. First, a large sample of SDSS early-type galaxy spectra is searched for emission lines at a higher redshift than that of the absorption features (Bolton et al. 2004; see also Warren et al. 1996). By requiring that the foreground galaxy dominate the absorption spectrum, this procedure will tend to select bright lenses with faint background sources. The second step consists of follow-up snapshot observations of the best candidates with the Advanced Camera for Survey (ACS) to confirm the incidence of lensing and provide the lens geometry necessary to construct a mass model111Our survey is the second HST snapshot lens survey. For details of the first, see Maoz et al. (1993).. Each candidate is observed for 420 seconds in each of F435W and F814W. The F435W filter is selected to optimize the detection of the lensed source galaxy (expected to be blue and starforming) while F814W is selected to optimize the signal-to-noise ratio on the (red) lens galaxy. Color information also provides important evidence in support of the lensing hypothesis. In this Letter we present the first newly discovered lens, along with ACS images and Gemini GMOS-North integral-field spectroscopy and a lens model, and discuss its overall properties. We assume that the Hubble constant, the matter density, and the cosmological constant are H km s-1 Mpc-1 (with ), , and , respectively. All spectroscopic wavelengths are given in vacuum values.
2. Observations
2.1. SDSS
The original spectroscopic observations of SDSSJ1402 were obtained on
SDSS plate 605, fiber 503, MJD 52353
(included in the public Data Release 2).
The latest public SDSS photometric values for the galaxy
are , all ,
and it forms part of the volume-limited luminous
red galaxy (LRG) spectroscopic sample (Eisenstein et al., 2001).
The specBS one-dimensional
spectroscopic pipeline
(Schlegel et al., in preparation; see also
Bolton et al. 2004)
determines a redshift
and a velocity dispersion of
267 17 km s-1 for SDSSJ1402. Though
the spectrum is unambiguously that of an early-type galaxy at the
above redshift, it also exhibits nebular line emission at a background
redshift of
(see Figure 2 of Bolton et al., 2004). Given
the measured stellar velocity dispersion and these redshifts and
assuming a singular isothermal sphere galaxy model, one naïvely
expects a strong-lensing region of radius
(twice the
Einstein radius) in the plane of the sky, centered on the foreground
galaxy. Considering the radius of an SDSS spectrograph
fiber aperture, the prior probability of the system being a strong
gravitational lens
is essentially unity if one neglects the effects
of seeing and fiber misalignment,
and it was therefore
targeted for follow-up observation.
2.2. HST-ACS
Hubble Space Telescope (HST) observations of SDSSJ1402 were obtained on 2004 August 4 with the Advanced Camera for Surveys (ACS), with one 420-second exposure in each of the filters F435W and F814W. The 5- limits are approximately mag arcsec-2 and mag arcsec-2 in 22-pixel apertures. The brief exposure times result in comic rays affecting –% of all pixels. These are very effectively flagged and cleaned using the Laplacian edge-detection technique (“LACOSMIC”) of van Dokkum (2001). The cosmics-cleaned images are spatially transformed to an orthogonal coordinate system by the MULTIDRIZZLE routine as implemented on pyraf by STScI. This allows for high-precision astrometry and spatially-correct galaxy shapes. In each band, a 2D model of the lensing galaxy is computed using GALFIT (Peng et al., 2002). The fits are done assuming a simple Sérsic profile parametrized by index (where is an exponential, and is a de Vaucouleur profile), as well as assuming a constrained de Vaucouleur profile. The latter is especially useful for comparison with fundamental plane results. The Sérsic fits are sufficiently accurate to produce high-quality residual images, which are used to measure the positions of candidate lensed images. These are identified both by their image configurations and by their similarity in colors.
The constrained de Vaucouleur fit to the F814W galaxy image gives a model magnitude222All HST magnitudes are corrected for dust extinction using Schlegel, Finkbeiner, & Davis (1998) maps. of , an isophotal axis ratio , a position angle East of North, and an intermediate-axis effective (half-light) radius of . Fixing the galaxy shape from these F814W de Vaucouleurs structural parameters and fitting for a magnitude in the F435 image yields . The unconstrained Sérsic fit to the F814W data has an index of , indicating a high degree of central concentration.
Figure 1 shows the ACS F435W and F814W images and galaxy-subtracted F435W residual image of SDSSJ1402. Despite low signal-to-noise, four images with similar colors are easily identifiable in both filters with a typical quad-like configuration; we designate these images A–D. Two of the images (A and B) appear arc-like in both filters and stretched tangentially. We determine image centroids from the F435W image, in which they are more pronounced and less affected by residuals from the foreground galaxy subtraction. Table 1 lists these image positions relative to the LRG centroid. We describe the determination of a gravitational-lens model based on these image positions in § 3 below.
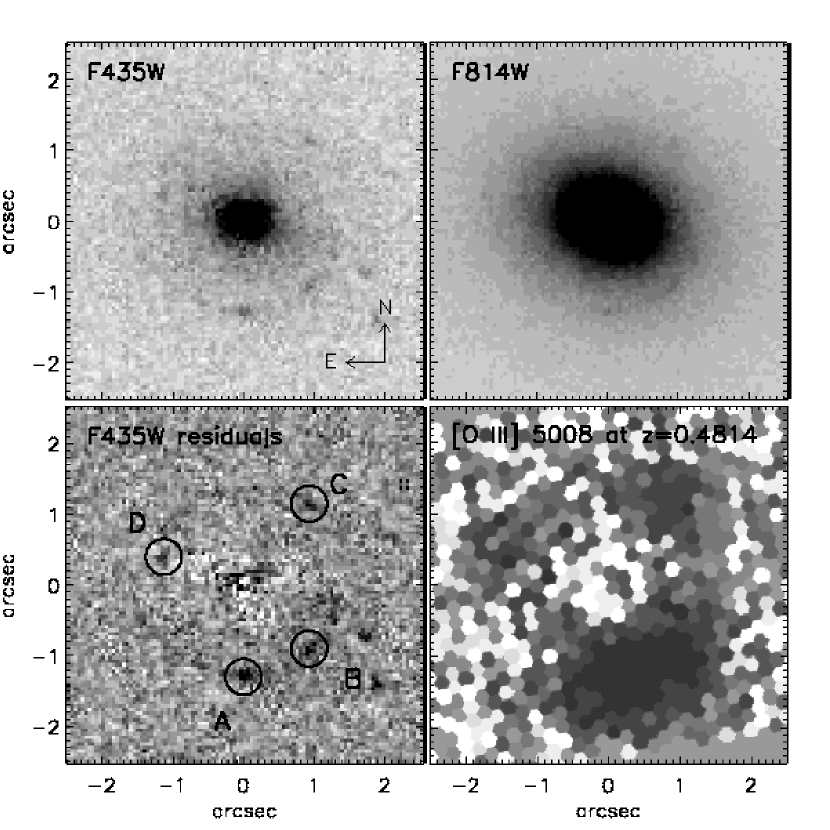
| Image | (W) | (N) |
|---|---|---|
| A | 000 | 135 |
| B | 093 | 095 |
| C | 088 | 115 |
| D | 113 | 045 |
| G | 000 | 000 |
2.3. Gemini GMOS-N IFU
To solidify the lensing hypothesis over alternative
explanations for the observed features, we look to
spatially resolved spectroscopy of SDSSJ1402 obtained with the
integral-field unit (IFU) of the Gemini Multi-Object Spectrograph
(GMOS-N) on the 8-meter Gemini North telescope at Mauna Kea
(Hook et al., 2003; Allington-Smith et al., 2002).
The observations were made using the R600 grating and a
Sloan -band blocking filter to prevent spectral
overlap and allow use of the full
IFU field of view. The total
integration time was 3900 seconds,
and the data were reduced using custom IFU software
written in IDL (Bolton & Burles, in preparation).
In addition to the ACS data,
Figure 1 also shows a reconstructed IFU
narrow-band
image of a 5-Å window about the redshifted
[O III] 5008.24Å emission,
after subtraction of a linear fit to the LRG continuum at that
wavelength. The emission is spatially coincident with the assumed
lensed images in the HST-ACS data. Independent confirmation of the
identification of this line emission as
redshifted [OIII] is provided by summing the spectra in
circular apertures about the appoximate image positions to obtain the
spectrum presented in Figure 2, showing both lines of the
[OIII] doublet in the expected 1:3 ratio, as well as H.
We thus confirm that the redshift of the faint images is much
higher than that of the LRG, further supporting a lensing
interpretation.

3. Gravitational-Lens Model
Adopting a lensing hypothesis for SDSSJ1402, we model the lens as a simple singular isothermal ellipsoidal (SIE) mass model without external shear, using the astrometry of the four images as constraints. Using the mass normalization from Kormann et al. (1994), the best-fit ( for NDF=3) gives an Einstein radius (68% CL), corresponding to a SIE velocity dispersion of km/s333Recall that the luminosity-weighted stellar dispersion from the SDSS is km/s (within a 3′′ diameter aperture). Prior to the ACS observations we predicted based on this dispersion, leading to the selection as lens candidate. and a physical radius of kpc. The axial ratio and position angle (in the frame of Figure 1) of the ellipsoidal equal surface density contours are and degrees, respectively. This lens-model ellipticity is in good agreement with the ellipticity of the galaxy isophotes given in § 2.2. The galaxy and lens-model position angles are also significantly aligned, although they differ formally by .
The total mass-to-light ratio within the Einstein radius is robustly determined by the data, and we compute it as follows. The total mass enclosed by the critical curve is M⊙: we derive this from the fitted lens model, but it is in fact largely model independent. From aperture photometry, the corresponding enclosed magnitude is . Using a specBS template fitted to the spectrum of SDSSJ1402 and an ACS-F435W filter curve, we compute a -correction of 1.20 for the lens galaxy. Combining this with a distance modulus of 40.17 from our assumed cosmology, we obtain an absolute magnitude of enclosed by the lensed images, with an estimated 0.05-magnitude systematic error in the conversion. Finally, we convert from the system to Johnson via , giving an absolute magnitude of . For an absolute solar magnitude of (Cox, 2000), the rest-frame -band luminosity within the Einstein radius is then . Thus the enclosed -band mass-to-light ratio is in solar units.
If we assume the stars to be test particles embedded in an isothermal mass distribution with the above given mass, with a luminosity density derived from the stellar surface brightness (e.g. see KT03 or TK04 for details), we find a luminosity-weighted stellar dispersion of km s-1 within the SDSS apperture, assuming an isotropic dispersion tensor. This agrees very well with the observed stellar dispersion. Future work will present a more detailed dynamical analysis based on the determination of an extended kinematic profile or field (e.g. with integral-field spectroscopy).
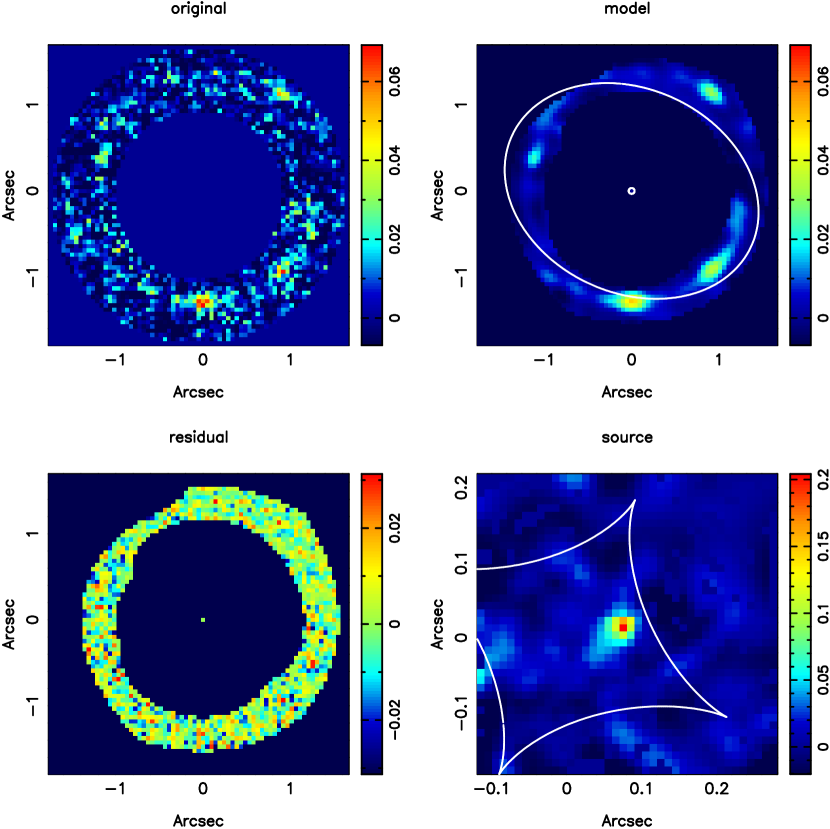
With this mass model, we proceed to invert the lensed images to obtain the structure of the source (e.g. Warren & Dye 2003; see also Treu & Koopmans 2004 for more details). We regularize the solution by adding a term to the penalty function that suppresses the curvature (see Press et al. 1992) of the resulting source brightness distribution. During the single-step inversion process the mass model remains fixed. We use PSF models generated with Tiny-Tim, although the results are insensitive to the precise PSF model because of the low S/N of the images. The F435W results are shown in Figure 3, for a regularization that gives . We see that the source has a roundish monotonically-decreasing brightness distribution, close to and inside the fold caustic. In the F814W filter (not shown), the source is found at the same position and with similar structure. Also shown are the lensed source model and residuals. The latter show no significant remaining structure and are distributed Gaussian. We find that models with parameters within the 68% CL of the best-fit SIE model values give similar results, but can not be distinguished at a significant level because of the low S/N of the images. Hence, the lens inversion should for now be regarded only as a consistency check of the lens model.
4. Conclusions
Based on the following evidence, we conclude that SDSSJ1402 is a lens system:
-
1.
The discovery of emission-lines in the SDSS spectrum at a redshift significantly larger than that of the high- LRG and within a 1.5′′ radius from the galaxy centroid, and confirmed by follow-up GMOS-N IFU spectroscopy.
-
2.
The discovery of four images (with two tangentially stretched) in a typical quad-lens-like configuration around the galaxy in Hubble Space Telescope images, with similar colors and positions between F814W and F435W filters.
-
3.
The spatial coincidence of these images with the higher-redshift line emission, as shown by GMOS-N IFU spectroscopy.
-
4.
The excellent goodness-of-fit () for the SIE mass model (no external shear). The stellar velocity dispersion predicted by this mass model and the observed luminosity density is in excellent agreement with the SDSS value, and the galaxy and lens-model ellipticities and position angles are in significant agreement with one another.
-
5.
A direct inversion of the lensed image—based solely on the SIE mass model determined from the image positions—leads to a very simple compact source structure in both F814W and F435W filters at the same position near the inside of the fold caustic.
Hence, despite the relatively low signal-to-noise of the lensed
images, the spectral and imaging data of SDSSJ1402 presented in this
paper, in conjunction with the self-consistent lens model,
convincingly show that
the first candidate observed
by the SLACS Survey is also
the first genuine lens system from the program!
The lens geometry and HST photometry yield a (largely
model-independent) measurement of
M⊙
and a rest-frame -band mass-to-light ratio of
times solar
within the -kpc cylinder enclosed by the
critical curve.
Spatially resolved kinematic observations
of this system will permit more detailed lens/dynamical
modeling, which will constrain the radial mass profile and
the relative fraction of luminous to dark matter
in the central region of the lensing galaxy.
References
- Allington-Smith et al. (2002) Allington-Smith, J., et al. 2002, PASP, 114, 892
- Bolton et al. (2004) Bolton, A. S., Burles, S., Schlegel, D. J., Eisenstein, D. J., & Brinkmann, J. 2004, AJ, 127, 1860
- Browne et al. (2003) Browne, I. W. A., et al. 2003, MNRAS, 341, 13
- Chae (2003) Chae, K. 2003, MNRAS, 346, 746
- Cox (2000) Cox, A. N. 2000, Allen’s astrophysical quantities (Allen’s astrophysical quantities, 4th ed. Publisher: New York: AIP Press; Springer, 2000. Editedy by Arthur N. Cox. ISBN: 0387987460)
- Eisenstein et al. (2001) Eisenstein, D. J., et al. 2001, AJ, 122, 2267
- Hook et al. (2003) Hook, I., et al. 2003, in Instrument Design and Performance for Optical/Infrared Ground-based Telescopes. Edited by Iye, Masanori; Moorwood, Alan F. M. Proceedings of the SPIE, Volume 4841, pp. 1645-1656 (2003)., 1645–1656
- Kochanek (1994) Kochanek, C. S. 1994, ApJ, 436, 56
- Kochanek (1996) —. 1996, ApJ, 466, 638
- Koopmans & Treu (2002) Koopmans, L. V. E., & Treu, T. 2002, ApJ, 568, L5
- Koopmans & Treu (2003) —. 2003, ApJ, 583, 606
- Koopmans et al. (2003) Koopmans, L. V. E., Treu, T., Fassnacht, C. D., Blandford, R. D., & Surpi, G. 2003, ApJ, 599, 70
- Kormann et al. (1994) Kormann, R., Schneider, P., & Bartelmann, M. 1994, A&A, 284, 285
- Kundić et al. (1997) Kundić, T., et al. 1997, ApJ, 482, 75
- Maoz et al. (1993) Maoz, D., et al. 1993, ApJ, 409, 28
- Myers et al. (2003) Myers, S. T., et al. 2003, MNRAS, 341, 1
- Peng et al. (2002) Peng, C. Y., Ho, L. C., Impey, C. D., & Rix, H. 2002, AJ, 124, 266
- Rusin et al. (2003) Rusin, D., Kochanek, C. S., & Keeton, C. R. 2003, ApJ, 595, 29
- Schechter et al. (1997) Schechter, P. L., et al. 1997, ApJ, 475, L85+
- Schlegel et al. (1998) Schlegel, D. J., Finkbeiner, D. P., & Davis, M. 1998, ApJ, 500, 525
- Treu & Koopmans (2002) Treu, T., & Koopmans, L. V. E. 2002, ApJ, 575, 87
- Treu & Koopmans (2003) —. 2003, MNRAS, 343, L29
- Treu & Koopmans (2004) —. 2004, ApJ, 611, 739
- Turner et al. (1984) Turner, E. L., Ostriker, J. P., & Gott, J. R. 1984, ApJ, 284, 1
- van Dokkum (2001) van Dokkum, P. G. 2001, PASP, 113, 1420
- Warren & Dye (2003) Warren, S. J., & Dye, S. 2003, ApJ, 590, 673
- Warren et al. (1996) Warren, S. J., Hewett, P. C., Lewis, G. F., Moller, P., Iovino, A., & Shaver, P. A. 1996, MNRAS, 278, 139