Ram Pressure Stripping in the Low Luminosity Virgo Cluster Elliptical Galaxy NGC 4476
Abstract
We present a deep VLA search for HI emission from the low-luminosity Virgo Cluster elliptical galaxy NGC 4476, which contains 1.1108 of molecular gas in an undisturbed disk in regular rotation. No HI was detected. The rms noise in the final image corresponds to a 3 column density sensitivity of 1.21020 cm-2 at the position of NGC 4476, averaged over the 4 kpc beam. The total HI mass is less than 1.5107 . If we compare our HI upper limit to the H2 content, we find that NGC 4476 is extremely deficient in HI compared to other galaxies detected in these two species. The H2/HI mass ratio for NGC 4476 is 7, whereas typical H2/HI ratios for elliptical galaxies detected in both HI and H2 are 2. Based on this extreme HI deficiency and the intra-cluster medium (ICM) density at the projected distance from M87 we argue that either NGC 4476 has undergone ram-pressure stripping while traveling through the Virgo cluster core or its average molecular gas density is larger and its interstellar UV field is smaller than in typical spiral galaxies. NGC 4476 is located 12′ in projection from M87, which causes extreme continuum confusion problems. We also discuss in detail the techniques used for continuum subtraction. The spectral dynamic range of our final image is 50,000 to 1.
1 Introduction
In recent years it has become clear that the majority of elliptical galaxies contain small amounts of cold interstellar gas and dust (eg. Knapp et al. 1989; Colbert et al. 2001; Sadler et al. 2000). Fifty to seventy percent of ellipticals show HI emission in amounts M(HI)/LB10-3 (Huchtmeier, Sage, Henkel 1995). The origin of the neutral atomic gas is still being debated; possibilities include accretion of gas-rich companions, fallback of gas after the major merger event that created the elliptical, secondary infall, and (especially for the smaller systems) stellar mass loss (e.g. van Gorkom & Schiminovich 1997; Oosterloo et al. 1999).
Work done by Quillen et al. (1992), Wiklind et al. (1997), and Young (2002) has shown that molecular gas in elliptical galaxies can be found in flat disks in regular rotation about the central nucleus. HI studies in low-luminosity elliptical galaxies show that their HI systems fundamentally resemble those of spiral galaxies (Sadler et al. 2000). The primary difference between the HI disks in low-luminosity ellipticals and those in spiral galaxies is that the surface density of the HI disk is a factor of 5 to 10 lower in ellipticals (Oosterloo et al. 1999). Typical /MHI for spiral and elliptical galaxies are 2 (Kenny Young 1989, Thronson et al. 1989) and 0.8 (Lees et al. 1990, Wiklind et al. 1995), respectively.
It is well established that cluster spirals are deficient in HI (Solanes et al. 2001). HI imaging of a few clusters has shown that the HI disks have smaller diameters in galaxies closer to the centers of clusters (Warmels 1988, Cayatte et al. 1990; Bravo-Alfaro et al. 2000). Studies of the Virgo Cluster show extreme HI deficiencies for galaxies within 6∘ of the cluster center. Inside this region, six spiral and lenticular (S0) galaxies have /MHI ratios of 10 and greater (see Table 1). The fate of the HI in these galaxies has been the subject of much speculation. Two main processes are thought to affect the gas content of galaxies in clusters: (i) ICM-ISM interactions (Gunn Gott 1972; Nulsen 1982; Valluri Jog 1990; Schulz Struck 2001; Vollmer et al. 2001), and (ii) gravitational interactions, including galaxy-galaxy encounters and cluster-galaxy encounters (e.g. Mihos 2004; Moore, Lake, & Katz 1998; Henriksen & Byrd 1996). ICM-ISM interactions would affect the gas in a galaxy but not the existing stellar populations, whereas gravitational interactions would affect both gas and stars. Since the gas disks in low-luminosity ellipticals resemble those of spirals, it is very likely that the cluster environment will have the same effects on HI disks in both spirals and ellipticals. In this paper we investigate this type of alteration of the ISM in the low-luminosity elliptical NGC 4476.
Spirals which are deficient in HI but not in H2 may have enhanced H2/HI mass ratios. The largest H2/HI mass ratios in Virgo spirals are listed in Table 1, and so far no elliptical galaxies are known to have mass ratios as large as these. Of the ellipticals which are detected in CO, Wiklind et al. (1995), Lees et al. (1991), and Georgakakis et al. (2001) find only five with /MHI of at least 3, and these ratios are all based on HI upper limits except for NGC 2623 (see Table 2). The remaining six entries in Table 2 are H2 non-detections so the H2/HI ratios calculated for these galaxies are upper limits. The lenticulars which are studied in detail by Welch and Sage (2003) have H2/HI in the range 0.01 to 1.5 which may be related to the fact that their sample excludes Virgo cluster members.
In this paper we present a search for HI emission from the low-luminosity Virgo elliptical NGC 4476. The main challenge in this observation was to achieve good spectral dynamic range, since M87 is a strong radio source (220 Jy at 1.4 GHz). In Sec. 3 we describe the method used to achieve optimal bandpass calibration and continuum subtraction. No HI was detected in the entire 40′ by 40′ by 647 km s-1 data cube. In Sec. 4 we discuss the implications of this null result, and provide evidence that the HI gas has been stripped by the ICM surrounding M87 and/or the physical conditions of the ISM in NGC 4476 are very different than observed for normal stripped spirals. In Sec. 5 we discuss the effects of ram pressure on the star formation in NGC 4476. In Sec. 6 we present our conclusions.
2 NGC 4476
NGC 4476 is a small elliptical galaxy 12′ from M87. Measurements of the surface brightness fluctuations yield a distance of 17.21.4 Mpc (Tonry et al. 2001) and an absolute magnitude of 18.17 assuming a distance modulus of 31.18 0.17. The stellar kinematics are normal for a low-luminosity elliptical galaxy, with a central velocity dispersion of 132 km s-1 (Simien Prugniel 1997). Photometric observations show that NGC 4476 follows an r1/4 law throughout (Prugniel, Nieto, and Simien 1987). Dust is clearly seen on optical images, showing the presence of a nuclear dust ring (Tomita et al. 2000).
VLA 20 cm continuum observations of NGC 4476 in the B configuration yield an upper limit of 510-30 W m-2 Hz-1 or 0.5 mJy (Owen 2001, private communication). When compared to the IRAS observations (Knapp et al. 1989), the radio continuum observations indicate that NGC 4476 is an order of magnitude underluminous in the radio (q 3.3; Lucero & Young in prep.) compared to the radio-FIR correlation (Helou et al. 1985).
The galaxy appears to be optically undisturbed, and recent observations with the BIMA mm interferometer show a flat molecular disk in regular rotation which also appears to be undisturbed (Young 2002). H2 masses are calculated using galaxy distances and a “standard” CO/H2 conversion factor of 3.01020 cm-2(K km s-1)-1. With this conversion factor, H2 masses are related to CO fluxes SCO by:
| (1) |
Where D is the distance in Mpc and SCO is the CO flux in Jy km s-1. Using the CO flux from Young (2002), we calculate an H2 mass of 1.1108 . A previous search for HI in NGC 4476 puts an upper limit of 0.8 Jy km s-1 (approximately 6.1107 ) on the HI content (Giovanardi, Krumm, and Salpeter 1983) or M/MHI 2 and MHI/L 0.02. The present paper improves on that limit by a factor of 5, putting NGC 4476 in the same class as HI deficient spirals and ellipticals with typical ratios of M/MHI 10 (Knapp, Helou, Stark 1987) and (Georgakakis et al. 2000; Lees et al. 1991; Wiklind, Combes, Henkel 1995), respectively. Some physical parameters of NGC 4476 can be found in Table 3.
3 HI Observations and Strategy
The observations were made on 2002 January 5 with the VLA111The VLA is operated by the National Radio Astronomy Observatory, which is a facility of the National Science Foundation (NSF), operated under cooperative agreement by Associated Universities. in it’s D configuration. For a description of the VLA see Napier et al. (1983). We used a total bandwidth of 3.125 MHz to cover the velocity range from 2284 km s-1 to 1637 km s-1 at a resolution of 10.4 km s-1. The CO line is 200 km s-1 wide centered on 1960 km s-1 (Young 2002).
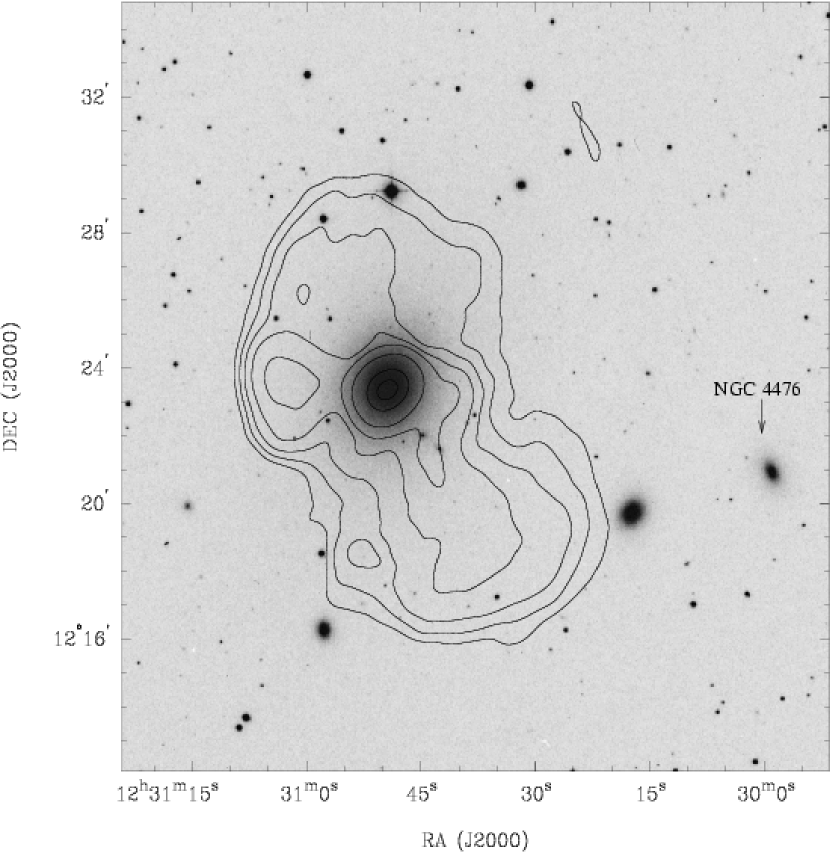
Since we are dealing with a very large and complicated continuum source (200 Jy) in the close vicinity of NGC 4476, we employ a strategy similar to that used by van Gorkom et al. (1993) to obtain a high dynamic range HI cube of 3C273. During our “on-source” observations, the phase center of the array was placed on M87. 3C286 was chosen as the bandpass calibrator and absolute flux standard. Fifteen minute scans were made of this source at the beginning and end of our observations. The flux density scale is based on an assumed value of 14.885 Jy for 3C286 at 1414.19 MHz (Perley 1992). The point source J1254+116 was used as the phase calibrator, and six one and a half minute scans were made every fifty minutes on this source. The total time on source was 4 hours. The theoretical noise level of these observations is 0.5 mJy beam-1 in a 10.4 km s-1 channel in the center of the field or 0.71 mJy beam-1 at the position of NGC 4476. The phase and gain are calibrated using the average of the inner 75 of the bandpass (known as the channel zero data). Standard calibration procedures were followed to produce a preliminary continuum image of the channel zero data. Our ultimate goal here is to remove all of the continuum associated with M87 and expose all of the underlying HI. Therefore, we need very high quality continuum calibration, which was achieved by self-calibrating the channel zero data. Self-calibration uses a clean component model of point sources in the image to estimate corrections in the complex antenna gains. The final continuum image has a peak intensity of 80 Jy beam-1, and an rms noise of 1 mJy beam-1, which give a dynamic range (peak intensity divided by noise level) of 80,000 to 1. The continuum image is shown in Figure 1.
3.1 Data Reduction
3.1.1 Bandpass Calibration
Since M87 is a very strong continuum source it is necessary to do very careful bandpass calibrations. Some of the VLA antennas show a variation of the bandpass with time due to a 3 MHz standing wave in the wave guide system. The standing wave pattern causes a time variable gain error of about 0.5 (Carilli 1991). It is necessary to calibrate out the time dependence of the gain when strong sources are present. After close inspection of the antenna-based complex bandpass functions, we found that our observations of 3C286 did not adequately model the time variability during the four hour interval between scans. Also, extra noise was introduced due to the fact that 3C286 gives significantly lower signal to noise than M87.
Therefore, we decided to use M87 as the bandpass calibrator. We found the signal to noise on M87 to be adequate to make bandpass solutions every three minutes. A potential problem with this technique is that HI absorption against M87 or HI emission close to the center of the field could cause spurious features in the frequency-dependent gain solutions (van Gorkom et al. 1993). The spurious features would have velocities and linewidths comparable to those of the spectral lines which caused them. However, there are stringent upper limits on HI absorption against M87 (NHI 5.01019 cm-2, assuming 210-4, and Ts=100 K; Dwarakanath et al. 1994) and this effect should be negligible.
After the bandpass calibration, some of the baselines still show a slight curvature of 0.1 in amplitude across the 3 MHz bandwidth. The origin of this residual large scale curvature is not clear; the features are too broad to be attributable to HI emission or absorption as described above.
3.1.2 Continuum Subtraction
Since errors in the continuum subtraction dominate the thermal noise in this dataset, we tried the following methods to subtract the continuum:
-
1.
The continuum was subtracted in the visibility plane using the AIPS routine UVLIN. UVLIN operates on each visibility independently, fits a linear spectral “baseline” to a selected group of channels, and then subtracts that fit from the data. UVLIN is expected to leave residuals which are strongest at the position of the strong continuum sources (Cornwell, Uson, & Haddad 1992). We tried this method using the channels 7-20 and 45-57, which lie outside the CO velocity range (there should be no HI line emission here). Because of residual curvature in the bandpass-calibrated visibility spectra (see above) and because only the end channels were used, the rms noise in this image cube is relatively high and is dominated by residual continuum features. Mapping these data using natural weighting resulted in a rms noise of 2.6 mJy beam-1. All of the noise levels quoted in this section are calculated in a 4′4′ box at the position of NGC 4476, before the application of a primary beam correction.
-
2.
Again beginning from the original self-calibrated dataset, we tried running UVLIN to fit the entire usable frequency range (channels 10-55; 1710-2178 km s-1). This method produced an rms of 1.4 mJy beam-1 at the position of NGC 4476.
-
3.
The continuum emission is very strong and complex on the shorter baselines, and much weaker on the longer baselines. Therefore, an additional improvement in the noise levels is achieved by restricting the map to the longer baselines (between 1 and 5 kilo-wavelengths). The combination of UVLIN (fitting the entire usable frequency range) and eliminating shorter baselines produces a data cube with an rms noise of 0.9 mJy beam-1.
-
4.
Since UVLIN leaves residuals at the position of strong continuum sources, we also tried the task UVSUB followed by UVLIN. UVSUB subtracts from the visibility data a Fourier sum of the clean components estimated by deconvolution of the continuum image. The use of UVSUB produced no improvement over steps 2 and 3 above.
-
5.
We believe that the difficulties in continuum subtraction are primarily due to the residual 0.1% curvature in the bandpass-calibrated visibility spectra. We thus attempted to remove the curvature using the AIPS task IMLIN, which fits the spectrum of each spatial pixel in an image cube (Cornwell, Uson, & Haddad 1992). We began with a cube made from a continuum-subtracted dataset (step 1 above) and used IMLIN to fit a second order polynomial to channels 7-20 and 45-57. This procedure brought the noise level down to 1.0 mJy beam-1.
-
6.
We also tried IMLIN alone, fitting a second order polynomial over the entire usable channel range (10-55). This method produced a rms of 1.4 mJy beam-1, comparable to that produced by using a linear fit with UVLIN over the entire channel range. Leaving out the baselines shorter than 1 kilowavelength produced a noise level of 0.9 mJy beam-1.
Steps 3, 5, and 6 produced non-primary beam corrected HI cubes of comparable quality. All of these HI cubes were imaged neglecting baselines 1 k and have a beam size of 46.7″ 42.1″ (3.9 3.5 kpc). By leaving out spacings less than 1 k we have reduced sensitivity to structures larger than 3.4′. However, the CO emission is only 30″ in diameter, so the lack of short spacings will only present a problem if the HI is distributed on size scales 7 times larger than the CO. HI upper limits in the following sections are derived from the cube(s) with noise level 1.0 mJy beam-1, which is still twice the theoretical noise. The primary beam correction caused the thermal noise to increase to 1.6 mJy beam-1 at the position of NGC 4476.
3.2 HI Limits
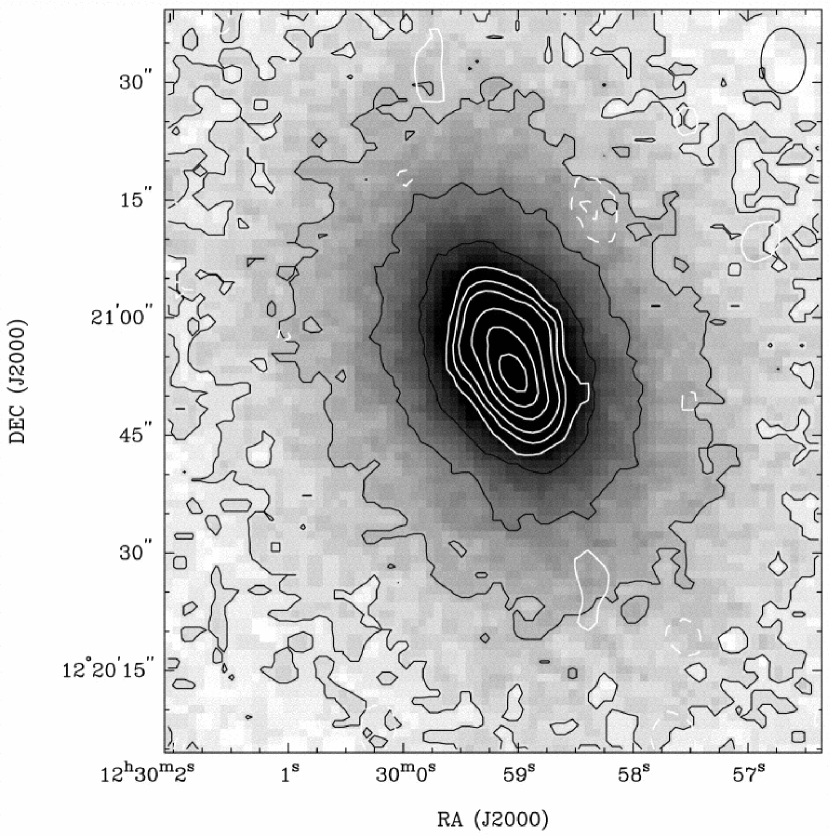
The primary beam-corrected HI spectrum is depicted in Figure 2. Spatial smoothing has not been employed since the CO emission is smaller than the 45″ beam of the D configuration. An HI mass limit can be obtained by integrating over the 200 km/s linewidth of the observed CO emission (20 channels, 2060-1860 km s-1), and we find 0.015 Jy km s-1. The uncertainty in the sum of 20 independent channels each of rms 1.6 mJy beam-1 is 0.072 Jy km s-1. Thus, a 3 upper limit yields 0.21 Jy km s-1 for the HI content of NGC 4476. The corresponding mass limit is M⊙ for an unresolved source, and the column density limit is cm-2.
Alternatively, if we choose not to assume that the HI covers the same velocity range as the CO, we may consider a six sigma limit of the flux from only one channel. Recall that the primary beam corrected rms noise in one 10 km s-1 channel is 1.6 mJy beam-1. If we use this approach we get an individual channel limit of 0.096 Jy beam-1 km s-1, which gives an HI column density limit of 5.41019 cm-2 or a mass limit of 6.7106. These upper limits put a lower limit to the H2/HI mass ratio of about 10 (ranging from 7 to 16 for the two different methods). H2/HI mass ratios of this magnitude make NGC 4476 the most HI deficient elliptical galaxy which is also known to have molecular gas. The absence of HI emission in NGC 4476 is surprising, given that a photo-dissociated envelope should form around the molecular gas (Blitz 1993; Savage et al. 1977; Lada et al. 1988).
4 Discussion
There are several possible reasons for the observed HI deficiency in NGC 4476. The HI may have been removed through a tidal interaction with another galaxy or by the ICM in the form of ram pressure stripping. As NGC 4476 is close to M87, there are many galaxies in the vicinity which are candidates for gravitational interactions with NGC 4476. The two closest in projection and in luminosity are NGC 4478 (4′ away, km s-1) and NGC 4486B (11′, km s-1). Both of these galaxies show evidence of tidal truncation and NGC 4478 also shows an isophote twist (van den Bosch et al. 1994). However, it is usually assumed that their tidal features are due to interactions with M87 rather than with NGC 4476. NGC 4476 itself shows no hint of disruption either in the optical or in CO emission (van den Bosch et al. 1994; Young 2002), but the detectability of tidal features does depend somewhat on the geometry of the interaction. We can neither confirm nor disprove the hypothesis that the extreme HI deficiency in NGC 4476 is due to a gravitational encounter with another galaxy. However, consideration of ram pressures shows that it is highly likely that NGC 4476 has suffered some ram pressure stripping.
4.1 Ram pressure stripping
The Virgo Cluster can be broken up into two major sub-clusters. These sub-clusters are centered on the two brightest galaxies in the cluster, M87 and NGC 4472 (Ferrarese et al. 2000). The distance to the M87 sub-cluster has been determined to be 18 Mpc by the use of Cepheid variables (Ferrarese et al. 2000). The distances to M87 and NGC 4476 have also been determined to be 16.11.2 Mpc and 171.4 Mpc, respectively, using the surface brightness fluctuation (SBF) method (Tonry et al. 2001). Therefore, we start our analysis by assuming that NGC 4476 is a Virgo Cluster member, and we adopt a distance of 17 Mpc for both M87 and NGC 4476. M87 and NGC 4476 are 12′ apart which translates to a separation of 60.0 kpc.
The limits by Tonry (2001) locate NGC 4476 well within the Virgo Cluster. Its high radial velocity, 1978 km s-1, makes it likely that it is in the central region of Virgo since a galaxy on a radial orbit through the cluster reaches its highest velocity in the central region (Solanes et al. 2001, Giovanelli Haynes 1985, Dressler 1986, Vollmer et al. 2001). Given that, and given the very small projected distance to M87, we can now make some estimates as to how close together the galaxies really are and how effective ram pressure stripping will be at that separation.
The gas in the galactic disk of NGC 4476 will be removed if the ram pressure of the ICM is greater than the restoring gravitational force per unit area (Gunn and Gott 1972). This relationship is given by:
| (2) |
where , Vrot, R, , and Vgal are the mass density of the gas disk, the rotational velocity of the gas, the radius of the gas disk, the ICM density, and the velocity of the galaxy through the ICM, respectively. is defined as:
| (3) |
where Mgas and Adisk are the mass of the gas in the disk and the surface area of the gas disk, respectively. ROSAT observations (Böhringer et al. 1994) show that the Virgo Cluster core is filled with hot gas and that the M87 sub-cluster has the strongest X ray emission. According to Ferrarese (2000), to first order, M87 is at the center of the X-ray emitting corona. The ICM density at the 60 kpc distance from M87 is 3.6010-3 cm-3 (Nulsen Böhringer 1995). Assuming that the gas at this distance is fully ionized and that the bulk of the mass comes from the protons, the mass density is given by:
| (4) |
where ne is the electron density, Mp is the proton mass, and 1.15 is the mean mass per electron (including a contribution from helium). The heliocentric velocities of NGC 4476 and M87 are 1978 km s-1 (Simien Prugniel 2001) and 1307 km s-1 (Smith et al. 2000), respectively. The velocity of M87 is 200 km s-1 off from the mean velocity of the M87 subcluster (Ferrarese et al. 2000). Therefore, if we subtract the radial velocities of NGC 4476 and M87 we obtain a lower limit to the relative velocity of NGC 4476 with respect to the ICM. This gives a ram pressure of 3.110-12 N m-2 at 60 kpc from M87.
The CO disk rotates at 105 km s-1, and has a radius, RCO, of 1.2 kpc. The H2 mass is 1.1108 (Young 2002), and therefore the gas surface density is 24 M⊙ pc-2. This value is a lower limit to the total gas surface density because it does not include HI or helium, and it is also an average over the whole disk, whereas the H2 may be clumpy as in Cen A (Quillen et al. 1992). The total restoring pressure exerted on the molecular disk by gravity is 1.510-11 N m-2. Therefore, the ram pressure exerted on NGC 4476 is not sufficient to strip the observed CO disk at the galaxy’s current projected distance from M87. In fact, for a relative galaxy-ICM velocity of 671 km s-1, the galaxy must get within 10 to 20 kpc of the center of M87 before the ICM densities are large enough, 3.510-26 g cm-3, to strip the observed molecular gas disk. Alternatively, at the current projected distance from M87, the velocity of NGC 4476 through the intracluster medium would need to be on the order of 1470 km s-1 for molecular gas to be stripped.
It is important to keep in mind that there are several uncertainties in these calculations. The true relative velocity of the galaxy and the ICM is probably larger than 671 km s-1, which of course is only the radial component. The true separation of the galaxies is probably larger than the projected separation. Finally, the inclination angle between the disk’s spin axis and its velocity through the ICM is unknown. Kenney, van Gorkom, & Vollmer (2004) have argued that stripping rates should be proportional to , so that stripping is much less effective for galaxies proceeding edge-on through the ICM. Schulz & Struck (2001) suggested that the dependence on inclination would not be as strong as on long timescales due to viscous effects. In short, the conditions which we estimate to be necessary for stripping are only accurate to factors of a few.
Studies of spiral galaxies in clusters have revealed that the CO content in these galaxies does not appear to depend on environment (Stark et al. 1986; Kenney and Young 1989). Our results indicate that low-luminosity ellipticals probably behave like spirals in this respect, i.e. it’s difficult to strip the molecular gas. We know of one counterexample, however: a recent study of the ISM in the spiral galaxy NGC 4522 indicates that some of the CO in the outer parts of this galaxy has also been stripped (Kenney, Van Gorkom, Vollmer 2004).
The radial distribution of CO in many Sc galaxies resembles an exponential with a scale length similar to that of the starlight (Young Scoville 1991). We also model the original (pre-stripping) gas distribution of NGC 4476 as an exponential:
| (5) |
where is the present molecular surface density (24 M⊙ pc-2) and the scale length is equal to the effective radius of the galaxy (15″ 1.2 kpc, Simien Prugniel 1997). The maximum extent of the present CO disk is also 1.2 kpc. In this model, the present ram pressure exerted on NGC 4476 is sufficient to strip all of its ISM at radii beyond 1.7 kpc. A velocity of 890 km s-1 would be sufficient to strip all ISM at radii beyond 1.2 kpc, where the model disk’s gas density drops to 9 M⊙ pc-2.
Our HI column density limits for NGC 4476 are certainly low enough that stripping of the outer HI disk is plausible. Based on position-velocity diagrams for other ellipticals, we assume that the HI disk would have a flat rotation curve beyond the edge of the molecular gas at 1.2 kpc (Young 2002; Osterloo, Morganti, Sadler 1999). The HI column density limit of 1.2 cm-2 and assumed HI disk velocity (105 km s-1) give a restoring pressure of 6.010-13 N m-2 at a radius of 1.2 kpc. The ICM density needed to equalize the ram pressure and restoring pressure is only cm-3. According to Nulsen Böhringer (1995), this ICM density is located a distance 200 kpc from M87. Therefore, we can say that unless NGC 4476 has always remained farther than 200 kpc from M87 (ICM densities at this distance are too low to remove any HI), the stripping explanation is at least consistent with the observed low HI column densities. All of the ISM and ICM gas properties derived in this section can be found in Table 4.
The distance estimates discussed in the early part of this section are not accurate enough to specify whether NGC 4476 is in the foreground of M87 and approaching the cluster core, or is in the background of M87 and receding from it. Using a N-body/sticky-particle code to simulate the time variable ram pressure that a galaxy would feel as it moves through the Virgo Cluster core, Vollmer et al. (2001) find that the maximum damage to a galaxy’s HI disk only becomes apparent long after closest approach to the cluster center. Therefore, if the HI disk in NGC 4476 has indeed been completely stripped, then it is very likely that the galaxy has already passed through the cluster center.
4.2 A central HI hole?
The nondetection of HI emission from NGC 4476 was a bit of a surprise, given the abundance of molecular gas in the galaxy. In most of the HI-deficient Virgo spirals, the inner disks remain intact and are detected both in HI and in CO (Kenney Young 1989). The peak HI and H2 column densities in these galaxies are 51020 cm-2 and cm-2, respectively (Cayatte et al. 1994; Kenney Young 1989, Kenney, van Gorkom, and Vollmer 2004). Thus, while the peak H2 column density of NGC 4476 is a factor of a few higher than typical values from Kenney & Young’s sample – the exact factor is resolution dependent, of course – the HI column density in NGC 4476 is at least a factor of five lower than in the spirals.
Low HI column densities are also seen in the centers of early-type spirals (Roberts & Haynes 1994; van Driel & van Woerden 1991). Perhaps, then, HI is not detected in the center of NGC 4476 because it has (or had, prior to stripping) a central HI hole like those in the early-type spirals. It is worth noting, however, that HI maps of low-luminosity ellipticals and E/S0s usually show centrally peaked HI distributions, not central holes (Lake et al. 1987; Oosterloo, Morganti, & Sadler 1999; Sadler et al. 2000). It would certainly be valuable to compare HI and H2 maps of other gas-rich ellipticals to see if they also show low HI column densities in regions where H2 is present. We could then investigate the balance of the atomic and molecular phases in these galaxies.
If the interstellar medium of NGC 4476 has atomic and molecular hydrogen in equilibrium, we can use the observed molecular column densities to estimate expected HI column densities. For these estimates we apply the models of photodissociation regions presented by Allen et al. (2004). The observed peak CO intensity is 12.4 Jy beam-1 km s-1 or 24.3 K km s-1 (Young 2002). This CO intensity can be consistent with our nondection of HI ( 1020 cm-2) if and only if the molecular clouds’ average density is greater than 103 cm-3 and the UV field G∘ 1 (in units where the “Habing Field” over 4 steradians is G∘=1.7). CO observations of other spiral galaxies typically trace gas of average densities in the range to cm-3. Thus, either the HI column density in NGC 4476 is low because the molecular clouds have higher density and lower interstellar UV fields than are common for spirals, or the HI column density is low because of a recent ram pressure stripping event, or both. The prediction of higher than average molecular gas densities in NGC 4476 could be tested with observations of higher density molecular tracers.
5 The Environmental impact on the Star Formation rate on NGC 4476
Studies of Virgo Cluster spirals show that these galaxies are deficient in HI and have reduced star formation rates in their outer disks, while the star formation in the inner disk is normal or enhanced. It has been suggested that the HI deficiency is due to the systematic removal of gas from the outer parts of the galaxies through ram pressure stripping (van Gorkom 2004; Koopmann Kenney 2002; Vollmer 2003). If this is indeed the case, and gas-rich ellipticals must suffer ram pressure stripping just as gas-rich spirals do, then the star formation in stripped ellipticals should be reduced as is observed for stripped disk galaxies.
The standard tracers of star formation activity, such as H emission, are often detected in elliptical galaxies and are usually attributed to AGN activity, post-AGB stars, or cooling from hot gas rather than to star formation. But in the case of NGC 4476, which is known to contain appreciable amounts of molecular gas, we propose to use far-IR (FIR) luminosity as an indicator of star formation activity. The star formation rate (SFR) is calculated using the method derived by Condon, Cotton, and Broderick (2002):
| (6) |
The IRAS 60 and 100 fluxes of NGC 4476 (Knapp et al. 1989) give a FIR luminosity 4.3108 L⊙ and a star formation rate 0.2 yr-1 in stars with masses greater than 0.1 . If we divide the H2 mass by the star formation rate we obtain a depletion timescale of approximately 5108 years. This timescale is very similar to those of the other CO-rich early type galaxies in Young’s (2002) sample ( 3–10108 years; Lucero Young 2004 in preparation). The other galaxies of that sample are field galaxies, so there is no evidence here that the star formation efficiency in NGC 4476 has been affected by ram pressure stripping.
One may also attempt to measure a star formation rate from the radio continuum emission of a galaxy, if the emission is not produced by an AGN (Miller & Owen 2002; Condon 1992). But as mentioned in Section 2, a deep VLA image of M87 gives only an upper limit of 0.5 mJy for the flux density of NGC 4476 at 20cm (Owen 2001, private communication). This limit and the IRAS fluxes give a logarithmic FIR/radio flux density ratio ( value; Condon, Anderson, & Helou 1991) of . The average value for star forming galaxies is 2.3 with a dispersion of about 0.15 (Yun, Reddy, & Condon 2001), so that the FIR/radio flux density ratio in NGC 4476 is a factor of 10 higher than is typical for star forming galaxies. It is well known that values tend to increase at low luminosities (Yun et al. 2001; Condon et al. 1991) but the value for NGC 4476 is higher than any found in the Yun et al. (2001) sample. Of course, the theoretical basis for the radio-FIR correlation (and for its change in slope at low luminosities) has not been firmly established.
6 Conclusions
In this paper we present high dynamic range HI observations of the
low-luminosity elliptical galaxy NGC 4476. In summary:
The spectral dynamic range of the final image (estimated as the
peak continuum intensity in the field divided by the rms noise level in
spectral channels) is 50,000.
Our observations yield an upper limit to the HI mass of the
galaxy of approximately 107 .
Assuming a minimum radius equal to that of the CO disk
radius, we obtain an HI surface density of
1.5 pc-2.
The ratio of the molecular gas mass to atomic gas mass in
the galaxy is 7, which puts NGC 4476 among the most seriously HI
deficient (compared to H2) cluster galaxies.
An analysis of these new HI data suggest that the HI in NGC
4476 may have been removed due to ram-pressure stripping as the galaxy
traveled on a highly radial orbit through the Virgo Cluster core. It is
puzzling that there is no HI left in the inner disk, unless the
physical conditions in the molecular ISM of NGC 4476 are very different
(about a factor of 10 higher average density, coupled with
lower UV fields) from
those of typical Virgo spirals.
References
- Allen (1969) Allen, R. J. 1969, A&A, 3, 382
- Allen et al. (2004) Allen, R. J., Heaton, H. I., & Kaufman, M. J. 2004, astro-ph/0402383
- Bhringer et al. (1994) Bhringer, H., Briel, U. G., Schwarz, R. A., Voges, W., Hartner, G., & Trumper, J. 1994, Nature, 368, 828
- Bravo-Alfaro et al. (2000) Bravo-Alfaro, H., Cayatte, V., van Gorkom, J. H., & Balkowski, C. 2000, AJ, 119, 580
- Carilli (1991) Carilli, C. L. 1991, VLA test memo No. 158
- Cayatte et al. (1994) Cayatte, V., Kotanyi, C., Balkowski, C., & van Gorkom, J. H. 1994, AJ, 107, 1003
- Cayatte et al. (1990) Cayatte, V., Van Gorkom, J. H., Balkowski, C., & Kotanyi, C. 1990, AJ, 100, 604
- Colbert et al. (2001) Colbert, J. W., Mulchaey, J. S., & Zabludoff, A. I. 2001, AJ, 121, 808
- Condon (1992) Condon, J. J. 1992, ARA&A, 30, 575
- Condon et al. (1991) Condon, J. J., Anderson, M. L., & Helou, G. 1991, ApJ, 376, 95
- Condon et al. (2002) Condon, J. J., Cotton, W. D., & Broderick, J. J. 2002, AJ, 124, 675
- Cornwell et al. (1992) Cornwell, T. J., Uson, J. M., & Haddad, N. 1992, A&A, 258, 583
- Dwarakanath et al. (1994) Dwarakanath, K. S., van Gorkom, J. H., & Owen, F. N. 1994, ApJ, 432, 469
- Ferrarese et al. (2000) Ferrarese, L., Ford, H. C., Huchra, J., Kennicutt, R. C., Mould, J. R., Sakai, S., Freedman, W. L., Stetson, P. B., Madore, B. F., Gibson, B. K., Graham, J. A., Hughes, S. M., Illingworth, G. D., Kelson, D. D., Macri, L., Sebo, K., & Silbermann, N. A. 2000, ApJS, 128, 431
- Georgakakis et al. (2001) Georgakakis, A., Hopkins, A. M., Caulton, A., Wiklind, T., Terlevich, A. I., & Forbes, D. A. 2001, MNRAS, 326, 1431
- Giovanardi et al. (1983) Giovanardi, C., Krumm, N., & Salpeter, E. E. 1983, AJ, 88, 1719
- Giovanelli & Haynes (1985) Giovanelli, R., & Haynes, M. P. 1985, ApJ, 292, 404
- Gunn & Gott (1972) Gunn, J. E., & Gott, J. R. I. 1972, ApJ, 176, 1
- Helou et al. (1985) Helou, G., Soifer, B. T., & Rowan-Robinson, M. 1985, ApJ, 298, L7
- Henriksen & Byrd (1996) Henriksen, M., & Byrd, G. 1996, ApJ, 459, 82
- Hibbard & van Gorkom (1996) Hibbard, J. E., & van Gorkom, J. H. 1996, AJ, 111, 655
- Huchtmeier et al. (1995) Huchtmeier, W. K., Sage, L. J., & Henkel, C. 1995, A&A, 300, 675
- Kenney et al. (2004) Kenney, J. D. P., van Gorkom, J. H., & Vollmer, B. 2004, AJ, 127, 3361
- Kenney & Young (1989) Kenney, J. D. P., & Young, J. S. 1989, ApJ, 344, 171
- Knapp et al. (1989) Knapp, G. R., Guhathakurta, P., Kim, D., & Jura, M. A. 1989, ApJS, 70, 329
- Knapp et al. (1987) Knapp, G. R., Helou, G., & Stark, A. A. 1987, AJ, 94, 54
- Koopmann & Kenney (2002) Koopmann, R. A., & Kenney, J. D. P. 2002, astro-ph/0209547
- Lada et al. (1988) Lada, C. J., Margulis, M., Sofue, Y., Nakai, N., & Handa, T. 1988, ApJ, 328, 143
- Lake et al. (1987) Lake, G., Schommer, R. A., & van Gorkom, J. H. 1987, ApJ, 314, 57
- Larson et al. (1980) Larson, R. B., Tinsley, B. M., & Caldwell, C. N. 1980, ApJ, 237, 692
- Lees (1990) Lees, J. F. 1990, BAAS, 22, 1310
- Lees et al. (1991) Lees, J. F., Knapp, G. R., Rupen, M. P., & Phillips, T. G. 1991, ApJ, 379, 177
- Mihos (2004) Mihos, J. C. 2004, in Clusters of Galaxies: Probes of Cosmological Structure and Galaxy Evolution, 278
- Miller & Owen (2002) Miller, N. A., & Owen, F. N. 2002, AJ, 124, 2453
- Moore et al. (1998) Moore, B., Lake, G., & Katz, N. 1998, ApJ, 495, 139
- Napier et al. (1983) Napier, P. J., Thompson, A. R., & Ekers, R. D. 1983, IEEE Proceedings, 71, 1295
- Nulsen (1982) Nulsen, P. E. J. 1982, MNRAS, 198, 1007
- Nulsen & Bohringer (1995) Nulsen, P. E. J., & Bohringer, H. 1995, MNRAS, 274, 1093
- Oosterloo et al. (1999) Oosterloo, T., Morganti, R., & Sadler, E. 1999, Publications of the Astronomical Society of Australia, 16, 28
- Perley (1992) Perley, R. A. 1992, VLA observational status summary
- Prugniel et al. (1987) Prugniel, P., Nieto, J.-L., & Simien, F. 1987, A&A, 173, 49
- Quillen et al. (1992) Quillen, A. C., de Zeeuw, P. T., Phinney, E. S., & Phillips, T. G. 1992, ApJ, 391, 121
- Roberts & Haynes (1994) Roberts, M. S., & Haynes, M. 1994, in Dwarf Galaxies, 197
- Sadler et al. (2000) Sadler, E. M., Oosterloo, T. A., Morganti, R., & Karakas, A. 2000, AJ
- Sage & Wrobel (1989) Sage, L. J., & Wrobel, J. M. 1989, ApJ, 344, 204
- Savage et al. (1977) Savage, B. D., Drake, J. F., Budich, W., & Bohlin, R. C. 1977, ApJ, 216, 291
- Schindler et al. (1999) Schindler, S., Binggeli, B., & Böhringer, H. 1999, A&A, 343, 420
- Schulz & Struck (2001) Schulz, S., & Struck, C. 2001, MNRAS, 328, 185
- Simien & Prugniel (1997) Simien, F., & Prugniel, P. 1997, VizieR Online Data Catalog, 412, 60519
- Simien & Prugniel (2002) —. 2002, A&A, 384, 371
- Smith et al. (2000) Smith, R. J., Lucey, J. R., Hudson, M. J., Schlegel, D. J., & Davies, R. L. 2000, MNRAS, 313, 469
- Solanes et al. (2001) Solanes, J. M., Manrique, A., García-Gómez, C., González-Casado, G., Giovanelli, R., & Haynes, M. P. 2001, ApJ, 548, 97
- Stark et al. (1986) Stark, A. A., Knapp, G. R., Bally, J., Wilson, R. W., Penzias, A. A., & Rowe, H. E. 1986, ApJ, 310, 660
- Struck (1999) Struck, C. 1999, in IAU Symp. 186: Galaxy Interactions at Low and High Redshift, 134
- Thronson et al. (1989) Thronson, H. A., Tacconi, L., Kenney, J., Greenhouse, M. A., Margulis, M., Tacconi-Garman, L., & Young, J. S. 1989, ApJ, 344, 747
- Tomita et al. (2000) Tomita, A., Aoki, K., Watanabe, M., Takata, T., & Ichikawa, S. 2000, AJ, 120, 123
- Tonry et al. (2001) Tonry, J. L., Dressler, A., Blakeslee, J. P., Ajhar, E. A., Fletcher, A. B., Luppino, G. A., Metzger, M. R., & Moore, C. B. 2001, ApJ, 546, 681
- Toomre & Toomre (1972) Toomre, A., & Toomre, J. 1972, ApJ, 178, 623
- Valluri & Jog (1990) Valluri, M., & Jog, C. J. 1990, ApJ, 357, 367
- van den Bosch et al. (1994) van den Bosch, F. C., Ferrarese, L., Jaffe, W., Ford, H. C., & O’Connell, R. W. 1994, AJ, 108, 1579
- van Driel & van Woerden (1991) van Driel, W., & van Woerden, H. 1991, A&A, 243, 71
- van Gorkom & Schiminovich (1997) van Gorkom, J., & Schiminovich, D. 1997, in ASP Conf. Ser. 116: The Nature of Elliptical Galaxies; 2nd Stromlo Symposium, 310
- van Gorkom (2004) van Gorkom, J. H. 2004, in Clusters of Galaxies: Probes of Cosmological Structure and Galaxy Evolution, from the Carnegie Observatories Centennial Symposia. Published by Cambridge University Press, as part of the Carnegie Observatories Astrophysics Series. Edited by J.S. Mulchaey, A. Dressler, and A. Oemler, 2004, p. 306., 306
- van Gorkom et al. (1993) van Gorkom, J. H., Bahcall, J. N., Jannuzi, B. T., & Schneider, D. P. 1993, AJ, 106, 2213
- van Gorkom et al. (1989) van Gorkom, J. H., Knapp, G. R., Ekers, R. D., Ekers, D. D., Laing, R. A., & Polk, K. S. 1989, AJ, 97, 708
- Vollmer (2003) Vollmer, B. 2003, A&A, 398, 525
- Vollmer et al. (2001) Vollmer, B., Cayatte, V., Balkowski, C., & Duschl, W. J. 2001, ApJ, 561, 708
- Vollmer et al. (1999) Vollmer, B., Cayatte, V., Boselli, A., Balkowski, C., & Duschl, W. J. 1999, A&A, 349, 411
- Warmels (1988) Warmels, R. H. 1988, A&AS, 72, 427
- Welch & Sage (2003) Welch, G. A., & Sage, L. J. 2003, ApJ, 584, 260
- Wiklind et al. (1995) Wiklind, T., Combes, F., & Henkel, C. 1995, A&A, 297, 643
- Wiklind et al. (1997) Wiklind, T., Combes, F., Henkel, C., & Wyrowski, F. 1997, A&A, 323, 727
- Wong et al. (2004) Wong, T., Blitz, L., & van der Hulst, J. M. 2004, Ap&SS, 289, 211
- Wrobel & Heeschen (1988) Wrobel, J. M., & Heeschen, D. S. 1988, ApJ, 335, 677
- Wrobel & Heeschen (1991) —. 1991, AJ, 101, 148
- Wrobel & Kenney (1992) Wrobel, J. M., & Kenney, J. D. P. 1992, ApJ, 399, 94
- Young & Scoville (1991) Young, J. S., & Scoville, N. Z. 1991, ARA&A, 29, 581
- Young (2002) Young, L. M. 2002, AJ, 124, 788
- Yun et al. (2001) Yun, M. S., Reddy, N. A., & Condon, J. J. 2001, ApJ, 554, 803

| Galaxy | Type | RA | DEC | Vhelio | H2/HI | MB | Environment |
|---|---|---|---|---|---|---|---|
| (J2000) | (J2000) | km s-1 | |||||
| NGC 4388 | Sab | 12h25m46.7s | 12d39m44s | 2525 | 10aaKnapp et al. 1987 | 19.37 | 1.3 degrees from M87. |
| NGC 4647 | Sc | 12h43m32.3s | 11d34m55s | 1422 | 20.6aaKnapp et al. 1987 | 19.19 | 3.4 degrees from M87. |
| NGC 4419 | Sa | 12h26m56.4s | 15d02m51s | 261 | 25.3bbKenney Young 1989 | 18.57 | 1.0 degrees from core of subcluster A. |
| NGC 4459 | SO/Sa | 12h29m00.0s | 13d58m43s | 1210 | 100ccThronson et al. 1989 | 19.72 | 2.2′ away from companion, 1.6 degrees from M87. |
| NGC 4526 | SO/Sa | 12h34m02.2s | 07d41m31s | 448 | 50ccThronson et al. 1989 | 20.48 | 5 degrees from M87 |
| NGC 4710 | SO/Sa | 12h49m38.9s | 15d09m56s | 1125 | 30ddWrobel Kenney 1992 | 19.22 | 6 degrees from M87 |
Note. — Galaxy classifications are as given by individual authors.
| Galaxy | Type | RA | DEC | Vhelio | H2/HI | MB | Environment |
|---|---|---|---|---|---|---|---|
| (J2000) | (J2000) | ||||||
| NGC 2623 | E/Ir | 08h38m24.080s | 25d45m16.90s | 5535 | 3.0ccGeorgakakis et al. 2002 | 25.43 | member of a small group. |
| Merger remnant, small radio core. | |||||||
| HI nondetections | |||||||
| NGC 4476 | E/SO | 12h29m59.1s | 12d20m55s | 1978 | 4.0aaLees, Knapp, Rupen, and Phillips 1991 | 18.17 | 12′from M87. |
| NGC 1275 | E | 03h19m48.1s | 41d30m42s | 5264 | 3.4aaLees, Knapp, Rupen, and Phillips 1991 | 21.50 | Perseus cluster member. |
| Known to have AGN. | |||||||
| NGC 2783 | E7 | 09h13m39.4s | 29d59m35s | 6745 | 3.4bbWiklind, Combes, and Henkel 1995 | 19.80 | Member of a small compact group |
| NGC 7052 | E4 | 21h18m33.0s | 26d26m49s | 4672 | 3.2bbWiklind, Combes, and Henkel 1995 | 20.30 | Field galaxy with no nearby companion. |
| Known to have AGN. | |||||||
| H2 nondetections | |||||||
| Haro 20 | E/Ir | 03h28m14.532s | 17d25m10.49s | 1866 | 57.6aaLees, Knapp, Rupen, and Phillips 1991 | 16.3 | Field galaxy. |
| NGC 3226 | E2 | 10h23m27.000s | 19d53m54.36s | 1151 | 56aaLees, Knapp, Rupen, and Phillips 1991 | 18.2 | Member of Interacting pair, AGN. |
| NGC 3773 | E1/SO | 11h38m12.97s | 12d06m42.9s | 987 | 6.7aaLees, Knapp, Rupen, and Phillips 1991 | 17.0 | Merger remnant |
| NGC 5018 | E3 | 13h13m00.99s | 19d31m05.1s | 2794 | 3.8aaLees, Knapp, Rupen, and Phillips 1991 | 19.3 | Field galaxy, non-interacting |
| companion. | |||||||
| NGC 5363 | E3p/IO | 13h56m07.24s | 05d15m17.0s | 1139 | 9.5aaLees, Knapp, Rupen, and Phillips 1991 | 19.2 | Field galaxy with non-interacting |
| companion | |||||||
| IC 1182 | EOp/SO | 16h05m36.798s | 17d48m07.70s | 10240 | 43aaLees, Knapp, Rupen, and Phillips 1991 | 20 | Known to have AGN |
Note. — Galaxy classifications are as given by individual authors.
| Other names | UGC 07637 |
|---|---|
| VCC 1250 | |
| CGCG 070-128 | |
| (J2000) | 12h29m59.1s |
| (J2000) | 12d20m55s |
| Morphological typeaaKnapp et al.1989 | E/SO |
| Distance to M87 (arcmin) | 12 |
| Heliocentric velocity (km/s)bbSimien Prugniel 2002 | 1978 12 |
| Distance D (Mpc) | 171.4 |
| H2 mass (M⊙)ccYoung 2002 | |
| LFIR, L⊙ | 4.3 |
| L1.4GHz, W m-2 |
| 1.2 | |
| aaDensity of the ICM at the projected distance of 60 kpc, given by Nulsen Böhringer 1995. (cm-3) | 3.610-3 |
| bbRotational velocity of the CO disk (Young 2002). We adopt this velocity as the HI rotational velocity. (km s-1) | 105 |
| (km s-1) | 671 |
| (N m-2) | 3.110-12 |
| ( pc-2) | 24.3 |
| NHI cm-2 | |
| …3 integrated limit: | 1.21020 |
| …6 individual channel limit: | 5.41019 |
| ( pc-2): | |
| …3 integrated limit: | 1.0 |
| …6 individual channel limit: | 0.4 |
| M(H2)/M(HI): | |
| …3 integrated limit: | 7 |
| …6 individual channel limit: | 16 |
| Restoring Pressure for HI: | |
| P (N m-2): | |
| …3 integrated limit: | 6.010-13 |
| …6 individual channel limit: | 2.710-13 |
| Restoring Pressure for H2: | |
| P (N m-2) | 1.510-11 |
| Star Formation Rate | 0.2 |