33email: theis@astro.univie.ac.at 44institutetext: Observatoire Astronomique de Strasbourg, 11, rue de l’Université, F–67000 Strasbourg, France
44email: cmb@pleiades.u-strasbg.fr
The great disk of Milky-Way satellites and cosmological sub-structures
We show that the shape of the observed distribution of Milky Way (MW) satellites is inconsistent with being drawn from a cosmological sub-structure population with a confidence of 99.5 per cent. Most of the MW satellites therefore cannot be related to dark-matter dominated satellites.
Key Words.:
Cosmology – Galaxy: evolution – Galaxy: halo – galaxies: dwarf – galaxies: kinematics and dynamics – Local Group1 Introduction
Calculations of structure formation within the framework of cold dark matter (CDM) cosmology show that Milky Way (MW) type systems have the same scaled theoretical distribution of sub-haloes as rich galaxy clusters, and within 500 kpc they should contain about 500 sub-haloes with masses (Moore et al. moore99 (1999); Klypin et al. klypin99 (1999); Governato et al. 2004). However, only 13 dwarves have been found within a distance of 500 kpc around the MW. The observed dwarves may only sample a sub-set of the actually present CDM sub-structures (Stoehr et al. 2002; Hayashi et al. 2003; Bullock et al. 2000; Susa & Umemura 2004; Kravtsov, Gnedin & Klypin 2004). Such biasing could be the result of complex early baryonic physics that cannot, at present, be treated theoretically in sufficient detail, but Kazantzidis et al. (2004) point out that this cannot be the entire solution.
An additional path to testing predictions of CDM cosmology is to compare the shape of the observed satellite distribution to the theoretical shapes (Zaritsky & Gonzalez 1999; Hartwick 2000; Sales & Lambas 2004). The sub-structures fall inwards from filaments that are thicker than the virialised regions of the hosts. However, within its virialised region, the number distribution of sub-structure in a theoretical host halo follows that of its dark-matter (DM) distribution. CDM models predict the host DM haloes to be oblate with flattening increasing with increasing mass and radius (Combes 2002; Merrifield 2002). The ratio of minor to major axis of the DM density distribution has the value for MW-sized haloes within the virial radius. The intermediate to major axis ratio is (Bullock 2002). When dissipational baryonic physics is taken into account the haloes become more axis-symmetric (larger ) and more flattened, within the virial radius. The minor axis is co-linear to the angular momentum of the baryonic disk (Dubinski 1994). Prolate haloes do not emerge. The empirical evidence is that the MW dark halo is somewhat flattened (oblate) with within kpc (Olling & Merrifield 2000, 2001; Ibata et al. 2001; Majewski et al. 2003; Martínez-Delgado et al. 2004). Beyond this distance the shape is likely to be more oblate (Bullock 2002), but invoking continuity the axis ratio cannot change drastically. The theoretical sub-structure distribution of MW-type hosts must therefore be essentially isotropic (Ghigna et al. 1998; Zentner & Bullock zentner03 (2003); Diemand, Moore & Stadel 2004; Kravtsov et al. 2004; Aubert et al. aubert04 (2004)).
If the MW dwarves do indeed constitute the shining fraction of DM sub-structures, then their number-density distribution should be consistent with an isotropic (i.e. spherical) or oblate power-law radial parent distribution. This is assumed to be the case by most researchers, given the relatively small number of satellites. With this contribution we show that, despite its smallness, the MW satellite sample is inconsistent with a cosmological sub-structure population. We do this by concentrating on the most elementary facts, namely purely on the positions of the satellites.
2 Dwarf galaxies near the Milky Way
Table 1 lists distances and coordinates of the dwarves closest to the MW. Given these data Galactocentric coordinates are calculated, , with uncertainties derived from the uncertainties in .
| satellite | Name | |||||||||||
|---|---|---|---|---|---|---|---|---|---|---|---|---|
| number | [kpc] | [kpc] | [deg] | [deg] | [kpc] | [kpc] | [kpc] | [kpc] | [kpc] | |||
| 1(1) | 24 | 2 | 5.6 | 16 | Sgr | – | – | – | – | – | ||
| 2(2) | 50.8 | 2.2 | 280.5 | 50 | LMC | – | – | – | – | – | ||
| 3(-) | 59.7 | 2.2 | 302.8 | 57 | SMC | – | – | – | – | – | ||
| 4(-) | 66 | 3 | 105.0 | 68 | UMi | 68 | 2.5 | 0.04 | 0.6 | 23 | ||
| 5(3) | 79 | 4 | 287.5 | 79 | Sculptor | 79 | 11.8 | 0.15 | 3.0 | 27 | ||
| 6(4) | 82 | 6 | 86.4 | 82 | Draco | 82 | 11.0 | 0.13 | 3.2 | 28 | ||
| 7(5) | 86 | 4 | 243.5 | 89 | Sextans | 89 | 13.5 | 0.15 | 1.2 | 30 | ||
| 8(6) | 101 | 5 | 260.1 | 103 | Carina | 103 | 14.2 | 0.14 | 1.4 | 34 | ||
| 9(7) | 138 | 8 | 237.1 | 140 | Fornax | 140 | 23.9 | 0.17 | 2.0 | 47 | ||
| 10(8) | 205 | 12 | 220.2 | 208 | LeoII | 208 | 23.2 | 0.11 | 1.9 | 69 | ||
| 11(9) | 250 | 30 | 226.0 | 254 | LeoI | 254 | 26.4 | 0.10 | 1.9 | 85 | ||
| 12(10) | 445 | 30 | 272.2 | 445 | Phoenix | 445 | 32.0 | 0.07 | 2.1 | 148 | ||
| 13(11) | 490 | 40 | 25.3 | 483 | NGC 6822 | 483 | 86.4 | 0.18 | 3.5 | 161 | ||
| 14(12) | 690 | 100 | 196.9 | 695 | Leo A | 695 | 100 | 0.14 | 3.5 | 232 | ||
| 15(13) | 880 | 40 | 322.9 | 875 | Tucana | 875 | 123 | 0.14 | 3.5 | 292 | ||
| 16(14) | 955 | 50 | 94.8 | 956 | Pegasus | 956 | 159 | 0.17 | 3.3 | 319 |
The data are compared with an isotropic power-law density distribution, , where . Using the Kolmogorov-Smirnov (KS) test it can be shown that the cumulative dwarf sample is consistent with a radial near-isothermal density distribution, the 5 per cent confidence margin being for the innermost dwarves. The solutions shift to larger as further outlying dwarves are added. This is a similar behaviour as seen in theoretical distributions of sub-haloes (e.g. fig. 5 in Zentner & Bullock zentner03 (2003)).
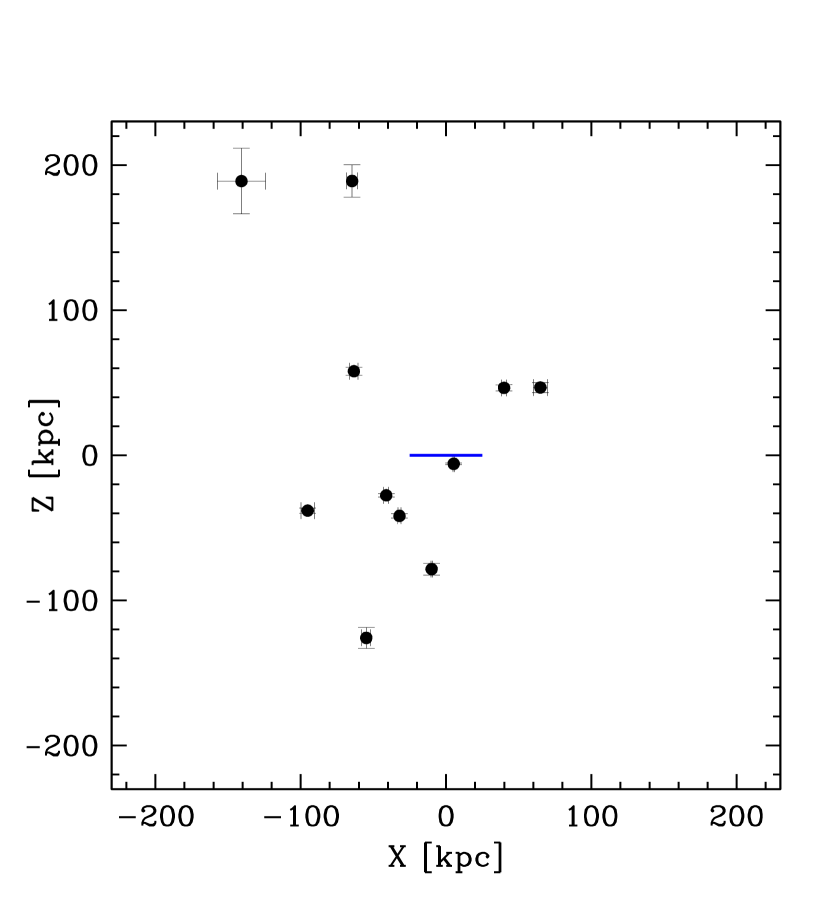
The data are plotted in Fig. 1 after clockwise rotation by an angle about the Z-axis, and likewise for the uncertainties. The distribution is highly anisotropic and planar in form. It is the aim of this contribution to quantify the significance of this anisotropy. A rotation of Fig. 1 by shows the distribution to be approximately disk-like (Fig. 2).
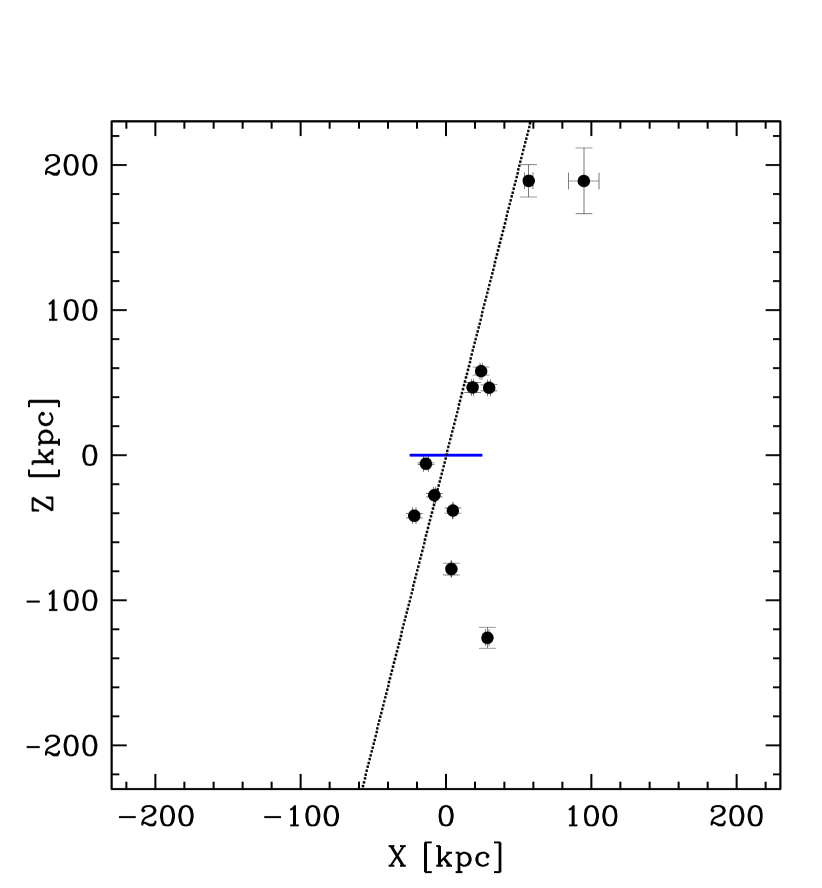
3 The satellite plane
A plane can be described by the Hesse form, , where is the normal vector, a vector pointing from the origin (the centre of the MW) to a point in the plane, and an arbitrary vector from the origin to the plane. With and being the coordinates of the galaxies, , becomes identical to Hesse form if ; being the distance of the th dwarf to the plane. is the shortest distance of the plane to the origin. The problem of finding the plane can thus be reduced to a least-squares linear regression problem, where the aim is to find the coefficients, with the condition , that minimise . To achieve this the method of normal equations using Gauss-Jordan elimination is employed to solve the set of linear equations (Press et al. press92 (1992)). For each fitted plane the root-mean square height of the resulting disk distribution is calculated, . Note that the applied minimisation does not include the location of the Galactic centre as a constraint. Thus, in principle the fitted plane to a small number of dwarves () could lie far away from the Galactic centre. The weights that do enter the regression are merely given by the uncertainties in distance. The direction of the normal vector, or the location of the pole of the plane, , follows from . As no kinematical information is included the direction of the pole is ambiguous, , or .
Table 1 lists some results of the fitted plane for a decreasing number of dwarves. The empirical disk height, , is always much smaller than the theoretical height, , for an isothermal and isotropic model number density distribution centred on the origin of the MW. The MW dwarves thus appear to be distributed as a great disk with a ratio of height to radius .
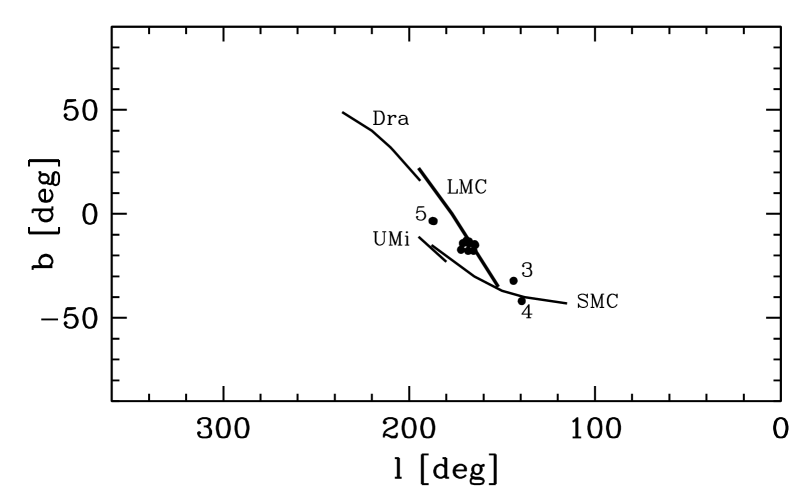
The poles of the planes and the orbital poles of the dwarves LMC, SMC, Draco and UMi agree remarkably well (Fig. 3). This is surprising because the results are obtained using completely different methods. The position of the poles of the planes found here depend only on the spatial distribution of the dwarves. In contrast, an orbital pole is the direction of the orbital angular momentum and relies on the direction of the measured proper motion of the respective object. Sgr is on a polar orbit but has a kinematical pole (, Palma, Majewski & Johnston palma02 (2002)) lying approximately at a right angle to the great disk and to the MW disk. On the basis of the weakly bound core of Sgr which makes it difficult for Sgr to survive the many orbits implied by its current angular momentum, Zhao (zhao98 (1998)) proposed that it may have been scattered into its present low-pericenter orbit by an encounter with the LMC/SMC about 2–3 Gyr ago. Sgr contributes the most deviant cos value in the sample because it is closest to the MW centre and thus high above the local great disk. Taking Sgr out of the sample would increase the discrepancy, quantified in § 4, between the dwarf sample and the hypothesis that they are the visible cosmological sub-halo population.
4 The likelihood
The null hypothesis is that the observed dwarves are drawn from a cosmological population. We therefore need to establish the probability that the observed distribution is drawn from a spherical parent distribution.
The vector pointing from the Galactic centre to the closest point, Pcl, on the plane is , and the vector from this point Pcl to a dwarf is . The angle, , between the normal vector and the dwarf as viewed from Pcl is then given by . The cumulative distribution of cos about the fitted plane is calculated for the observed sample using the innermost dwarves, and also for model dwarves distributed according to the theoretical parent radial power-law distribution which is centred on and isotropic about the Galactic centre. The KS test quantifies the confidence that can be placed in the hypothesis that the observed sample stems from this parent distribution. The results, plotted in Fig. 4, show that this hypothesis can be rejected with a confidence of better than 98 per cent, and even 99.6 per cent for . This comes about because the real sample is deficient near the poles of the great disk.

Orbital pole analyses have been showing that the SMC, UMi and the LMC form a kinematical family (Palma et al. 2002). Taking these two objects out of the sample, kinematically-linked dwarves are removed with the expectation that the remaining dwarves should be more consistent with the isotropic parent distribution. As the thin curves in Fig. 4 show this is not the case. Instead, the probabilities that the sample without the SMC and UMi stems from an isotropic parent distribution is reduced (as compared to the sample). This comes about because the two dwarves are relatively close to the Galactic centre thus adding relatively large angles when they are included.
The disk-like distribution of the dwarves lying nearby to the MW noted in Fig. 1 is therefore highly significant. The local dwarves do not stem from an isotropic distribution. Their distribution is therefore severely at odds with the sphericity of the MW dark matter halo, and even more at odds with an oblate halo having the same orientation as the MW disk.
5 Concluding remarks
Cosmological models can be tested among other ways by comparing the theoretical sub-structure distribution with observed satellite distributions. The theoretical distribution contains about 500 sub-haloes within approximately 500 kpc of a MW-type galaxy and follows an approximately power-law radial distribution with and is essentially isotropic. The well-known MW distribution contains only a dozen dwarves, is indeed consistent with the theoretical radial distribution but is highly anisotropic. The anisotropy is such that the MW dwarves form a disk-like structure with a root-mean-square height of kpc which lies nearly perpendicularly to the plane of the MW. The pole of this great disk lies close to the orbital poles of the LMC, the SMC, Draco and Ursa Minor. The distance of closest approach of the plane to the Galactic centre, kpc, is much smaller than the radial extent of the Galactic disk ( kpc) or even the root-mean square height, , of the disk of satellites (). This is a strong indication that the sample of dwarves within about 250 kpc is relaxed in the Galactic potential. Their orbits must be confined within the great disk because the likelihood of obtaining such a disk-like dwarf distribution given a true underlying isotropic distribution (that ought to match the sphericity of the MW DM halo) is less than 0.5 per cent. This result persists even after removing the kinematically related SMC and UMi from the analysis. A distribution of polar orbits with arbitrary eccentricities and orientation of orbital planes is also excluded with the same confidence because it leads to an isotropic distribution of dwarves. An oblate MW dark matter halo would yield an even larger discrepancy with the disk of satellites.
An alternative approach is taken by Hartwick (2000) who argues that the 10 satellites within 400 kpc (the LMC and SMC are combined to one satellite) map the MW DM halo shape and form a highly inclined and highly prolate system with minor/major axis ratio . However, the extreme triaxiality derived in this way is completely inconsistent with the observational and theoretical shapes of CDM host-haloes and sub-structure distributions (§ 1).
The approach taken here differs by noting the very significant mismatch between (i) the disk-like satellite distribution, (ii) the independent empirical constraints on the shape of the MW dark matter halo, and (iii) the theoretical shapes of CDM host haloes (§ 1). In the view presented here, the mismatch between the number and spatial distribution of MW dwarves compared to the theoretical distribution challenges the claim that the MW dwarves are cosmological sub-structures that ought to populate the MW halo.
A more natural and more conservative (by not resorting to exotic physics) explanation for the MW dwarf distribution in a great disk with a ratio of height to radius of 0.1–0.2 would appear to be in terms of a causal connection between most of them. This could be the case if most of the dwarves stem from one initial gas-rich parent satellite on an eccentric near-polar orbit that interacted with the young MW, perhaps a number of times, forming tidal arms semi-periodically as its orbit shrank. The early gas-rich tidal arms may have condensed in regions to tidal dwarf galaxies, as is observed in present-day interacting gas-rich galaxies (e.g. Knierman et al. 2003; Weilbacher, Duc & Fritze-v. Alvensleben 2003). The LMC may be the most massive remnant of this larger satellite, while the lesser dwarves may be its old children (Lynden-Bell lyndenbell76 (1976)). The Magellanic Stream may be just such a newly formed but meagre tidal feature (Kunkel kunkel79 (1979)), and the alignment of the disk of satellites with the surrounding matter distribution (Hartwick 2000) may simply result from the gas-rich parent satellite coming-in from that direction. The different chemical enrichment and star-formation histories of the various dwarves (e.g. Ikuta & Arimoto ikuta02 (2002); Grebel et al. grebel03 (2003)) may in this case be a result of their different initial masses that will have been significantly larger than their present-day baryonic masses (Kroupa kroupa97 (1997)) and the complex interplay between stellar evolution, tides, gaseous stripping and gas accretion during the orbits within the MW halo, none of which are presently understood in much detail. The simulations of Kroupa have shown that ancient tidal-dwarf galaxies may appear similar to some of the observed dSph satellites.
The sub-structure under-abundance problem extends to fossil galaxy groups where early photo-evaporation could not have removed baryons from the sub-structures (D’Onghia & Lake 2004), and a sub-structure-overabundance is evident for rich clusters (Diemand et al. 2004). CDM cosmology thus faces a sub-structure challenge on all mass scales.
References
- (1) Aubert D., Pichon C., Colombi S., 2004, MNRAS, 352, 376
- Bullock (2002) Bullock, J. S. 2002, The shapes of galaxies and their dark haloes, Proceedings of the Yale Cosmology Workshop ”The Shapes of Galaxies and Their Dark Matter Haloes”, New Haven, Connecticut, USA, 28-30 May 2001. Edited by Priyamvada Natarajan. Singapore: World Scientific, 2002, ISBN 9810248482, p.109, 109
- Bullock, Kravtsov, & Weinberg (2000) Bullock, J. S., Kravtsov, A. V., & Weinberg, D. H. 2000, ApJ, 539, 517
- Combes (2002) Combes, F. 2002, New Astronomy Review, 46, 755 (also astro-ph/0206126)
- (5) Clementini G., Gratton R., Bragaglia A., Carretta E., Di Fabrizio L., Maio M., 2003, AJ, 125, 1309
- Diemand, Moore, & Stadel (2004) Diemand, J., Moore, B., & Stadel, J. 2004, MNRAS, 152, in press
- (7) Dolphin A.E., Walker A.R., Hodge P.W., Mateo M., Olszewski E.W., Schommer R.A., Suntzeff N.B., 2001, ApJ, 562, 303
- Dubinski (1994) Dubinski, J. 1994, ApJ, 431, 617
- (9) Ghigna S., Moore B., Governato F., Lake G., Quinn T., Stadel J., 1998, MNRAS, 300, 146
- Governato et al. (2004) Governato F., Mayer L., Wadsley J., Gardner J. P., Willman B., Hayashi E., Quinn T., Stadel J., Lake G. 2004, ApJ, 607, 688
- (11) Grebel E.K., Gallagher J.S., Harbeck D., 2003, AJ, 125, 1926
- (12) Hayashi E., Navarro J.F., Taylor J.E., Stadel J., Quinn T., 2003, ApJ, 584, 541
- (13) Ibata R., Lewis G.F., Irwin M., Totten E., Quinn T., 2001, ApJ, 551, 294
- (14) Ikuta C., Arimoto N., 2002, A&A, 391, 55
- Kazantzidis et al. (2004) Kazantzidis, S., Mayer, L., Mastropietro, C., Diemand, J., Stadel, J., & Moore, B. 2004, ApJ, 608, 663
- (16) Klypin A., Kravtsov A.V., Valenzuela O., Prada F., 1999, ApJ, 522, 82
- Knierman et al. (2003) Knierman K.A., Gallagher S.C., Charlton J.C., Hunsberger S.D., Whitmore B., Kundu A., Hibbard J.E., Zaritsky D., 2003, AJ, 126, 1227
- (18) Kravtsov A.V., Gnedin O.Y., Klypin A.A., 2004, ApJ, 609, 482
- (19) Kroupa P., 1997, New Astronomy, 2, 139
- (20) Kunkel W.F., 1979, ApJ, 228, 718
- (21) Lynden-Bell D., 1976, MNRAS, 174, 695
- (22) Majewski S.R., Skrutskie M.F., Weinberg M.D., Ostheimer J.C., 2003, ApJ, 599, 1082
- Martínez-Delgado, Gómez-Flechoso, Aparicio, & Carrera (2004) Martínez-Delgado, D., Gómez-Flechoso, M. Á., Aparicio, A., & Carrera, R. 2004, ApJ, 601, 242
- (24) Mateo M., 1998, ARA&A, 36, 435
- Merrifield (2002) Merrifield, M. R. 2002, The shapes of galaxies and their dark haloes, Proceedings of the Yale Cosmology Workshop ”The Shapes of Galaxies and Their Dark Matter Haloes”, New Haven, Connecticut, USA, 28-30 May 2001. Edited by Priyamvada Natarajan. Singapore: World Scientific, 2002, ISBN 9810248482, p.170, 170 (also astro-ph/0107291)
- (26) Moore B., Ghigna S., Governato F., Lake G., Quinn T., Stadel J., Tozzi P., 1999, ApJL, 524, L19
- (27) Olling R.P., Merrifield M.R., 2000, MNRAS, 311, 361
- (28) Olling R.P., Merrifield M.R., 2001, MNRAS, 326, 164
- (29) D’Onghia E., Lake G., 2004, ApJ, 612, 628
- (30) Palma C., Majewski S.R., Johnston K., 2002, ApJ, 564, 736
- (31) Press W.H., Teukolsky S.A., Vetterling W.T., Flannery B.P., 1992, Numerical Recipes, Cambridge University Press, Cambridge
- (32) Salaris M., Percival S., Brocato E., Raimondo G., Walker A.R., 2003, ApJ, 588, 801
- Sales & Lambas (2004) Sales, L. & Lambas, D. G. 2004, MNRAS, 348, 1236
- (34) Stoehr F., White S.D.M., Tormen G., Springel V., 2002, MNRAS, 335, L84
- Susa & Umemura (2004) Susa, H. & Umemura, M. 2004, ApJ, 600, 1
- Weilbacher, Duc, & Fritze-v. Alvensleben (2003) Weilbacher P.M., Duc P.-A., Fritze-v. Alvensleben U., 2003, A&A, 397, 545
- Zaritsky & Gonzalez (1999) Zaritsky, D. & Gonzalez, A. H. 1999, PASP, 111, 1508
- (38) Zentner A.R., Bullock J.S., 2003, ApJ, 598, 49
- (39) Zhao H., 1998, ApJL, 500, L149