Discovery of a New Low-Latitude Milky Way Globular Cluster using GLIMPSE
Abstract
Spitzer Space Telescope imaging from the Galactic Legacy Infrared Mid-Plane Survey Extraordinaire (GLIMPSE) reveals a previously unidentified low-latitude rich star cluster near =31.3∘, =-0.1. Near-infrared JHK’ photometry from the Wyoming Infrared Observatory indicates an extinction of mag for cluster members. Analysis of features along the same sightline suggests a probable kinematic distance of 3.1 – 5.2 kpc. The new cluster has an angular diameter of pc, a total magnitude corrected for extinction of , and a luminosity of at 3.1 kpc. In contrast to young massive Galactic clusters with ages 100 Myr, the new cluster has no significant radio emission. Comparison to theoretical K-band luminosity functions indicates an age of at least several Gyr and a mass of at least . Unlike known old open clusters, this new cluster lies in the inner Galaxy at kpc. We designate this object “GLIMPSE-C01” and present evidence that it is a Milky Way globular cluster passing through the Galactic disk. We also identify a region of star formation and fan-shaped outflows from young stellar objects in the same field as the cluster. The cluster’s passage through the Galactic molecular layer may have triggered this star formation activity.
1 Introduction
Infrared surveys of the Galactic Plane, such as 2MASS, have led to the discovery of several hundred new star clusters throughout the Milky Way disk (e.g., Borissova et al. 2003; Bica et al. 2003; Dutra et al. 2003; Hurt et al. 2000). Typically, clusters are identified by locating peaks in the surface density of stars using point source catalogs. The majority of these clusters were previously undetectable in optical surveys due to high extinction at low latitudes. Near-infrared cluster searches, however, are still incomplete in regions of highest extinction where may reach several magnitudes.
The Galactic Legacy Mid-Plane Survey Extraordinaire (GLIMPSE) is mapping the Galactic Plane in four infrared array camera (IRAC; Fazio et al. 2004) bands at 3.6 m, 4.5 m, 5.8 m, and 8.0 m from and (Benjamin et al. 2003). One of the primary science drivers for the survey is to enable a complete census of star formation regions and stellar populations throughout the inner Galaxy, unhindered by extinction, at the same arcsecond angular resolutions as optical and near-IR surveys. The survey will also enable discovery of previously uncatalogued stellar objects on the far side of the Galaxy or in highly obscured regions.
In this paper we report the serendipitous discovery of a rich star cluster in the first Galactic quadrant near , . The cluster may be a new member of the collection of (Harris 1996) Milky Way globular clusters. We will refer to this object as GLIMPSE-C01.
2 Data
2.1 GLIMPSE Imaging and Photometry
The segment of the the Galactic Plane from ∘ to ∘ was observed by Spitzer with the IRAC camera on 2004 April 21 as part of the GLIMPSE program. The total exposure time at each IRAC band is 2.4 seconds and the instrumental resolution ranges from 1.6′′ FWHM at 3.6 m to 1.9′′ FWHM at 8.0 m. Mosaiced images of the 5′5′ IRAC frames were constructed by the GLIMPSE team using MONTAGE.111Montage software is funded by the National Aeronautics and Space Administration’s Earth Science Technology Office. A member of the GLIMPSE team (A. J. M.) identified the cluster during visual examination of the images. The only previous identification of this object was by Simpson & Cotera (2004) using 2MASS near-infrared images to follow up on ASCA X-ray detections in the Galactic Plane. Inspection of initial 4.5 m mosaiced images over the regions ∘and ∘shows that no other similarly rich bright clusters are found in the 92 square degrees of the Plane surveyed to date. The center of GLIMPSE-C01 is at ∘, ∘or RA(J2000)=18h48m49.7s, DEC(J2000) = -01d29m50s. For further details on GLIMPSE imaging and photometry see Mercer et al. (2004), Churchwell et al. (2004), Whitney et al. (2004), or Indebetouw et al. (2004).
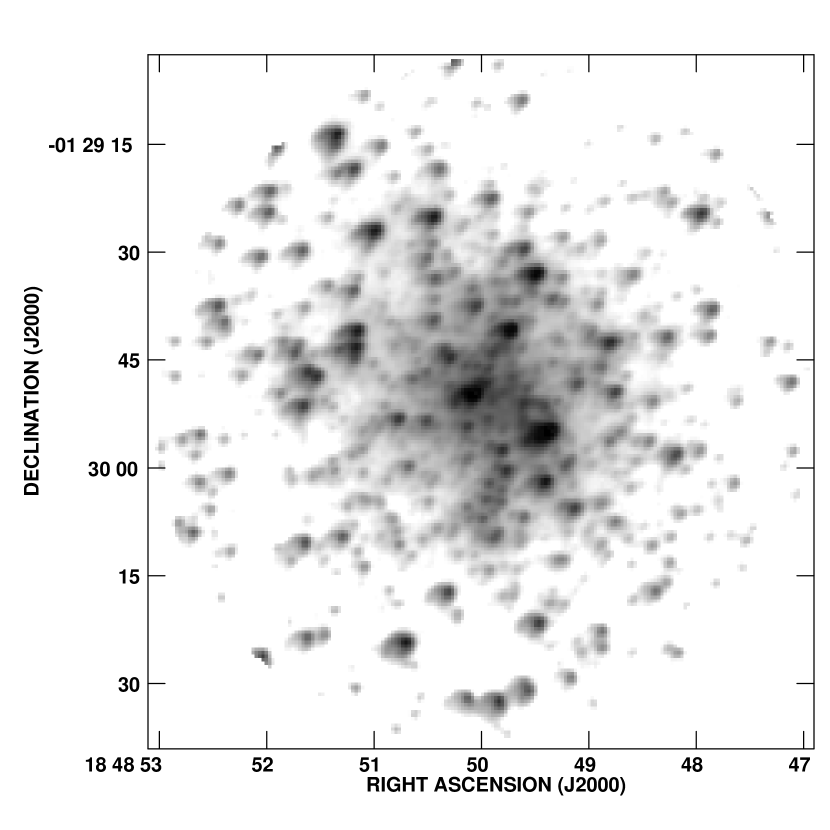
Figure 1 shows logarithmic greyscale representations of images in each of the 4 IRAC bands. The IRAC1 and IRAC2 bands (upper panels) are dominated by stellar photospheric emission from normal main sequence stars. The cluster is the most prominent feature in the field. It subtends over 2 arcminutes on the sky and is dominated by 3 bright pointlike sources which we show later are multiple blended stars. We note that the brightest probable members are located near the cluster center, suggesting an age old enough for significant dynamical evolution to have occurred. Stars become less prominent in IRAC bands 3 & 4 which are increasingly dominated by emission from known polycyclic aromatic hydrocarbon (PAH) bands. The lower panels of Figure 1 reveal a bright swath (hereafter the “plume”) of diffuse emission extending ′ toward the Galactic south and toward higher longitudes. These panels also show a region (hereafter the “ribbon”) of lower surface brightness diffuse emission running several arcminutes from the cluster toward the Galactic north and toward lower longitudes.
Figure 2 is a 3-color image of GLIMPSE-C01 and the surrounding field constructed from the IRAC1 3.6 m image (blue), the IRAC3 5.8 m image (green) and the IRAC4 8.0 m (red). Contours indicate the 1420 GHz radio continuum emission in the NRAO VLA Sky Survey (Condon et al. 1998) archival image with contours at 2, 3, 4, 5, and 10 times the RMS noise of 1.3 mJy/beam. The cluster is coincident with a radio detection at a level of 4.5 mJy per 45′′ synthesized beam. Reduction of VLA B-configuration 1400 MHz archival data from program code AC629 (10′′ synthesized beam) shows no point source at this location to a limit of 1.3 mJy, indicating that this radio emission in the NVSS is probably diffuse on scales larger than 10′′. Several stronger (presumably unrelated) radio sources are visible to the Galactic S and toward lower longitudes from the cluster.
We note in Figure 2 the presence of several Y-shaped features 2′ south (Galactic) of the cluster. These objects appear similar to outflow cones from young stellar objects, and probably indicate a region of star formation. In Section 2.5 below we show that this region is coincident with a peak in the surface brightness at a velocity of 46 km s-1, suggesting a kinematic distance of 3.1 kpc. It is not clear whether this star formation region is affiliated with the cluster or is a foreground or background object.
2.2 WIRO Near-IR Imaging
Near-infrared imaging of the GLIMPSE-C01 was obtained 2004 July 31 using the 2562 InSb Goddard Infrared Camera (GIRcam) on the 2.3 m Wyoming Infrared Observatory (WIRO) telescope. GIRcam has a pixel scale of 0.46′′ pixel-1 at the Cassegrain focus. Seeing was 1.1-1.2′′. Images were obtained in the J, H, and K’ filters with total exposure times of 120 s, 200 s, and 320 s respectively, broken into multiple “dithered” exposures. Background images were obtained every 60 s on adjacent regions of sky. Data reduction followed standard procedures. Sky background exposures before and after each sequence were averaged and subtracted from each on-source image. Flat field images in each filter were constructed from a median of at least 20 on-sky exposures obtained throughout the night. Cluster frames were registered and combined to produce final images. Conditions were photometric, and 3 standard stars from the list of Hawarden et al. (2003) covering a range of J-K color were observed for flux calibration. A collimation problem with the secondary mirror produced stellar images with a narrow core (FWHM of 2.5 pixels or 1.15′′) but broad, asymmetric wings. Eighty three percent of the power from a point source is contained in the core within a 4 pixel radius. DAOphot PSF fitting photometry was performed on the images to obtain JHK’ photometry down to limiting magnitudes of 17.2, 15.5, and 14.5 in the J,H,K’ bands, respectively. In each filter 4-5 isolated stars were chosen to create a PSF profile that was applied to the final images. Three deconvolution iterations were performed on the cluster to obtain magnitudes for 313 stars. The photometry is complete to a K-band magnitude of 12.5. We transformed the JHK’ magnitudes from the UKIRT photometric system to the 2MASS system using the relations of Carpenter (2001).
Figure 3 shows a WIRO H-band image of the cluster. Although the cluster is readily visible in 2MASS J,H,K’ images, it has not been previously identified in the literature. The WIRO data analysed here have superior sensitivity and angular resolution than the 2MASS archival images.
2.3 Integrated Luminosity
We measured the cluster’s total flux by performing aperture photometry on the 2MASS JHK’ images and our Spitzer IRAC 1-4 images using a 90′′ radius aperture and an annular background region from 90′′ to 110′′ from the cluster. Table 1 lists the integrated magnitudes and fluxes at each band. Note that the flux in IRAC bands 3 & 4 contains a considerable contribution from diffuse PAH emission (seen in Figure 1) which is not present at other wavelengths.
2.4 Far Infrared IRAS
An examination of archival images from the IRAS mission shows the new cluster to be located near the periphery of an extended region of diffuse far-infrared emission. There is an IRAS source, IRAS 18462-0133, located within 20′′ of the cluster’s position. The IRAS flux densities ranging from 16 Jy at 12 m to 1500 Jy at 100 m appear in Table 1, though they are highly uncertain due to the large beamsize in the high-background Galactic Plane.
2.5 Molecular Gas
Millimeter-wave spectra from the (1-0) Galactic Ring Survey (GRS–Simon et al. 2001; 46′′ beamsize) reveal strong emission at velocities near 46 km s-1, 81 km s-1, and 100 km s-1. Figure 4 shows the spectrum toward the cluster. The morphology of the molecular feature near 46 km s-1 is similar to that seen in the 8.0 m PAH emission. Figure 5 shows the IRAC 3.6 m (blue), 5.8 m (green), and 8.0 m (red) images with the zeroth moment GRS map from 38 to 50 km s-1 in contours. Contour levels denote 3.0, 3.5, 4.0, 4.5, 5.0, 5.5, 6.5, 7.0, and 7.5 K km s-1. Assuming a ratio of 40 (Langer & Penzias 1990) and using (Maloney & Black 1988; Richardson & Wolfendale 1988), these contours correspond to molecular hydrogen columns of 2.5 — 6.0 cm-2. The corresponding extinction associated with this molecular column density is — for the molecular component.222Here we assume (Bohlin, Savage, & Drake 1978). We convert the 13CO column density to 12CO column density assuming a ratio 12CO/13CO=40 and then use . Note the CO peak which coincides with the diffuse IR clump 90′′ directly south (in Galactic coordinates) of the cluster. This morphological correspondence is one of the features which demonstrates that the molecular emission is likely to be affiliated with the mid-IR PAH emission.
3 Analysis of the Cluster’s Nature
3.1 Extinction
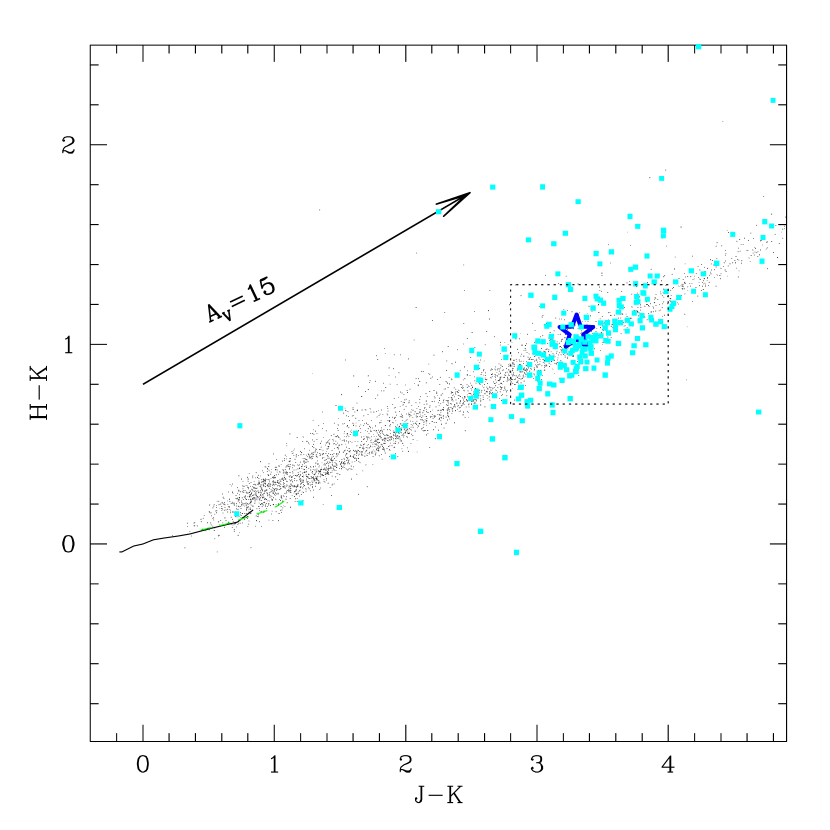
Figure 6 shows a J-H versus H-K color-color diagram of stars within 45′′ of the cluster center. Lines indicate the loci of the main sequence and giant branches for . Dots are field stars from the 2MASS point source catalog within an annulus between 1′ and 9′ from the cluster. Large symbols are the 225 stars within 45′′ of the cluster measured in our WIRO JHK’ photometry with photometric uncertainties 0.1 mag in all three bandpasses. The large star designates the integrated photometry of the cluster. An arrow shows the reddening vector for which is equivalent to using the extinction prescription of Cardelli, Clayton, & Mathis (1989). The dotted box denotes the region occupied by probable cluster members with similar colors.
Figure 6 shows that the vast majority of cluster stars are consistent with 12-18 magnitudes of visual extinction, similar to that estimated from the CO column density in the 46 km s-1 feature. By comparison, field stars (dots) range from to . The range of reddening among probable cluster members suggests patchy, variable extinction. We examined a reddening map of cluster stars and find no large-scale extinction gradient across the face of the cluster. Given the presence of dust emission features in the 8.0 m image near the cluster, it is possible that dust mixed within the cluster produces the variation in extinction among members.
3.2 Distance to the Cluster
If the stellar cluster is located at the same distance as the mid-IR PAH emission, then the correspondence with the CO indicates a kinematic distance of either 3.1 kpc or 11.5 kpc (Clemens 1985). However, even if the stellar cluster is not physically affiliated with the PAH emission, we can still constrain distance to the cluster using the observed extinction ( mag) and the kinematic distances of the features. Given that the observed extinction is similar to that implied by the column density in the 46 km s-1 feature alone, the cluster must be at least 3.1 kpc away. If the cluster were more distant than the 81 km s-1 or 100 km s-1 features, then the integrated column densities would produce extinctions of mag, in contradiction to the observed mag. Thus, the cluster is on the near side of the clouds producing the 81 km s-1 and 100 km s-1 emission. The kinematic distances of these features are 5.2/9.3 kpc, and 7.3 kpc (at the tangent point), respectively. Therefore, the cluster must be closer than 7.3 kpc and may be closer than 5.2 kpc if the 81 km s-1 feature is located at the near distance. The total extinction along this sight-line estimated from COBE FIR maps is mag corresponding to (Schlegel et al. 1998). This is somewhat lower than the reddening estimate based on the intensity of K km s-1 integrated over the entire Galactic velocity range. In either case, the extinction estimated from Figure 6 of is significantly lower than these maximum values, suggesting that GLIMPSE-C01 is unlikely to be located on the far side of the Galaxy and most likely lies in the range 3.1—5.2 kpc.
3.3 Color Magnitude Diagram and K-band Luminosity Function
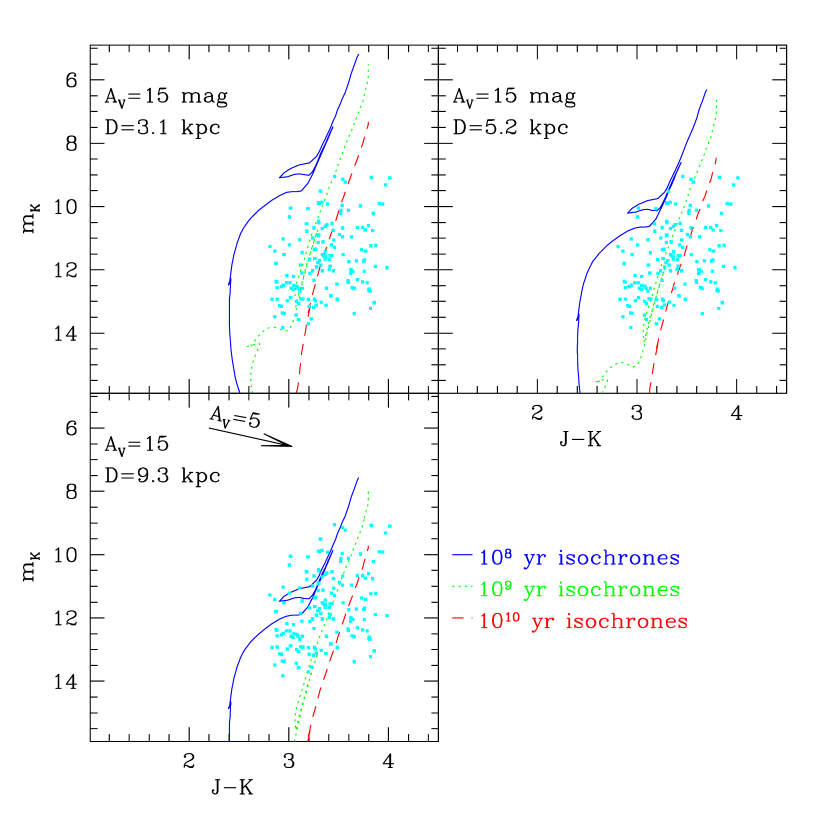
Figure 7 shows a K versus J-K color-magnitude diagram of cluster stars. Lines illustrate the solar metallicity isochrones of Bonatto, Bica, & Girardi (2004) for ages of yr (solid), yr (dotted), and yr (dashed). All isochrones have been reddened by the equivalent of . Points are the stars within 45′′of the cluster which are probable cluster members based on color selection criteria (those contained within the dotted box in Figure 6.) The upper left, upper right, and lower left panels show the theoretical isochrones at distances suggested by the kinematics of features: 3.1 kpc, 5.2 kpc, and 9.3 kpc. At the two lower distances, the tip of the yr isochrone lies well above the magnitudes of the brightest cluster members and the mean color is not well matched to the data. Both the yr or yr isochrones provide reasonable fits to the colors and magnitudes of cluster stars at 3.1 and 5.2 kpc distances. For this most probable distance of 3.1 kpc, the data are consistent with an old cluster in excess of 1 Gyr. For the less probable distance of 5.2 kpc in the upper right panel of Figure 7, the yr or yr isochrones are still in reasonable agreement with the data while the yr isochrone is still a poor fit. For the maximum possible distance of 9.3 kpc (lower left panel) permitted by kinematic arguments, the tip of the yr isochrone lies below the brightest cluster members, while the yr and yr isochrones are now a reasonable fit both in color and K-band magnitude. Given the dispersion in color among cluster members, the strongest conclusion we can draw from Figure 7 is that either a nearby (3.1 kpc) old cluster or a more distant young cluster may be consistent with the data.
Figure 8 provides stronger constraints on the cluster age by showing the K-band luminosity function of the cluster (thick line) compared to expectations from the Bonatto et al. (2004) isochrones for a cluster mass of , a distance of 3.1 kpc, and three different ages. The K-band data have been corrected for 1.7 mag of extinction (). The top panel shows luminosity functions for (approximately solar metallicity) clusters with ages of , , and years. The lower panel shows luminosity functions for (approximately 1/20 solar metallicity) clusters with ages of , , and years. The histogram of the GLIMPSE-C01 luminosity function has been truncated at K=12.3 () where the cluster photometry becomes incomplete. Figure 8 shows that clusters of any metallicity with ages Gyr are inconsistent with the observed luminosity function due to the lack of supergiants with luminosities in GLIMPSE-C01. The best agreement between the models and data are for clusters with ages Gyr and masses from to , with the larger ages requiring larger masses. Figure 8 shows that a model with mass and age yrs (lower panel, dashed line) provides an excellent fit to the observed luminosity function. Such masses and ages are consistent with the canonical properties of globular clusters or extraordinarily old, massive, open clusters.
3.4 Luminosity
Using the measured total fluxes in Table 1 along with the reddening of mag and distance estimates derived above, we estimate a total K-band luminosity for the cluster at the near 3.1 kpc distance. The corresponding V-band luminosity is , assuming V-K=1.9 appropriate for a yr or yr population (Leitherer et al. 1999). GLIMPSE-C01 is, therefore, much more luminous than Galactic open clusters (e.g., NGC 6791) and approaches the luminosity of the most most massive globular clusters (Harris 1996). Adopting a greater distance would make GLIMPSE-C01 even more spectacular. At the maximal distance of 9.3 kpc, it would have and (assuming V-K=1.9), making it more luminous than any known globular cluster. Such luminosities are typical of young (3-10 Myr) “super star clusters” found in nearby starburst galaxies (reviewed by Whitmore 2000), but would be extraordinary for a globular cluster.
3.5 Cluster Properties
Figure 9 illustrates how the derived physical properties of GLIMPSE-SC01 scale with distance. The shaded region highlights the most probable distance. The upper two panels show that the inferred K-band and V-band luminosities are and for distances near 3.1 kpc. For the larger but less probable distances, these luminosities would be correspondingly larger. Here, the V-band luminosities have been derived from the measured K-band luminosities using the theoretical colors, V-K=1.9, for a instantaneous burst stellar population with age — yrs (Leitherer et al. 1999). The mass of the cluster in the third panel is inferred from the theoretical mass to light ratio (tabulated by Bonatto, Bica & Girardi 2004) for three different representative ages of , , and yrs. In any case, the mass of the cluster exceeds for all reasonable distances and surpasses if the age is very old or the distance is large. The conservative mass estimate of is similar to Galactic globular clusters and young super star clusters with measured dynamical masses in nearby starbursts (e.g., NGC 1569–Ho & Filippenko 1996). The lower panel of Figure 9 indicates that the half light diameter of the cluster falls in the range 1-2 pc. This is smaller than most globular clusters which have half light diameters of 3-6 pc (Harris 1996). It is possible that the passage of GLIMPSE-C01 through the Galactic disk, or a prolonged presence near the disk, has stripped some fraction of the outer, loosely bound cluster members and left only the tightly bound cluster core.
4 Discussion of Why GLIMPSE-C01 is Likely to be a Globular Cluster
Several lines of evidence favor identifying GLIMPSE-C01 as a member of the classical Milky Way globular cluster system rather than a young stellar cluster or even an evolved old open cluster.
-
•
Lack of Radio Emission: Prominent Galactic star formation regions are luminous thermal radio and infrared sources with fluxes of many tens or even hundreds of Janskys (e.g., Westerlund 2/RCW49– Churchwell et al. 2004). A modest star forming region like Orion has an integrated 1420 GHz flux of 420 Jy at a distance of 450 pc (Felli et al. 1993). Orion would have a radio continuum flux of 9.4 Jy at 3.1 kpc, the adopted distance of GLIMPSE-C01, or a flux of 225 mJy if it were on the far rim of the Galaxy. The new cluster, by comparison, is a marginal detection at 5 mJy in the radio continuum, indicating that no massive stars are present. The lack of radio synchrotron sources or diffuse infrared shells suggests that we can rule out recent supernova remnants.
-
•
A well-populated giant branch: Given the infrared photometry presented in Figure 6 and the K-band luminosity function in Figure 8, the cluster contains a wealth of giant stars but a lack of luminous supergiants, consistent with the evolved nature of a globular cluster. Preliminary K-band spectroscopy of GLIMPSE-C01 shows no emission lines which should be present in a very young OB type cluster (D. Clemens, in preparation).
-
•
Overall luminosity: With an absolute V magnitude estimated at , the cluster is more luminous than the majority of known globular clusters (Harris 1996) and vastly more luminous and massive than known old open clusters even at the conservative distance of 3.1 kpc.
-
•
Stellar density: GLIMPSE-C01 is a rich, centrally condensed cluster with evidence for mass segregation characteristic of dynamically relaxed systems. Figure 10 shows the 3.6 m surface brightness as a function of radius, normalized to the central surface brightness. At large radii the surface brightness becomes very uncertain due to contamination by field stars. Open clusters, in general, do not survive long enough to become dynamically relaxed. Figure 11 compares the IRAC 4.5 m image of GLIMPSE-C01 (left) with the 2MASS K-band image of the old open cluster NGC 6791 (right) which lies at a similar distance (4 kpc). NGC6791 is Gyr old (Demarque, Guenther, & Green 1992) but not as rich or centrally condensed as the new cluster, even though it is at a similar distance (4.0 kpc).
-
•
Position in the Galaxy: At 6.1 kpc from the Galactic center, GLIMPSE-C01 is interior to known old (1 Gyr) open clusters which are only found at kpc (Friel 1995). Survival over Gyr timescales requires that a weakly bound old open cluster be protected from disruption by the gravitational forces of giant molecular clouds and stellar encounters which are more prevalent inside the solar circle. Globular clusters, on the other hand, are preferentially found toward the Galactic bulge.
Given the evidence, it appears likely that GLIMPSE-C01 is a massive globular cluster making a passage through the Galactic disk. The morphology of the cluster and surrounding ISM, if physically associated with the cluster, may provide some clues regarding its trajectory.
The outer isophotes of GLIMPSE-C01 are significantly elliptical, having at 72′′ from the nucleus. Figure 12 shows the IRAC 3.6 m image with a series of best fit ellipses having semi-major axes of 12, 24, 36, 48, 60, and 72 arcseconds. The ellipticity of the outer ellipses shows that the major axis of the cluster lies along position angle 124∘ in Galactic coordinates or 61∘ in J2000 equatorial coordinates.
The bright “plume” of PAH emission seen in Figure 2 lies at the same position angle as the major axis of the cluster’s outer isophotes, suggesting a preferred orientation at a position angle of ∘ from Galactic north (PA=61∘ in equatorial coordinates). One end of the plume is centered on the cluster and the other end extends 1.5′ to the Galactic south of the cluster and toward higher longitudes. One possibility is that the plume traces intracluster or circumstellar debris from the GLIMPSE-C01 which has been stripped by the Galactic ISM as the cluster moves from south to north across the the Plane. An alternative scenario is that the diffuse “ribbon” of emission extending to the Galactic north and toward lower longitudes traces the recent trajectory of the cluster and that the plume is caused by recent star formation as the cluster impacts the Galactic molecular layer on its journey to the south. The possibility remains, of course, that the diffuse IR emission lies in the foreground or background and is not affiliated with the cluster.
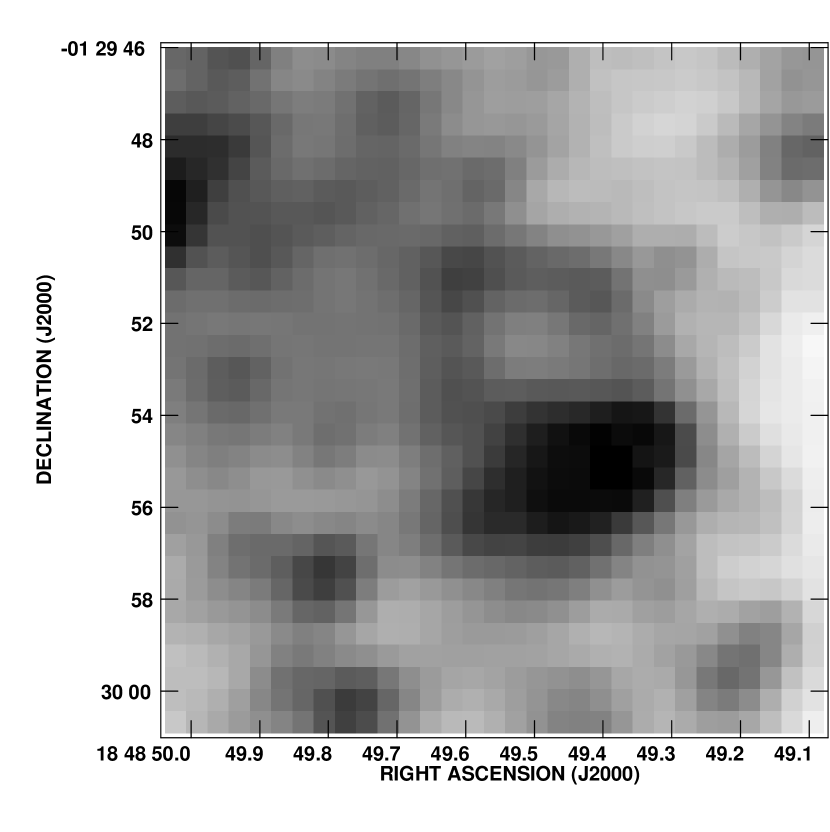
One interesting object visible in both the WIRO near-IR and IRAC mid-IR images is a loop-like structure on the Galactic north side of the brightest stellar peak in the cluster. The center of the loop is located at RA(2000)=18h48m49.58s, DEC(2000)=-01d29m53s. Figure 13 shows the WIRO H-band image of a small region around this feature. The loop has a diameter of about 9 pixels (4) arcsec in the WIRO images. It is seen at all wavelengths except 8m where the angular resolution of Spitzer/IRAC becomes insufficient to resolve it. At the adopted distance of the cluster, the linear diameter of the loop would be 0.058 pc or AU. This size is much larger than dust shells ejected by individual asymptotic giant branch stars near the end of their lives. The lack of strong radio emission rules out a supernova remnant. The shell diameter is comparable to the dimensions of old nova shells with ages of tens of years (e.g., Downes & Duerbeck 2000) which are generally seen in emission lines, but sometimes detected in continuum light. Dust in the shell could scatter stellar light from the cluster and explain the strong continuum detection. The object may also be a young planetary nebula shell. In either case, velocity-resolved spectroscopy should be performed to measure the kinematics of the shell and provide additional clues to its origin. If the object is a recent nova shell produced by a cluster member, and if archival images exist that could pinpoint the date of the nova, then a measured expansion velocity could be used to measure a direct kinematic distance to the cluster independent of assumptions about a Galactic rotation curve or peculiar cluster motions. However, with optical extinctions of , even the brightest Galactic novae with absolute visual magnitudes of -11 (Duerbeck 1981) would only reach apparent magnitudes of , making it unlikely that it would have been observed. If the object is a planetary nebula, chemical analysis of the nebula would help to determine whether GLIMPSE-C01 belongs to the older, metal-poor halo population of globular clusters or the younger more metal-rich disk population.
This discovery of a new nearby globular cluster suggests a plethora of followup observational programs. High resolution infrared spectroscopy of cluster members would be highly desirable to estimate its radial velocity and establish a kinematic distance. A proper motion measurement is needed in order to compute its orbital parameters and determine a probable origin in either the old halo cluster population of the younger disk population. Deep wide-field infrared photometry would help to establish the boundaries of the cluster and better constrain its total luminosity. The region of Y-shaped stellar outflows to the south (Galactic) of the cluster will make an interesting target for multi-wavelength studies of star formation activity in the vicinity of the cluster.
References
- (1)
- (2) Benjamin, R., et al. 2003, PASP 115, 953
- (3) Bica, E., Dutra, C. M., Soares, J., Barbuy, B. 2003, A&A, 404, 223
- (4) Bonatto, Ch., Bica, E., Girardi, L. 2004, A&A, 415, 571
- (5) Borissova, J., Pessev, P., Ivanov, V. D., Saviane, I., Kurtev, R., Ivanov, G. R. 2003, 411, 83
- (6) Cardelli, J. A., Clayton, G. C., & Mathis, J. S. 1989, ApJ, 345, 245.
- (7) Carpenter, J. 2001, AJ, 121, 2851.
- (8) Churchwell, E.B., et al. (The GLIMPSE Team) 2004, ApJS, 154, 322
- (9) Clemens, D. P. 1985, ApJ, 295, 422
- (10) Cohen, M., Megeath, S.T., Hammersley, P.L., Martín-Luis, F., & Stauffer, J. 2003, AJ, 125, 2645
- (11) Condon, J. J., Cotton, W. D., Greisen, E. W., Yin, Q. F., Perley, R. A., Taylor, G. B., & Broderick, J. J. 1998, AJ, 115, 1693
- (12) Demarque, P., Guenther, D. P & Green, E. M. 1992, AJ, 103, 151
- (13) Duerbeck, H. W. 1981, PASP, 93, 165
- (14) Dutra, C. M., Bica, E., Soares, J., Barbuy, B. 2003, A&A, 400, 533
- (15) Downes, R. A. & Duerbeck, H. W. 2000, AJ, 120, 2007
- (16) Fazio, G. et al. 2004, ApJS, in press
- (17) Felli, M., Churchwell, E., Wilson, T. L., Taylor, G. B. 1993, A&AS, 98, 137
- (18) Friel, E. D. 1995, ARA&A, 33, 381
- (19) Harris, W. E. 1996, AJ, 112, 1487
- (20) Hawarden, T. G., Leggett, S. K., Letawsky, M. B., Ballantyne, D. R., & Casali, Mark M. 2001, MNRAS, 325, 563
- (21) Ho, L. & Filippenko, A. V. 1996, ApJ, 466, 83.
- (22) Hurt, R. L., Jarrett, T. H., Kirkpatrick, J. D., Cutri, R. M., Schneider, S. E., Skrutskie, M. & van Driel, W. 2000, AJ, 120, 1876
- (23) Indebetouw, R. et al. 2004, in press
- (24) Ivanov, V. D., Borissova, J., Pessev, P., Ivanov, G. R., Kurtev, R. 2000, A&A, 394, 1
- (25) Langer, W. D., & Penzias, A. A., 1990, ApJ, 357, L1477
- (26) Leitherer, C. et al. 1999, ApJS, 123, 3
- (27) Maloney, P. R. & Black, J. H. 1988, ApJ, 325, 389
- (28) Mercer, E.P., et al. (The GLIMPSE Team) 2004, ApJS, 144, 328
- (29) Richardson, K. M. & Wolfendale, A. W. 1988, A&A, 201, 100
- (30) Schlegel, D. J., Finkbeiner, D. P., Davis, M. 1998, ApJ, 500, 525
- (31) Simon, R., Jackson, J. M., Clemens, D. P., Bania, T. M., & Heyer, M. H. 2001, ApJ, 551, 747
- (32) Simpson, J. P. & Cotera, A. S. 2004, BAAS, 204.4501
- (33) Whitney, B.A., et al. (The GLIMPSE Team) 2004, ApJS, 154, 315
- (34) Whitmore, B. A., 2000, “The Formation of Star Clusters”, proceedings from the Space Telescope Science Institute Symposium


| Parameter | Value |
|---|---|
| RA (2000) | 18h48m49.7s |
| DEC (2000) | -01d29m50s |
| 31.30 | |
| -0.10 | |
| (kpc)aaestimated distance from the sun and distance from the Galactic center | 3.1 |
| (kpc)aaestimated distance from the sun and distance from the Galactic center | 6.8 |
| (arcsec)bbhalf light radius at K, 3.6 m, 4.5 m | 36 |
| (arcsec)cccore radius, defined as the radius where the surface brightness drops to half of the central value | 30 |
| (mag)ddapparent magnitude or flux, not corrected for extinction, within a 90 ′′ radius aperture | 3.77 (19.3 Jy) |
| (mag)ddapparent magnitude or flux, not corrected for extinction, within a 90 ′′ radius aperture | 2.24 |
| (mag)ddapparent magnitude or flux, not corrected for extinction, within a 90 ′′ radius aperture | 3.30 |
| ddapparent magnitude or flux, not corrected for extinction, within a 90 ′′ radius aperture | 14.3 |
| ddapparent magnitude or flux, not corrected for extinction, within a 90 ′′ radius aperture | 9.9 |
| d,ed,efootnotemark: | 14.6 |
| d,ed,efootnotemark: | 23.7 |
| ffIRAS flux; most measurements are highly uncertain due to large beamsize and high background | 16.4L |
| ffIRAS flux; most measurements are highly uncertain due to large beamsize and high background | 18.9: |
| ffIRAS flux; most measurements are highly uncertain due to large beamsize and high background | 285 |
| ffIRAS flux; most measurements are highly uncertain due to large beamsize and high background | 1516L |
| (mag) | 15 |
| (mag) | 1.7 |
| ggapparent magnitude, corrected for extinction, with mag | 2.07 |
| hhestimated V-K color for starbursts of ages yrs to yrs (Starburst99) and for globular clusters (Harris 1996) | 1.5 – 1.9 |
| iiestimated absolute magnitudes at a distance of 3.1 kpc, including uncertainties on distance and reddening | -10.3 |
| iiestimated absolute magnitudes at a distance of 3.1 kpc, including uncertainties on distance and reddening | -8.4 |