High Resolution, Long – Slit Spectroscopy of VY CMa: The Evidence for Localized High Mass Loss Events
Abstract
High spatial and spectral resolution spectroscopy of the OH/IR supergiant VY CMa and its circumstellar ejecta reveals evidence for high mass loss events from localized regions on the star occurring over the past 1000 years. The reflected absorption lines and the extremely strong K I emission lines show a complex pattern of velocities in the ejecta. We show that the large, dusty NW arc, expanding at 50 km s-1 with respect to the embedded star, is kinematically distinct from the surrounding nebulosity and was ejected about 400 years ago. Other large, more filamentary loops were probably expelled as much as 800 to 1000 years ago while knots and small arcs close to the star resulted from more recent events 100 to 200 years ago. The more diffuse, uniformly distributed gas and dust is surprisingly stationary with little or no velocity relative to the star. This is not what we would expect for the circumstellar material from an evolved red supergiant with a long history of mass loss. We therefore suggest that the high mass loss rate for VY CMa is a measure of the mass carried out by these specific ejections accompanied by streams or flows of gas through low density regions in the dust envelope. VY CMa may thus be our most extreme example of stellar activity, but our results also bring into question the evolutionary state of this famous star. In a separate Appendix, we discuss the origin of the very strong K I and other rare emission lines in its spectrum.
1 Introduction
The powerful infrared source and OH maser VY Canis Majoris is one of a few very luminous cool hypergiant stars that define the empirical upper luminosity boundary in the HR diagram (Humphreys & Davidson, 1994; de Jager, 1998). It is thought to represent a very rapid stage of evolution characterized by a high mass loss rate. The red supergiant stage is a few hundred thousand years long, or less for the most massive stars, but the transition time from main sequence to RSG and later from RSG back to a yellow hypergiant may be only a few thousand years (Schaller et al., 1992; Schaerer et al., 1993). These evolved late-type stars are major sources of gas, dust and molecules that contribute to the replenishment of the interstellar medium. VY CMa, in particular, is ejecting large amounts of gas and dust at a prodigious rate. With its extended and complex circumstellar nebula, it offers a unique opportunity to study its high mass loss episodes and the detailed kinematics of this process.
VY CMa is a special case even among the rare hypergiants. It is associated with a region of recent star formation, the young cluster NGC 2362 and H II region Sharpless 310, and the dark cloud L1667, and has been considered a pre–main sequence star (Herbig 1970a,b; Lada & Reid 1978) as well as an evolved massive star (Hyland et al., 1969; Humphreys, 1975; Wallerstein, 1977). The lack of Li I 6707 (Wallerstein, 2001) plus its powerful double–peaked maser emission, like other evolved stars, is strong evidence that it is a massive post–main sequence object. The measured 12C/ 13C ratio (Nercessian et al., 1989) however is intermediate between what is measured for normal M supergiants and what is expected for the ISM. At a distance of 1.5 kpc (Herbig, 1972; Lada & Reid, 1978; Marvel, 1997) it is one of the most luminous red supergiants known (). With its very visible asymmetric nebula 10 across and high mass loss rate () (Danchi et al., 1994), VY CMa is also one of the most important for understanding the high mass loss episodes in massive star evolution.
Interferometric maps of the OH and H2O emission reveal a complex structure interpreted as either an expanding disk or bipolar outflow (Bowers, Johnston, & Spencer 1983; Richards, Yates & Cohen 1998) with expansion velocities of 30 – 40 km s-1 . Speckle imaging (Wittkowski et al., 1998) revealed an asymmetric resolved component 01 across, elongated approximately north-south. A geometry consistent with the maser maps and the infrared images (Monnier et al., 1999; Smith et al., 2001) is an axially symmetric model with a slightly flattened optically thick envelope or an equatorial disk and a bipolar flow/rotational axis aligned roughly northeast-southwest and inclined 15 to 30 to our line of sight (Morris & Bowers, 1980).
However, our multi-wavelength HST/WFPC2 images of VY CMa revealed a complex asymmetric distribution of material with no clear axisymmetric structures (See Figures 1,2, & 3 in Smith et al. (2001), and with no evident disk-like structure in the reflected optical light extending out to 2 or more from the star as proposed by Herbig (1970a,b), Efstathious & Rowan-Robinson (1990), and Monnier et al (1999). Instead, the circumstellar nebula is dominated by a prominent, nebulous arc to the northwest and two bright filamentary loops or arcs to the southwest of the star, plus some relatively bright condensations or clumps of dusty knots near the star, all of which are evidence for multiple and asymmetric mass loss events. The apparent random orientations of the arcs suggest that they were produced by localized events not strongly aligned to the star’s axis or equator. The models for disks are based on modelling the spectral energy distribution and therefore may be due reflected light from the prominent tail and the bright condensations near the star rather than a true disk. The arcs and loops also do not have the appearance of continuous outflow streams as suggested by Monnier et al. (1999), and are too massive to have been ejected by radiation pressure on dust. The initial ejection must have been induced by other processes. We therefore speculated that the arcs may be expanding loops caused by localized activity on the star’s ill-defined surface, involving magnetic fields and convection. Although this suggestion was conjectural, large starspots do occur on the surface of Ori (Gilliland & Dupree 1996; Kluckers et al. 1997; Uitenbroek, Dupree & Gilliland 1998; Dupree, Lobel & Gilliland 1999) with accompanying outflows and chromospheric activity (Lobel & Dupree, 2000, 2001). Non-radial pulsational instability is potentially an alternative ejection mechanism, but the distinction between pulsation and convection may be blurred in VY CMa.
To learn more about the morphology, kinematics, and possible origin of VY CMa’s
complex ejecta, we have obtained long-slit spectra to map
the emission and absorption lines across several structures, including
the prominent NW arc and the two bright filamentary loops to the southwest.
Our results reveal the presence of a complex pattern of velocities in the
the strong K I emission line and a significant velocity gradient
across the dusty northwest arc. We find that;
Most of the gas and dust in the nebula, however, is nearly stationary or moving
very slowly with respect to the star. This is not only surprising but may be difficult
to explain for an evolved, massive star.
Embedded in this nebula are several discrete structures that are kinematically
distinct from the surrounding stationary nebulosity. The NW arc and the two prominence–like
arcs are expanding at 40 – 50 km s-1 relative to the star.
They were ejected in separate events over several hundred years from different
locations on the star.
A strong absorption line in the reflected spectrum in the ejecta is identified
with Ca I]. Although absorption from a semi-forbidden line seems unlikely, we demonstrate that
the identification is probably correct.
The strong K I emission in the star and the ejecta has never been adequately explained.
In the Appendix, we discuss a possible mechanism for forming the K I emission and
other rare emission lines, including Ca I].
In the next section we briefly describe the observations and the data reduction procedures. The spectrum of the central star and the origin of its peculiar emission lines are discussed in §3 and in the accompanying Appendix. The kinematics of the gas and dust, the expansion of the arcs and loops, and the evidence for stationary ejecta are described in §4. In the final two sections we summarize the evidence for localized high mass loss events and comment on the perplexing nature of VY CMa.
2 Long–Slit Spectroscopy and Data Reduction
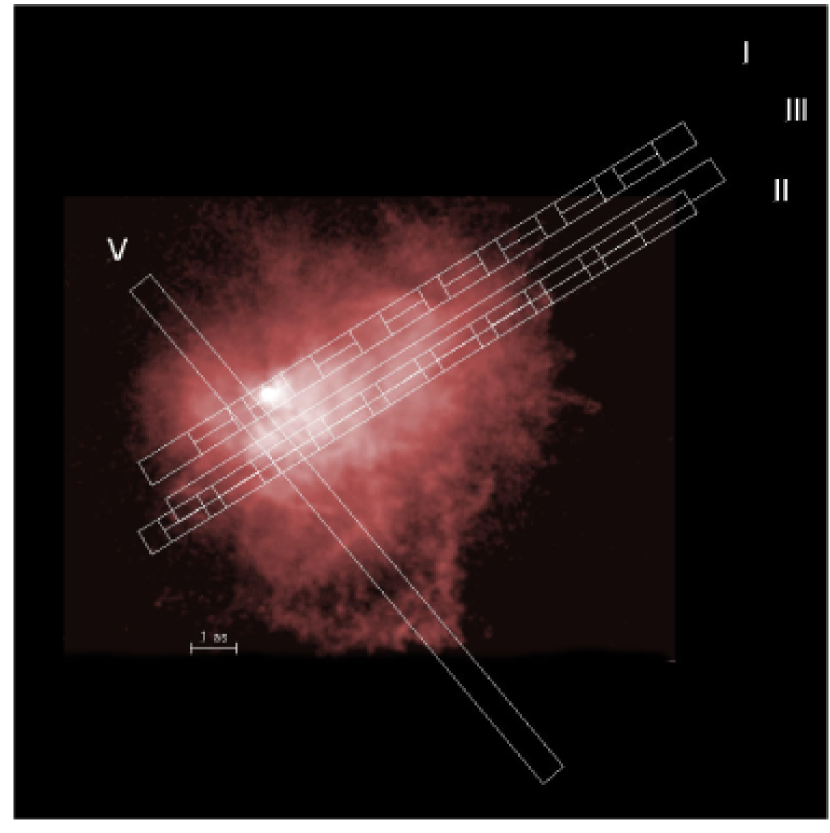
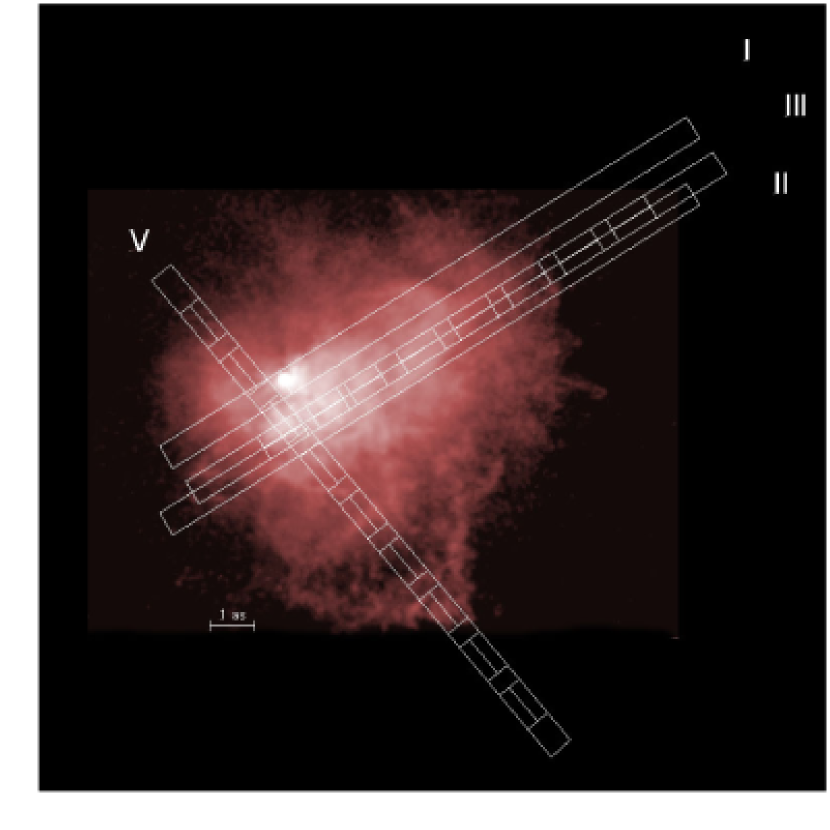
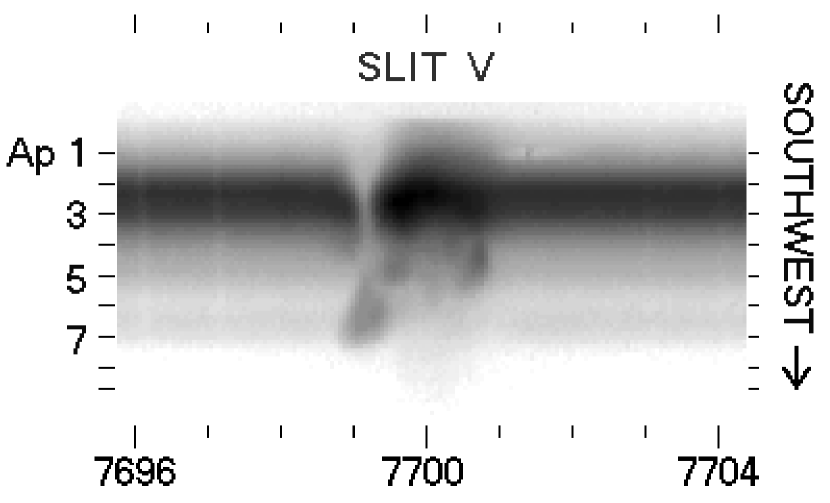
Spectra were obtained at four slit positions across the nebula (Figures 1a and 1b) with the HIRES echelle spectrograph on the Keck1 telescope on Mauna Kea in December, 2002. The resolution was 40000 with a dispersion of .06Å per pixel and a spatial scale of 019 per pixel. Our spectral coverage from 6410 to 8727Å in 15 orders with inter–order gaps was chosen to measure the velocities of known emission lines plus several absorption lines in the 8400 – 8700Å region. We used the B3 decker which gives a 14 long slit with a 057 slit width. Three of the slit positions are parallel across the nebula and cross clumps of knots, filaments, and the NW arc. One of the slit positions(I) includes the star. The fourth slit (V) crosses the two prominence–like arcs, 1 and 2, in the outer parts of the ejecta to the southwest and the clump of knots south of the star. The seeing was estimated as 08 or better throughout the night. The observations are summarized in Table 1.
All of the data reductions and extractions were performed using IRAF111IRAF is written and supported by the IRAF programming group at the National Optical Astronomy Observatories (NOAO) in Tucson, Arizona. NOAO is operated by the Association of Universities for Research in Astronomy (AURA), Inc. under cooperative agreement with the National Science Foundation. The frames were trimmed, bias subtracted and flatfielded. Calibration and object exposures were combined for each slit position. Using the quartz exposures for reference, we extracted each echelle order from the combined frames using the ‘strip’ option in the IRAF task apsum. The dispersion corrections were determined for each order separately. No sky subtraction was done because emission and absorption lines are still apparent in the most distant apertures, beyond the visible nebulosity.
The spectra were then extracted in 1″ long apertures deliberately placed across prominent features including the NW arc, the filamentary arcs, the knots and the embedded star. Additional extractions were then made along the slit keeping 04 separation between apertures. The positions of the apertures are summarized in Table 2; the positions are given along each slit with respect to the point nearest the star, the radial distance of each aperture from the star, and the position angle from the star. Figures 1a and 1b show the positions of the extraction apertures for slits I and II, and for slits III and V, respectively. Four extractions were made along slit III, across specific features listed in Table 2 plus four additional apertures to the end of the slit. The wavelength calibration was then applied to each extracted spectrum. The separate exposures were averaged to remove cosmic rays, except for those along Slit I which were summed because only two exposures were available.
3 The Spectrum of the Embedded Star and Its Ejecta
VY CMa probably represents the most extreme known case of stellar activity, in the same sense as, e.g., Ori. Its inner wind (chromosphere?) has a density comparable to that of Ori, but the volume, mass, and energy are larger by almost two orders of magnitude. The photosphere is appreciably cooler than Betelgeuse and is about one order of magnitude more luminous. The observed emission lines – particularly the strong K I and the Ca I] emission features – differ from Ori and have not been explained. In the next few paragraphs we review what one expects to see in this situation.
The photospheric temperature, luminosity, and radius are thought to be, respectively, around 3000 K characteristic of an M5 type supergiant, , and 12 AU. (If the wind is opaque, then is larger than the true stellar radius , the sonic point in the flow.) The usually quoted mass-loss rate and wind speed, yr-1 and 35 km s-1, imply that the wind density at AU is cm-3 or g cm-3.
Given those parameters, we expect dust grains to condense near radius AU, at temperatures around 1000 K. If the resulting dust-to-gas ratio is “normal”, then, at red wavelengths Å, the opacity is cm2 g-1 and the average optical thickness due to dust outside is . Observations of scattered light at radii 2000 AU seem consistent with this amount of dust (Smith et al., 2001). With such a large average , one might naively expect the object to be seen only as a mid-IR source. In reality, however, the dust should be very inhomogeneous. Even if the inner wind is smoothly isotropic (which we doubt), radiative acceleration acting on the dust near is unstable in a Rayleigh-Taylor-like manner; the ensuing flow must be clumpy with a fairly small size scale.222 Let = wind speed, = sound speed in the wind, and = acceleration due to radiation acting on the dust; then the three most obvious characteristic size scales for instabilities near are , , and . For VY CMa, the last of these is of the order of 5–10 AU while the others are much less; so the expected condensations in the region just outside should be, typically, no larger than 10 AU, and very likely smaller. Therefore we should not be surprised to see visual- or red-wavelength light from the star, escaping along low-density paths through a very inhomogeneous dusty shell. Since the material is expanding, and a typical photon may be scattered one or more times before it escapes, the emergent spectrum is likely to be red-shifted by an amount comparable to the wind speed , and somewhat blurred in wavelength. Van Blerkom and Van Blerkom (1978) described this process for a constant wind speed, and the effect may be supplemented by radiative acceleration of material in the regions most favorable for photon escape, i.e., in relatively low-density gas between condensations.
After escaping from the inner dusty region, some photons can be scattered sideways by dust in the outer ejecta, causing us to see an extended, inhomogeneous halo around the bright central region. Any photon that is scattered toward an appreciably non-radial direction is Doppler shifted by a net amount , where is the outward wind speed and is (scattering angle). Thus we expect the spectrum reflected in the halo to be more red-shifted than that seen when we observe the central source. Since a line of sight through the halo typically samples a range of -values, the reflected spectrum should be blurred more than the central spectrum.
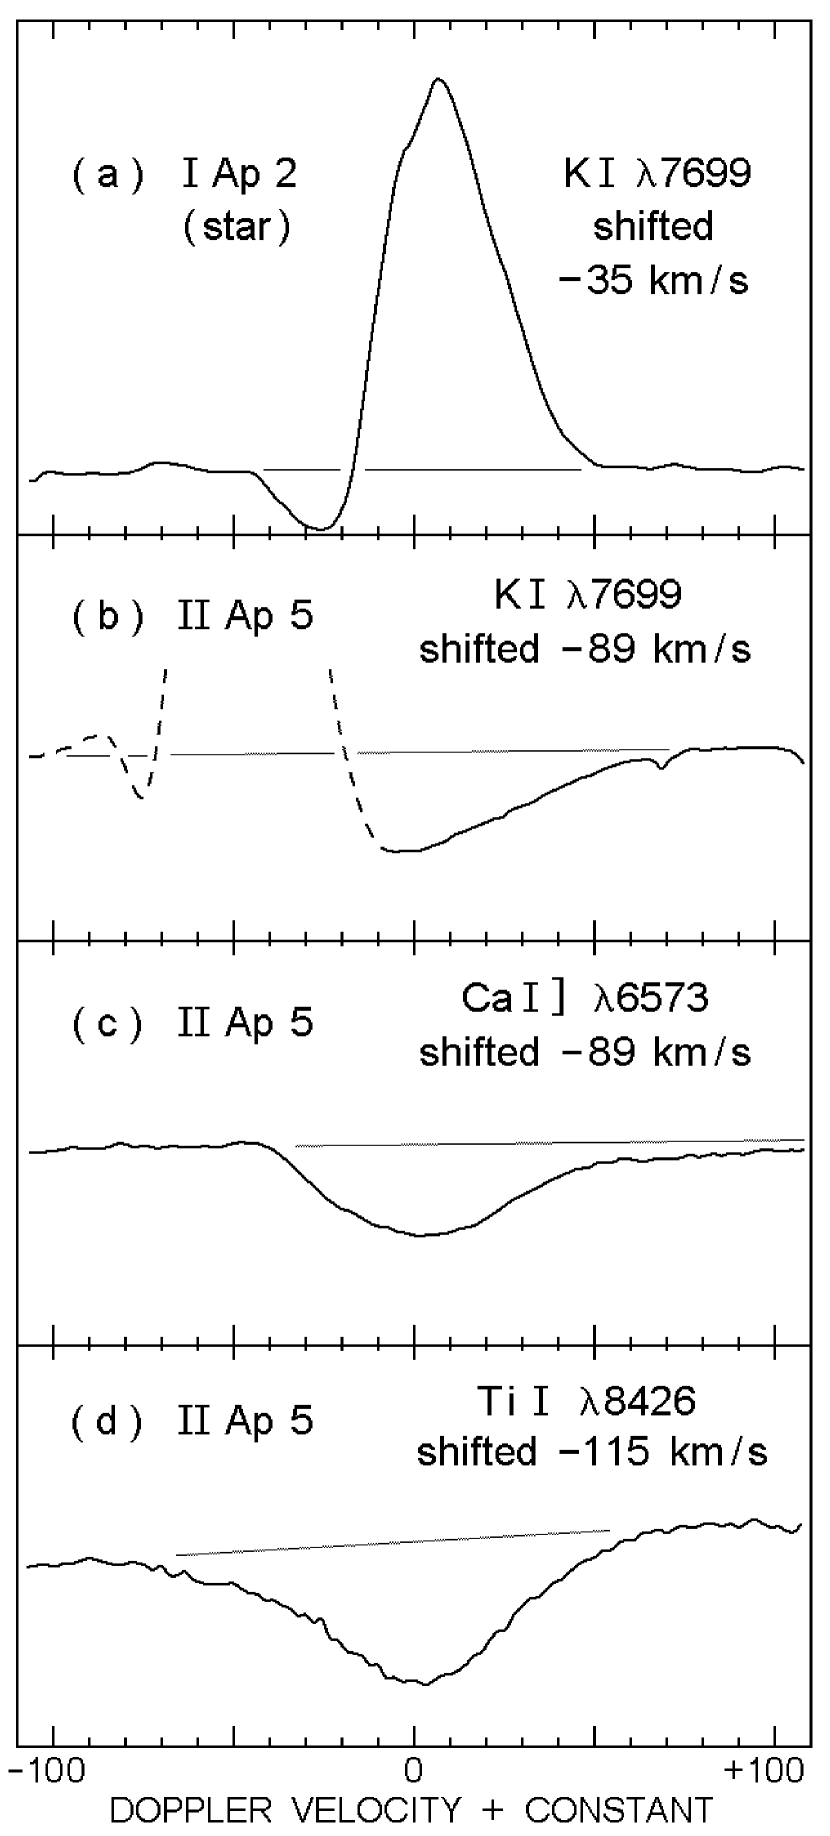
Generally speaking, observations of VY CMa confirm the above expectations. At wavelengths around 7000 Å, very roughly 2 percent of the star’s light escapes through the dust (see measurements reported in Smith et al. 2001), suggesting typical optical depths of the order of 4 or 5, not 50, along the photon escape routes. Absorption lines in the central emergent spectrum are Doppler-shifted by about +25 km s-1 relative to the supposed systemic velocity, and are somewhat broader than one expects for such a low-gravity star. When reflected in the halo, the same features have larger Doppler shifts and are more blurred (Fig. 6). Throughout this paper we shall note additional details that do not fit the above picture in straightforward ways.
3.1 The Spectrum of the Central Star
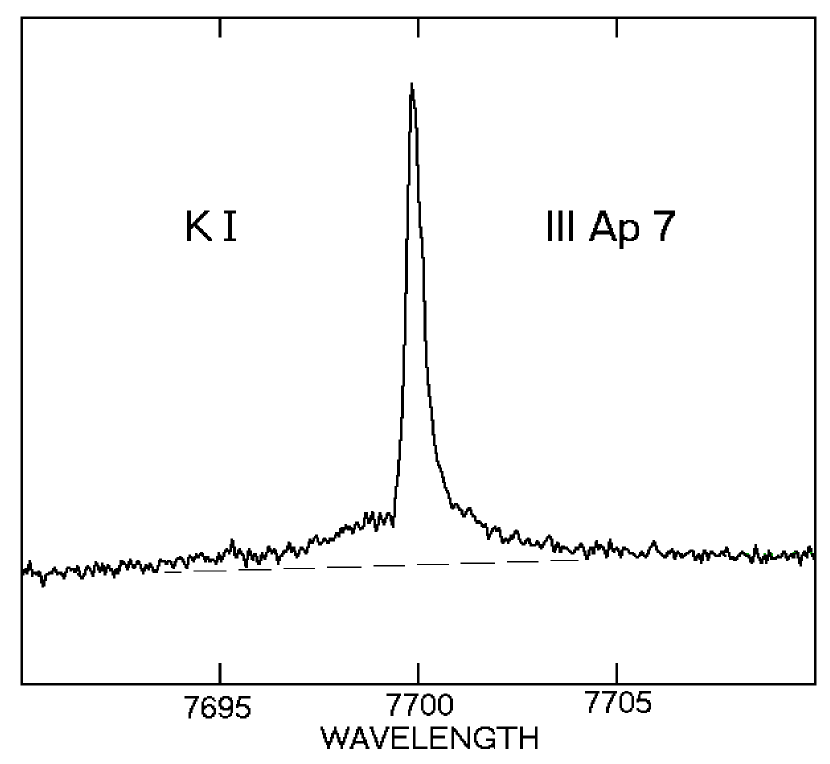
The K I resonance lines ( 7665, 7699) are not only the strongest emission lines in the spectrum of VY CMa (Wallerstein, 1958), but these lines, rarely observed in emission, are stronger in VY CMa than in any other known late-type star (see Bernat & Lambert 1976, Guilain & Mauron 1996). In addition to K I, strong emission is also present in the Na I “D” lines, Ca I] 6572Å, and Rb I (7800, 7948)(Wallerstein, 1971). Narrow band heads of ScO (Wallerstein in Hyland et al 1969 and Herbig 1974), and band heads of TiO and VO, plus lines of Fe I, Ti I and Cr I (Wallerstein, 1986) are also in emission. Our wavelength coverage includes K I 7699, Ca I] 6572 and Rb I 7948, but not the Na I “D” lines. In addition to the emission features, there are strong absorption lines of Ca II, Fe I, and Ti I in the wavelength region from approximately 8400 to 8700Å that are relatively free from molecular absorption bands so they can be confidently used for radial velocity measurements. In our data, the central star is in aperture 2 on Slit I (Fig. 1a), and examples of the emission and absorption lines in the ejecta are shown in figures throughout the paper. The spectrum at the star does not show any significant differences from those published earlier and the velocity measurements for the star summarized in Table 3 are consistent with previously published results. All velocities in this paper are Heliocentric.
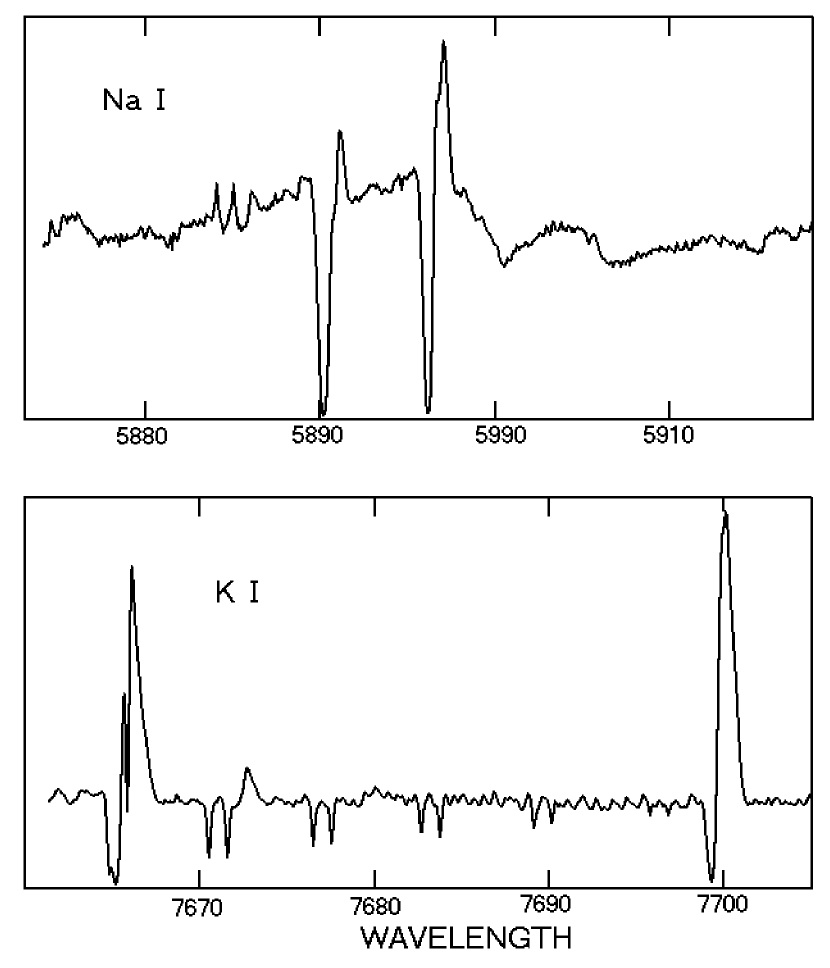
In Figure 2 we show the K I and Na I line profiles on the star from a HIRES spectrum obtained by George Herbig in 2000 that includes the D lines. Both the K I and Na I emission have peak fluxes several times as high as the continuum, and not surprisingly, their doublet ratios show that they are optically thick. The minima in the strong P Cygni profiles have the same velocity at 15 km s-1. For the K I lines, this is a shift of 30 km s-1 from the emission peaks which have a mean velocity of 45 km s-1, consistent with our measured K I and Ca I] emission velocities. The Na I emission peaks however occur at 60 km s-1 which agrees with our mean absorption line velocity at the star (Table 3). It has been recognized for some time (Humphreys, 1975; Wallerstein, 1977) that the absorption line velocities are not only different from the K I and Ca I] emission lines, but also deviate significantly from the velocity of the system inferred from the OH and H2O maser observations, V 20 – 22 km s-1 (VHel 35 – 37 km s-1)(Bowers, Johnston & Spencer 1983). Herbig (1970a) first suggested that the stellar absorption lines are red-shifted and broadened due to scattering by an expanding dust shell or equatorial disk, and as mentioned above, this was modelled by Kwok (1976) and van Blerkom and van Blerkom (1978). Note that our velocities for the K I and Ca I] emission lines at 41 km s-1 are significantly less than the mean absorption line velocity. This difference is usually attributed to the location where the emission lines are formed, outside the inner radius of the dusty shell or disk.
The extremely strong K I emission and other rare emission lines such as semi–forbidden Ca I] are difficult to explain. In the Appendix we discuss problems associated with the formation of the K I lines in VY CMa. Some obvious excitation processes such as collisional and radiative recombination are eliminated, and while resonant scattering is the most promising explanation, it requires a special geometry to cause strong net emission. We propose a model for the production of the very strong K I emission observed at the star, but problems associated with resonant scattering remain, especially in the ejecta.
3.2 The Reflected and Scattered Spectrum in the Ejecta
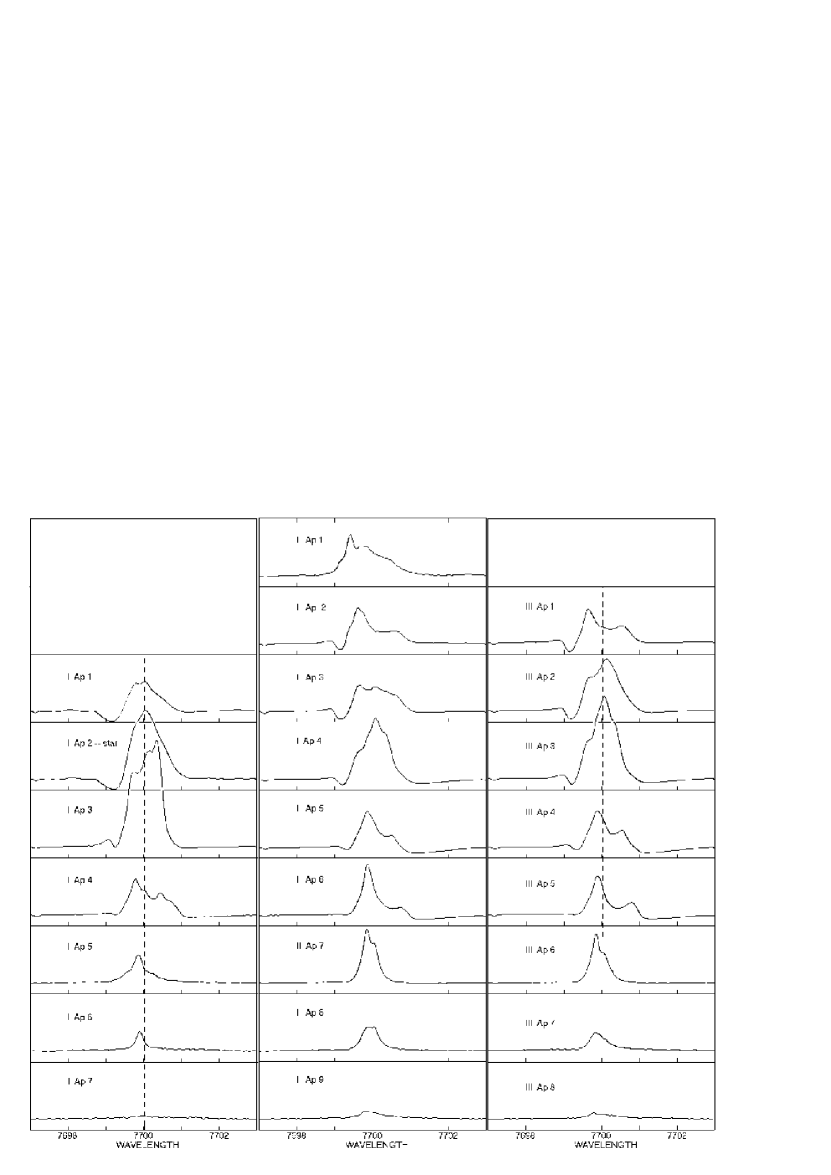
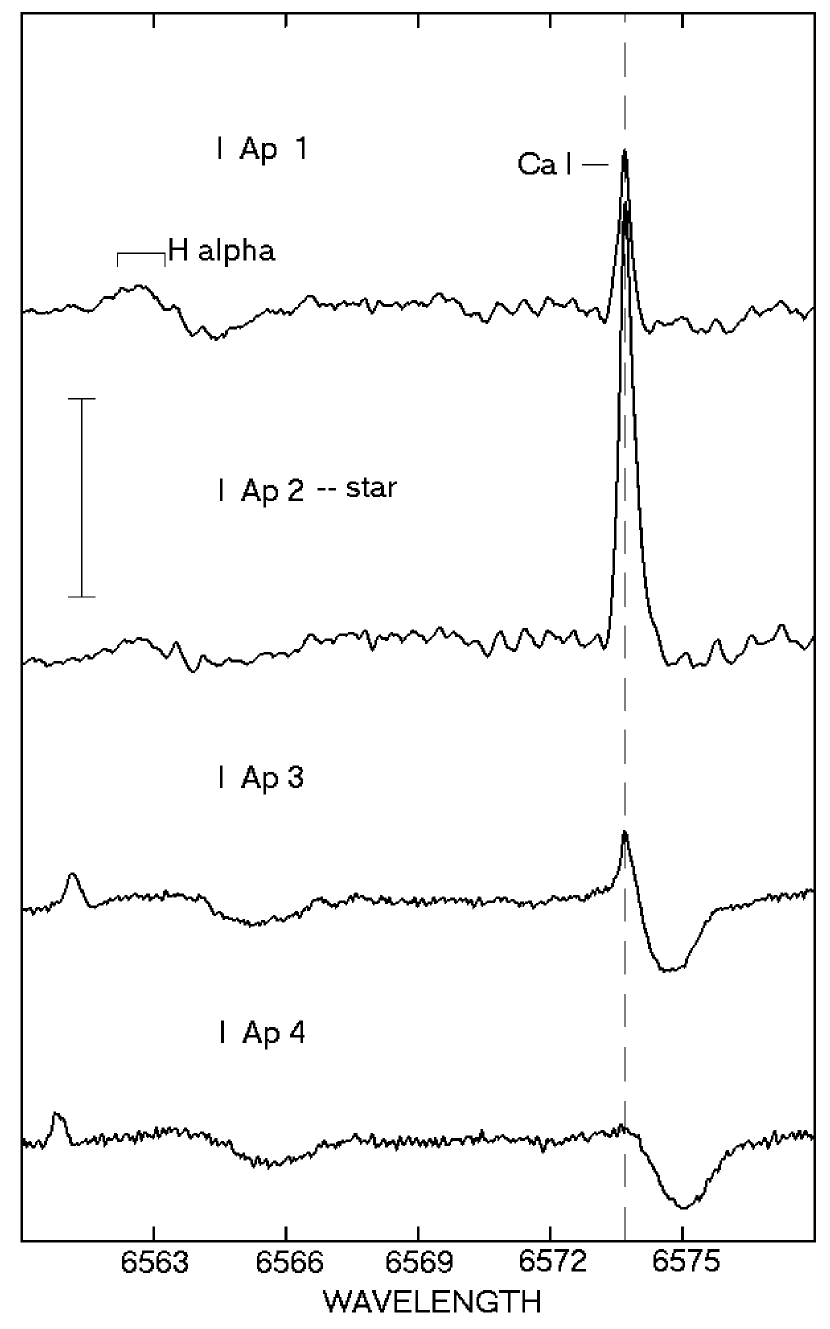
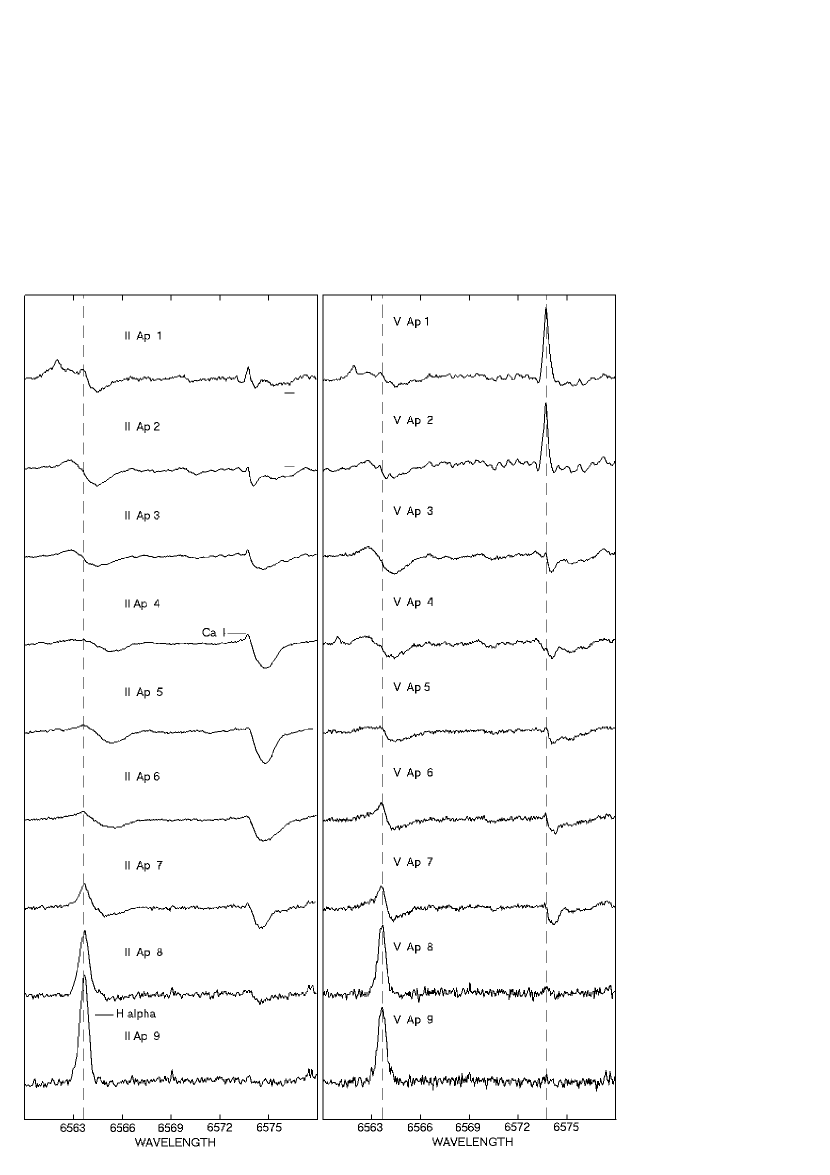
The strong K I emission line is our best tracer of the gas in VY CMa. It shows considerable variability with multiple emission peaks throughout the ejecta (see also Smith 2004). Examples of the line profiles along Slits I, II and III are shown in Figure 3, with their velocities summarized in Table 4.333The emission line profiles along Slit V are in Figure 7 and their velocities in Table 6. The emission profile on the star is single (Slit I, Ap 2) with a strong P Cygni absorption feature formed in its expanding wind. The P Cygni profile is present in the reflected spectrum near the star and is gradually red-shifted due to scattering by the dust expanding outwards. Off the star, the K I profiles along the slits are much more complex, often with two or more recognizable emission peaks. In the outermost apertures the profiles become single and narrow. An emission peak with the expected systemic velocity is observed throughout much of the ejecta to the west and northwest of the star. It has a nearly constant velocity at increasing distances and is essentially motionless relative to the star. This and other evidence for stationary gas and dust in VY CMa’s ejecta are discussed in §4.3.
Interestingly, a broad and shallow K I absorption feature to the red of the emission profile is present at positions where the slits cross the dusty condensations and nebulous arcs primarily to the west and NW of the star. This may be an inverse P Cygni profile, but the broad absorption minimum has a red-shifted velocity, typically 86 km s-1 (Table 5) like the other reflected absorption lines at the same positions (see §4.1). Note that on average, the K I emission greatly exceeds the strength of the absorption in our data. One would normally expect emission to balance absorption for a resonance–scattered line (see the Appendix).
The semi-forbidden Ca I] 6572 emission line (Figs. 4 and 5) is visible only in the extractions on and near the star. The line is very narrow, does not show the multiple peaks observed in the K I line, and has essentially a constant Doppler velocity at 41 km s-1 like that for the K I emission on the star (Table 4). A strong, reflected absorption line which we attribute to Ca I] absorption is present in the ejecta. Although absorption in a semi-forbidden line seems unlikely, we demonstrate later, §4.1, that this identification is almost certainly correct. Another rare emission line, Rb I at 7948, is present in the reflected spectra, but is relatively weak and broad.
H emission in VY CMa is usually reported as very weak and variable. We find that the relative strength of the H emission depends on position in the nebula (See Figs. 4 and 5). In the inner region of the ejecta it is weak and broad with an associated broad shallow absorption. The narrow H emission line visible in the outermost extractions along all of the slit positions is nebular from the nearby H II region Sharpless 310. VY CMa lies just to the west of an arc of nebular emission. Weak nebular emission from [N II] and [S II] is also present in the spectra at the same positions. The velocity of this H line at 35 – 37 km s-1 agrees with the systemic velocity and the velocities of the K I lines measured at the same positions, thus confirming the close association of VY CMa with the cluster and H II region.
4 Kinematics of the Gas and Dust
The reflected and scattered spectrum in the circumstellar ejecta reveals a remarkably complex behavior of both the emission and absorption lines. The K I emission line profiles and their Doppler velocities vary with position in the nebula as the slits cross recognizable knots, arcs, and filamentary features in the image. They also indicate apparently stationary gas in the same projected locations, which is difficult to understand for the reasons noted below. The reflected absorption lines show a strong velocity gradient across the prominent nebulous arc to the NW of the star, while the same absorption lines along slit V show virtually no variation in Doppler velocity. These phenomena are discussed in the following subsections.
4.1 The Velocity Gradient Across the NW Arc
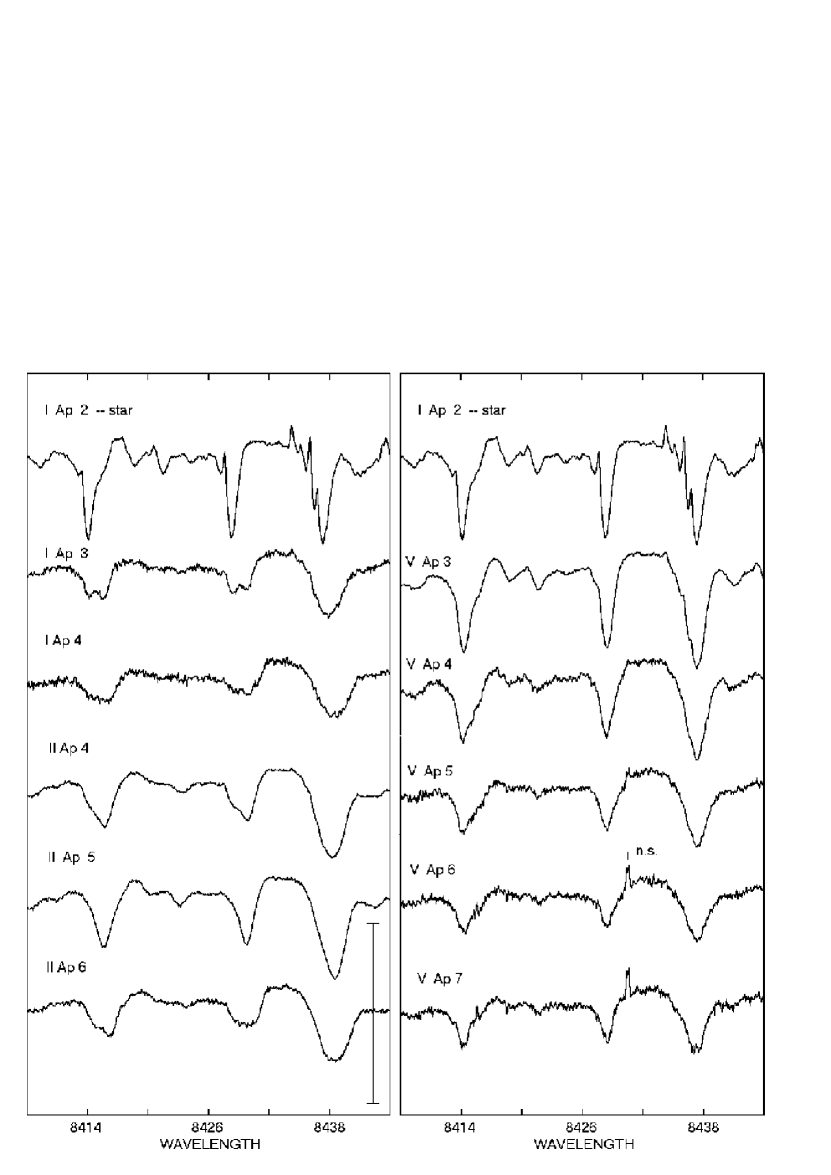
The absorption lines from the obscured star and the dusty ejecta are reflected or scattered by the embedded dust grains and reveal both the relative motions of the dusty clouds and the velocity dispersions within them. The mean velocities of the strong absorption lines of Fe I, Ti I, and Ca I in the far–red spectrum are summarized in Table 5 and examples of their profiles are shown in Figure 6.
A few of the lines in apertures on and near the NW arc are double or slightly asymmetric. For example, four of the absorption lines in I Ap 3 are double so we used the blue components, which agree with the velocities of the single lines, for the mean velocity in Table 5. In the extractions immediately on either side of the NW arc, a few of the absorption lines also have asymmetric profiles. Only the single lines and well defined absorption minima of the some of the asymmetric lines were used for the mean velocity. The asymmetries may be due to additional dusty clouds along the line of sight or to the expected gradient along the NW arc.
The absorption line profiles from the dusty arcs are broad and shallow compared to the narrower profiles on and near the star. Along Slit I, for example, the equivalent widths of the absorption lines show only a small decrease from the star to Ap 3 and Ap 4 (NW Arc), but the FWHM of the same profiles increase by a factor of 2 to 3 due to the scattering and motions of the grains. To determine the velocity dispersion of the particles responsible for the broadening, we smeared the stellar profiles of the Fe I and Ti I absorption lines with a Gaussian. We used a range of values of from 0.5Å to 1.6Å and compared the smeared stellar lines with the observed profiles along the slits. The best fit varied slightly from line to line and of course for the different apertures, but for those profiles across the NW arc, the required smearing corresponds to a FWHM of 85 to 120 km s-1. The total velocity range will be even larger. The dusty scattering regions in this visible feature thus have a relatively high velocity dispersion in addition to their net motion with respect to the star.
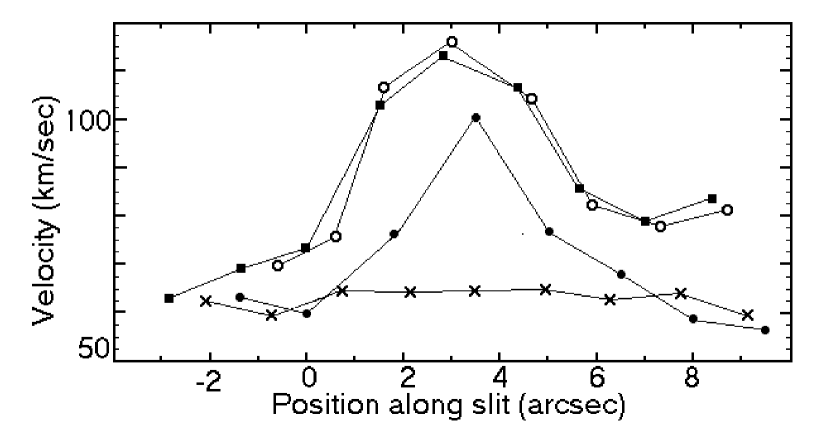
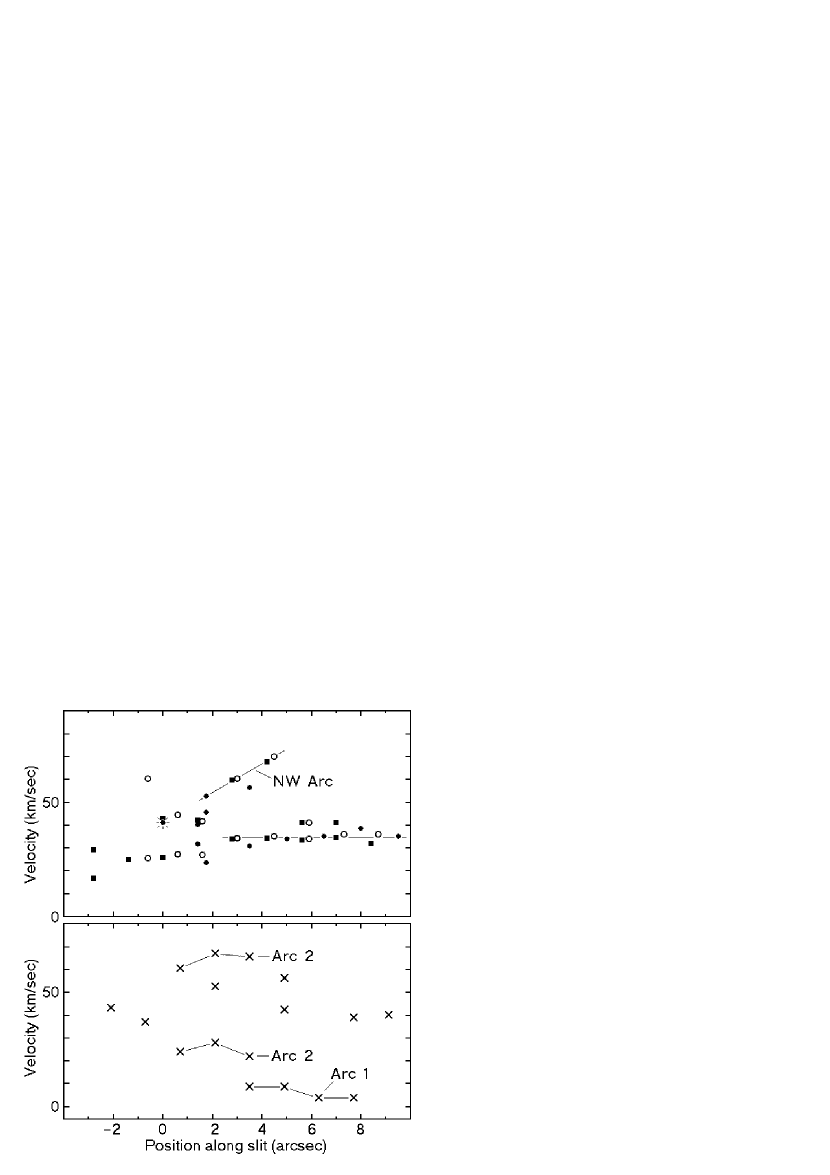
The mean velocities for the absorption lines are plotted in Figure 7 with respect to the distance along each slit from the point nearest the star. They show a large redshift as the three parallel slits (I, II and III) cross the dusty arcs to the west and NW of the star, and then decrease in the outer nebulosity beyond the prominent NW arc. The profiles across the NW arc are significantly red-shifted with a velocity difference of +50 km s-1 relative to the star, suggesting a net motion of the expanding arc of this order. This difference is presumably the “moving mirror” redshift, , where U is the outward expansion of the reflecting material relative to the star and represents the direction of the flow relative to the plane of the sky ( for motion toward us).
If the NW arc represents the material from a single ejection event we expect the expansion velocity to be proportional to distance along the arc. This expected trend is not immediately obvious in the observed velocities. It is probably blurred in our data because of the size of the extraction apertures, although some subtle evidence for this effect may be present in the velocities between Slits II and III in apertures directly on the arc; III Ap 4 is slightly further from the star and has a higher velocity than II Ap 5. Moreover, in Figure 6, one can see a velocity component on the short wavelength side of the lines at position II Ap 4 and on the long wavelength side at II Ap 6. The velocity difference is consistent with the uniform expansion expected for the NW arc.
Unlike most other locations in the ejecta, appreciable K I absorption is observed in the extractions on and near the NW arc. It also shows an appreciable redshift at 85 km s-1 (Table 5), and the line is also quite broad and asymmetric. Unlike the other absorption lines, the K I velocity is approximately constant across the arc. This is probably due to the strong emission line covering or overlapping part of the absorption feature. The red wing of the K I absorption, however, does show a redshift as the slits cross the arc, from 135 to 151 km s-1 along Slit II.
Using the velocities from the absorption lines at position II Ap 5, directly on the NW arc, we apply its “moving mirror” redshift of 54 km s-1 to the K I velocity at this position, and get 31 km s-1, close to the 35 km s-1 systemic velocity of the star. We therefore assume that the K I absorption in some sense represents the spectrum of the star as seen from the NW arc. In Figure 8 we show the K I and Ca I] line profiles shifted by (35 + 54) km s-1, one of the ordinary absorption lines, and the K I emission at the star’s position, I Ap 2. The K I and Ca I] absorption features are centered close to zero and are thus nearly in the rest frame of the star. The Ti I absorption line is shifted an additional 25 km s-1 in Figure 8, because as explained in §1, it arises inside the circumstellar dust formation region. Since the K I and Ca I] absorption features do not need the extra 25 km s-1 shift, we conclude that they occur more than 100 AU from the star, outside the ring or shell of dust.444Since Ca I] 6573 is a semi-forbidden line, one would not have expected it to appear in absorption as observed. But the wavelength coincidence is essentially perfect, and we have found no other likely identification for the observed feature. Thus we must conjecture that some atomic-physics trick makes the oscillator strength much larger than one would expect. The red wing of the K I absorption, at 60 km s-1 with respect to the absorption minimum, indicates the presence of a substantial dispersion within the expanding gas of 100 km s-1 or more, about the same as observed for the other absorption lines at the same locations. This means that either the NW arc has a large disperison in its expansion velocity or a large extent along the line of sight, or both. Note that the “terminal velocity” of the K I P Cyg profile as seen at the star is also about 45 – 50 km s-1. Thus, the moving-mirror redshift at the NW arc, the P Cyg “terminal velocity”, the red wing of the K I absorption, and the reflected line widths all suggest flow speeds of about 50 km s-1. Expansion velocities greater than 35 km s-1 are required by the absorption line widths and there is no indication of velocities much greater than 70 km s-1 relative to the star.
An expansion speed of 50 km s-1 implies that must be near zero so the NW arc is basically moving across our line of sight. This is not a surprising result given its orientation and appearance within the nebula. Furthermore, the limits on the expected expansion velocity discussed above, 35 to 70 km s-1, would restrict to between -25 and +17. Assuming mostly transverse motion for the arc, at its distance from the star of about 3 or 4500 AU at 1.5 kpc from the Sun, the material in the NW arc was ejected about 400 years ago (-100, +200 yrs.).
We get a somewhat different result for slit I which crosses the NW arc at a section where it appears to be bending back toward the star. At I Ap 4 the Doppler velocities of the absorption lines are slightly lower and the “moving mirror” redshift relative to the star is 40 km s-1. Assuming 50 km s-1 for , is roughly for this position. Thus, this section of the NW arc may actually be the nearer side with a small component of motion toward us.
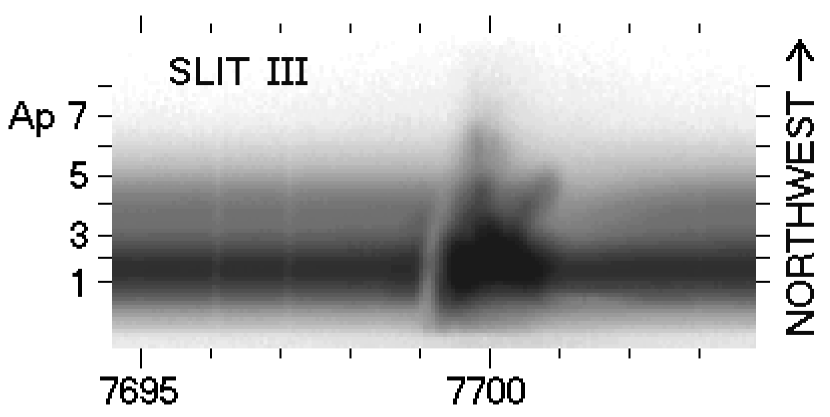
The corresponding K I emission, positions II Ap 5, II Ap 6, III Ap 4 and III Ap 5, has two definite velocity peaks (Figure 3) which can also be seen as two separate emission features in the image of Slit III in Figure 9. The shorter wavelength one presents some problems that are discussed in the next section. The red-shifted component with velocities of 60 to 70 km s-1 exhibits a small velocity gradient across the arc as one would expect for an ejection. Recognizing this trend, we can identify a corresponding bump in the line profiles at II Ap 4 and III Ap 3 at 52 km s-1 that probably corresponds to the same gas. Since this feature spatially coincides with the NW arc and is expanding, we presume that this is the associated gas. However, the Doppler velocity, at II Ap 5, for example, corresponds to a shift of 25 km s-1 relative to the star, half that for the absorption lines. The slope of the velocity gradient, 5 km s-1 per 1000 AU yields an expansion age of 950 years. If this emission is due to resonant scattering, then it is moving away from us at an angle of 30 which sems unlikely given the results from the absorption lines in the NW arc. If, on the other hand, it is reflected emission, it will be directed toward us at 30 since the redshift is smaller than for the absorption lines. The expansion age for the emitting gas is then about 550 years, comparable to the above results for the NW arc.
Slit positions III Ap 3 and II Ap 4 cross a filamentary, somewhat twisted arc just west of the star, between it and the NW arc. If we apply the same procedure described above for the NW arc with the K I and Ca I] absorption lines, we find that the moving mirror velocity for the dust is 45 km s-1 and the flow speed is 55 km s-1 with of . At its distance from the star, this material was ejected only 200 years ago.
In contrast with the results for the ejecta to the west and NW of the star, the Doppler velocities of the reflected absorption lines along Slit V are nearly constant (Table 5), show no gradient with position (Figure 7), and no significant velocity shift with respect to the velocity at the star. This suggests that the reflecting material is basically stationary relative to the star. This and other evidence for surprisingly stationary gas and dust in the circumstellar nebula is discussed in §4.3.
In the next section we discuss the significant velocity shifts in the scattered light from some of the K I emission lines in the ejecta and additional evidence for ejection of discrete features in the nebula.
4.2 Multiple Velocities in the K I Emission Feature
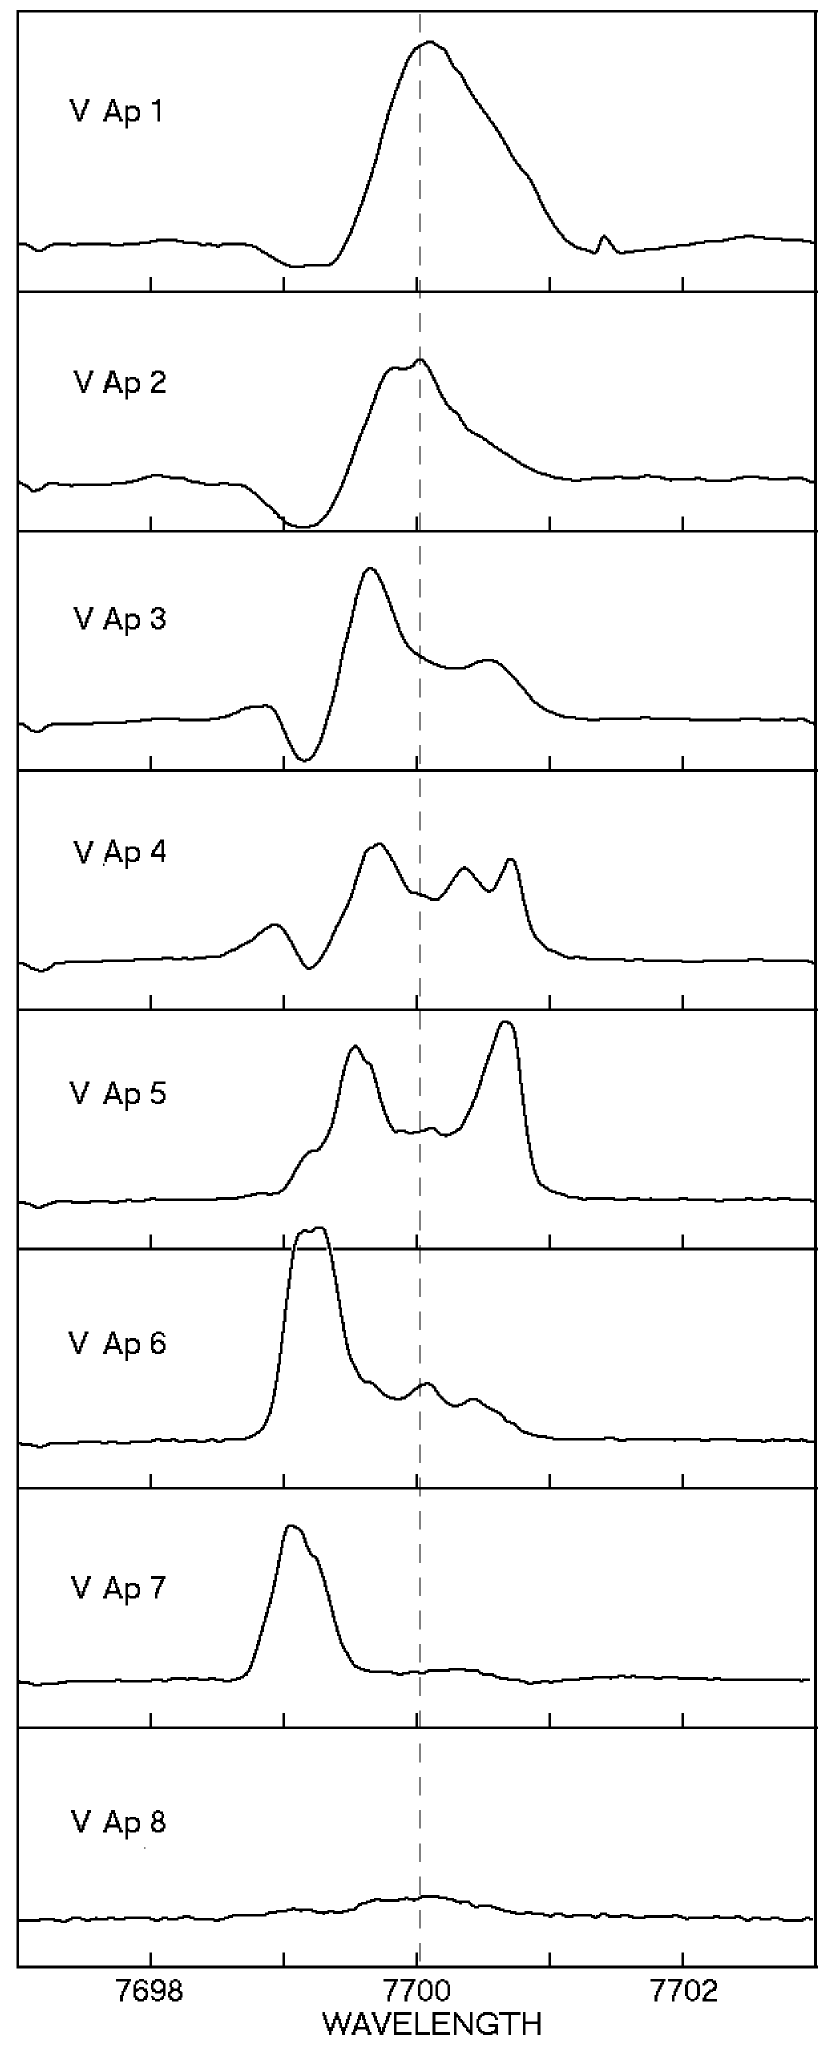
The K I emission line often shows a complex profile with multiple peaks that vary with position in the ejecta. If the K I emission lines in the ejecta are due to resonant scattering, the Doppler shifted and multiple peaks observed at different places must be due to gas moving at these different velocities thus permitting us to determine the expansion of the nebula and motions within it. However reflection by the dust can also contribute to the observed profiles. In this case we would expect to see either a single profile like that on the star, or an emission peak, with a velocity shift between the emission velocity at the star and the absorption lines at the same position. A few of the K I profiles closest to the star may be due to reflection or have a contribution from reflection. These appear to be either single or lack obvious multiple peaks even though the lines are quite broad. Some possible examples are the K I emission at I Ap 1, V Aps. 1 and 2 and III Ap 2 in Figures 3 and 11. For the multi-peaked profiles further from the star, it is difficult to determine if the emission is due to resonant scattering or reflection. Both processes are probably occurring.
In Figure 10 we show the variation of the emission line velocities along the different slits as we did in Figure 7 for the absorption lines. Slit V is shown separately. Along Slits I, II and III we see a pattern to the west and northwest of the star in which most of the K I profiles have an emission peak at a velocity near 35 km s-1 ( see Table 5). This is very apparent in Figure 9 as the strong, straight emission feature in the two-dimensional image of Slit III. Whether these emission peaks and single profiles are due to reflection or to resonant scattering, their velocities are consistent with stationary gas, near zero velocity with respect to the star. This possibility is discussed more fully in §4.3. A second, somewhat weaker emission peak present in extractions on the NW arc was discussed in the preceding section.
The changing profile and multiple peaks of the K I emission line along Slit V (Figure 11) show the most dramatic shifts in Doppler velocity with position in the nebula, and if these are due to resonant scattering in the gas, imply the existence of clouds or filaments of gas with a wide range of velocities in the ejecta. The K I line varies from a single profile in Ap 1 with a strong P Cygni absorption, similar to that viewed on the star, to multi-peaked profiles with large velocity shifts where the slit crosses knots and filaments in the outer parts of the nebula. The K I velocity to the north and east of the star, V Ap 1 and Ap 2, is consistent with that observed on the star and may simply be the reflected profile from the star as we mentioned earlier. In apertures south of the star across the dusty knots and arcs, one of the strong emission peaks in apertures 3 to 6 has a velocity like that of the reflected absorption lines (60 – 65 km s-1). This emission component may be reflected by the dust or due to resonant scattering by gas moving 30 km s-1 relative to the star. Likewise, the blueward peak near 25 km s-1 in the same apertures, may be either reflected or scattered emission and represents a separate flow of emitting gas along the same line of sight. The most striking change occurs across the two outer filamentary arcs (apertures 5 to 7) with the appearance of a strong blue-shifted emission feature. The sharp transition from an emission peak near 20 km s-1 in aperture 5 on arc 2 to the blue-shifted emission across arc 1 at 4 km s-1, suggests that this is resonant scattering in kinematically and spatially separate gaseous filaments or gas flows moving very differently from the reflecting dust. This shift can be clearly seen in the two-dimensional image in Figure 12 where narrow emission appears in the P Cyg absorption core and broadens out across arc 1. The P Cyg absorption is either no longer present or has been blocked by the strong blue-shifted emission. This is not a continuous outflow from a single ejection as suggested by Smith (2004), because these two emission features are resolved in the image of the slit. The velocities of the emission peaks associated with these three features are shown connected by a lines in Figure 10.
We can trace this prominent blue-shifted emission feature in the two dimensional image over 3 in the ejecta and directly across arc 1 in aperture 7. It corresponds to the strong emission peaks in apertures 6 and 7 and may also be weakly present in Ap 8 and possibly in Ap 5 as a small bump on the blue side of the profile. In Ap 6 broad, weaker emission scattered or reflected in gas at a range of velocities up to 60 km s-1 is also present, but is not observed in Ap 7 across the arc. We therefore identify this strong blue-shifted emission feature with resonant scattering by gas in a stream or flow associated with the material in arc 1. The Doppler velocities at 4 – 8 km s-1 indicate that this material is moving relative to the star at 30 km s-1 toward the observer. This of course contrasts sharply with the nearly constant 60 km s-1 velocity of the absorption lines, and suggests a significant kinematic difference between the gas in the arc and the surrounding circumstellar material similar to what we found for the NW arc. Although arc 1 has a significant velocity toward us relative to the star, its motion across our line of sight is not known. If we adopt 30 – 35 km s-1 from the width of the broadened absorption lines (see §4.3) at the same positions, as representative of the motions in the surrounding material for the transverse velocity, then the total motion relative to the star may be as much as 45 km s-1. The material associated with arc 1 would then have been ejected 1000 years ago assuming it is moving in the plane of the sky.
The two prominent emission peaks at 22 and 65 km s-1 across arc 2, in aperture 5, are well separated kinematically in the two dimensional image of the slit, but a spatial separation or identification with distinct features is not obvious in the images at these positions. The 65 km s-1 feature agrees with the velocity of the absorption lines in the same aperture, so we assume that this gas is associated with the reflecting dust, and since it is more red-shifted that it comes from background material. The second emission peak may then be due to reflection or resonant scattering by gas in arc 2. This implies a motion of 13 km s-1 relative to the star for the emitting gas along the line of sight. The corresponding motion of the arc across our line of sight is not known and may be different from the assumed 30 – 35 km s-1, but with this motion, arc 2 is moving at 37 km s-1 and was ejected about 800 years ago. Given the uncertainty in these estimates, it is possible that arcs 1 and 2 were ejected at about the same time. However the slit image shows that they are kinematically separate emission features which are also spatially separate in the WFPC2 image. Therefore assuming comparable outflow velocities relative to the star, arc 1 would have been ejected earlier, but the ejection times also depend on the projection angle for these structures which is not known.
Other distinct features in the ejecta such as the two clumps of dusty knots, S and SW, are much closer to the star and presumably represent material ejected much more recently. The evidence for localized mass loss events and stellar activity are discussed in §5.
4.3 Motionless Gas and Dust in the Ejecta?
The presence of gas and dust throughout the nebula, apparently at the same velocity of the star, presents a serious problem because it implies that much of the circumstellar material is nearly stationary or moving very slowly relative to the star. This certainly conflicts with what one expects for a red supergiant with a high mass loss rate.
In the ejecta to the west and NW of the star, the K I emission line has a velocity component consistent with relatively motionless gas, at the systemic velocity of the star, extending over 6 or 9000 AU in the nebula (Figure 10). If this emission is due to reflection by dust, we should see a shift in velocity with respect to the rest frame of the star even if the motion is transverse from a uniform flow of gas outwards. This is not observed. If it is resonant scattered emission, and if the emission comes from widespread transparent gas, we would expect to see a broad profile centered at the average velocity of the system. However, much of the nebula where this K I emission is observed is not transparent and, more importantly, the emission components are quite narrow. The FWHM’s range from 0.25 to 0.4 Å or only 10 – 15 km s-1 wide, compared to 1Å for the single K I profiles on and near the star. This is much less than the expected expansion speed of the ejecta and suggests that there is very little Doppler broadening in the lines. The emitting gas is therefore either not moving relative to the star, or all of the material must be moving in the plane of the sky i.e. in a narrow plane viewed perpendicularly. The latter seems highly unlikely over such a large area. Furthermore, some of the profiles show two emission peaks, one near 35 km s-1 and the other at 41 km s-1, the velocity at the star, suggesting that the emission is due to both reflection and resonant scattering. The narrow K I emission lines in the outer ejecta also have very broad emission wings that extend to 100 – 200 km s -1 from the center of the emission line (Figure 13). They are formed too far from the star to be electron scattering wings. It is possible that these emission wings are from more distant gas and dust, expanding outwards from VY CMa perhaps in a more spherical distribution from a much earlier unstable period in the star’s evolution.
There is also some evidence for constant velocities, or zero motion relative to the star, in the reflected light to the northwest of the star. After crossing the near side of the NW arc, the absorption line velocities measured in the outermost apertures along Slit I have a velocity like that observed at the star (see Figure 7). Along Slits II and III, however, the absorption line velocities decrease, but stay red-shifted relative to the star by 20 km s-1 perhaps because the material, in the same plane, is being pushed by the expanding arc.
The Ca I] emission has a nearly constant velocity at 40 – 41 km s-1 throughout the ejecta. Since this is the same as its velocity on the star, we assume that this is reflected emission. The CaI] emission profile does not show the variability with position and multiple peaks readily apparent in the K I emission line. As mentioned in the Appendix, the presence of this semi-forbidden line in both emission and absorption is not understood.
Along Slit V we observe absorption lines, including Ca I], and some K I emission with nearly constant velocities extending over much of the length of the slit and across the nebula555Except for Ap 1, there is no K I absorption along Slit V.. All of these indicators have apparent Doppler velocities near 60 – 65 km s-1 which is also the red-shifted velocity of the absorption lines scattered by the dust envelope around the star. For the absorption lines, this implies that the reflecting dust is not only barely moving but also has little motion with respect to the star. Unlike resonant scattered emission, reflected absorption lines are expected to show a redshift relative to the star even if the reflecting dust is moving perpendicular to our line of sight. Admittedly, the problem is reduced if the material is moving toward us; in that case, the “moving-mirror” effect is less, but there should still be a measurable redshift. Two selection effects, forward scattering by the dust plus extinction, can also serve to reduce the measured redshft because we preferentially see the side of the ejecta toward us. But these considerations do not explain the near constancy of the velocities with distance from the star and the lack of any additional shift in the apertures across arcs 1 and 2, which are quite red and dusty in the images.
The absorption line profiles along Slit V are also broadened compared to those on the star, although not as much as across the NW arc (see Figure 6). We compared the Gaussian smeared stellar profile with the observed profiles and obtained a range of results which varied with position along the slit. The reflected profiles from apertures 2 and 3 closest to the star, showed only marginal broadening with respect to the star, even though aperture 3 crosses the relatively bright dusty knot or condensation just south of the star. The smeared profiles that best matched those observed from aperture 4, which crosses several small arcs, have FWHM’s corresponding to 20 - 40 km s-1, and for apertures 5 through 7 across the outer filamentary arcs 1 and 2, the FWHM’s are 65 km s-1 . Although this is smaller than measured for the NW arc, it represents significant motions along the line of sight of 30 – 35 km s-1 for the material within these arcs, in contrast with the apparent lack of motion with respect to the star. Consequently, we would expect to see a redshift relative to the star of at least 10 km s-1 or so, especially across the arcs even with the above considerations for a reduced redshift. Instead, the motion relative to the star is at most 5 km s-1 assuming that the material along Slit V sees the same reflected and red-shifted spectrum of the star that we see, I Ap 2.
It is possible that at different positions in the nebula, we may be observing radiation that escaped from different regions on the star, perhaps through holes or gaps in the dusty envelope. Consequently, the gas and dust at these locations may be getting a different view or spectrum of the star. For example, if there is a NE-SW axis of symmetry with a bipolar flow, as has been suggested, then along Slit V we may be observing gas and dust that views the star from near the polar direction which would be less obscured if there is a disk or flattened dusty envelope around the star. If gas is escaping through a low density region in the dust envelope, then the reference velocity for the reflected absorption lines would more likely be closer to the systemic velocity than the red-shifted velocity observed at the star. If this is the case, the reflected material may be moving at 30 km s-1 relative to the star. This is just a hypothesis, but it might solve the problem of the zero-velocity gas and dust along Slit V. However, it would also require that along most of Slit V, we see the star from exactly the same direction or angle which then poses problems for the assumed geometry.
A person unfamiliar with the nature of VY CMa would conclude from the above description that a substantial amount of nearly stationary or very slow moving gas and dust exists in its ejecta. This is obviously a paradox given the star’s strong wind and probable mass loss history. At this time we have no satisfactory explanation. It is possible that the general flow of the diffuse gas in the extended circumstellar material is extremely slow, but the escape velocity for VY CMa is 60 km s-1 at its photosphere and 20 km s-1 at the dust formation radius at 100 A.U. Conceivably this material has been slowed by some process or it did not have quite the escape velocity and is now falling back. But there is no evident reason for this to happen, other than it would help solve our paradox.
5 The Evidence for Localized Mass Loss Events
The results of our high resolution spectroscopy demonstrate that the three primary arcs in the visual images of VY CMa are kinematically distinct from the surrounding stationary circumstellar material. The NW arc and arcs 1 and 2 have expansion speeds of 50 km s-1 to 40 km s-1, respectively. The gas and dust associated with these structures was thus ejected in specific mass loss episodes; 400 years ago for the NW arc and possibly 1000 to 800 years ago for arcs 1 and 2. For the “western arc” we found an expansion age of only slightly more than 200 years. Thus we have evidence for a period of considerable activity during the past 1000 years, including some recent ejections. In addition to the arcs, numerous clumps of small knots or condensations are observed in the images relatively close to the star. The dusty clumps to the south(S) and southwest(SW) of the star are the brightest, but several very small knots are observed just to the west and northwest of the star. These are clustered quite close, within 05 of the star, and must have been ejected quite recently, only 70 years years ago assuming an outflow speed of 50 km s-1.
With the possibility of ejection episodes this recently, there may be some hint of activity in the star’s observational record. Numerous ground-based observers in the past have often described the appearance of knots of nebulosity that come and go and may vary in position, but the timescales for the motions and variablility seem too short to be related to the expanding ejecta. (See Smith et al 2001 for a discussion and the references) These variations could be due to changing illumination of the dusty ejecta by radiation escaping from gaps or low density regions in the envelope (Wallerstein, 1978; Smith et al., 2001). VY CMa’s historical light curve (Robinson, 1971) shows some very intriguing variability. The most significant change is its decline from mv 6.5 mag. beginning in 1872 to 8 mag. by 1880 with some brief brightening episodes superposed. Whether this 1.5 mag decrease was due to a change in bolometric correction or to the formation of dust, is not known, but it may correspond to the appearance of several knots and small arcs about 100 to 200 years ago. The star apparently then slowly faded to about 8.5 – 9th magnitude, and although the record is spotty, it may have had periods of greater variability in the 1910’s and again in the 1930’s. The more modern record based on the AAVSO light curve and published photometry, shows that VY CMa displayed considerable variability of 1 to 2 magnitudes from about 1984 to 1995 with oscillations lasting several 100 to a thousand days that resemble the pulsations in irregular variables. Since then it has been relatively steady at about 8.5 mag.
The NW arc is the most clearly defined structure or mass concentration within the ejecta and is therefore the best candidate for a mass estimate. In our imaging paper, we estimated its total mass at M⊙ from the surface brightness in a well resolved 2 arcsec2 section. In this estimate we assumed an optical depth of unity. This assumption plus the evidence from the velocity gradient across the arc that more material may be participating in the outflow than is apparent in the images, suggests that this may be an underestimate for the arc’s total mass. The dynamical timescale for VY CMa is on the order of three years as are the episodes of large variability in its light curve. So whether the observed variability and the ejection events are due to non–radial pulsations or large scale convection and activity on the star, the timescales will be comparable. Therefore the short term mass loss rate associated with the ejection of the NW arc was at least 10-3 M⊙ per year. The corresponding kinetic energy of the NW arc is 1044 ergs which is not unrealistic for a star like VY CMa with a total energy output of 6 ergs per year.
Given the evidence we have for a relatively stationary nebula, most of VY CMa’s mass loss may be occurring in these separate high mass loss events perhaps due to activity on its surface. If we associate the ejections and surface activity with VY CMa’s photometric variability then they may occur approximately every 50 years or so. The NW arc may be an especially massive outflow, but if we assume 10-3 M⊙ per ejection, then over a thousand years the mass loss rate would average M⊙ per year which is close to what we estimated in Smith et al (2001) for the entire circumstellar nebula and to previous independent mass loss measurements (Danchi et al., 1994).
The random orientations of the three primary arcs relative to the star together with their different ages, suggest that they were ejected not only at different times, but by localized events or disturbances at different positions on the star. Our results show that the NW arc is moving primarily across our line of sight with little projection with respect to the plane of the sky. VY CMa’s geometry is unknown, but if we assume the NE-SW rotation/symmetry axis from the maser model, then the NW arc is very likely within 10 to 15 of the expected equatorial plane. Given the relative positions of arcs 1 and 2 within the nebula and with respect to the presumed axis, each has likely been ejected from different locations on the star, at higher latitudes relative to the NW arc, and possibly from the polar region, but that depends on the unknown projection angle.
One of the uncertainties in the above discussion is our lack of information on the transverse motions of the ejecta and the geometry of the nebula. We will soon be obtaining second epoch images and imaging polarimetry of VY CMa with HST to measure its expansion and map the morphology and relative distribution of the embedded structures.
6 Concluding Remarks On the Nature of VY CMa
Our observations confirm that VY CMa has experienced several mass loss events, presumably from localized active regions. These clouds or loops of gas and dust are now expanding outward into what appears to be a surrounding nebula of surprisingly stationary gas and dust. This stationary or slow moving material material is difficult to explain around a star that has had a long history of high mass loss. We can only speculate that the more diffuse, uniformly distributed gas has been created by a continuous, but slow general outflow of material from the overall surface. It therefore seems likely that the high mass loss for rate for VY CMa is really a measure of the mass carried out by these specific ejections perhaps accompanied by streams or flows of emitting gas through holes or gaps in the dust envelope.
VY CMa is the only M–type supergiant known to have a large, visible reflection nebula. Schuster & Humphreys (2005) have obtained HST/WFPC2 images of several cool hypergiant stars including the OH/IR M supergiants NML Cyg, S Per and VX Sgr to search for associated nebulosity. The results are basically negative or yield only marginal detections, except for NML Cyg which has a small bean-shaped nebula that has probably been shaped by the strong ionizing winds from the nearby hot stars in the Cygnus X complex (Morris & Jura, 1983). In many ways VY CMa is most like IRC +10420, another high mass–loss, strong OH/IR source believed to be in a post–red supergiant stage and with a complex circumstellar environment (Jones et al, 1993; Humphreys et al., 1997). Its extended reflection nebula has a variety of structures including knots and condensations, ray-like features and numerous arcs and scalloped loops which in the outer parts closely resemble the arcs observed in VY CMa’s ejecta. Spectroscopy of its ejecta though showed a uniformly expanding outflow of gas (Humphreys et al., 2002); there was no evidence for stationary gas or dust in its ejecta.
The referee has suggested that the slow moving gas is due to gravitationally bound material in circular orbits (Jura and Kahane 1999). This may be the case but the examples of orbiting material about evolved stars come from a very different class of objects; carbon-rich red giants and post AGB stars which are binaries or presumed binaries (Jura, Bahm, and Kahane 1995, Bujarrabel et al. 2003) with “reservoirs” of long – lasting molecular material. At the distances where the motionless K I emission is observed (4000 - 10000 AU from the star), the orbital period will be several hundred thousand to a million years, exceeding the expected duration of the red supergiant stage for a star this luminous. Furthermore, the OH and H2O maser observations show that the clouds are expanding at 30 – 40 km s-1, greater than the expected escape velocity from the dust shell. Therefore we think this explanation is less likely for VY CMa if it is an evolved red supergiant.
VY CMa is a very perplexing star experiencing discrete mass loss episodes that may be the primary mechanism by which it is losing so much mass. We have also uncovered some puzzling questions about the origin of its extended diffuse nebula with the slow moving gas and dust. If it is an evolved massive star, it is apparently in a unique stage, with no obvious counterparts. Alternatively, the apparently “stationary” ejecta with embedded streams of gas and massive outflows is also consistent with a pre-main sequence state for VY CMa.
Appendix A Paradoxical K I 7699 emission
The K I emission line is difficult to assess, because this atom has an extremely small ionization potential (4.34 eV) and because some critical parameters are inaccessible for VY CMa. Since K I 7665,7699 is a low-excitation resonance doublet, one is tempted to think “it’s merely resonance scattering” – which, however, does not answer the most important questions. Note, for instance, the strength of 7699 emission relative to the continuum when we look directly toward the star, position I Ap 2 in Fig. 3. In order to achieve the observed equivalent width of 5 Å in emission simply by resonance scattering, a substantial amount of radiation must be removed from the continuum along some (indeed most) lines of sight. On average, resonance scattering in itself neither augments nor diminishes the net emergent flux of 7699 photons, excepting the small fraction that are scattered back into the photosphere. However, there is no hint of sufficient “absorption” to balance the observed “emission” anywhere along our slit positions, including reflected spectra that represent the star as seen from various directions in space. Other puzzles involve the apparent velocity and the line profiles seen in the extended halo, §4.2 above.
As a preliminary detail, note the optical thickness for K I 7699. (7665 has a larger oscillator strength but is not included in our data.) Assuming a normal potassium abundance and a local line width of 4 km s-1, the line-center opacity is cm2 g-1. At least in the dusty zones, compare this to the continuum opacity for scattering by dust grains, cm2 g-1 at the same wavelength. If K I resonance scattering is to be at least comparable to reflection by dust, we require , i.e., . Given potassium’s low ionization potential, this is a stronger constraint than one might guess at first sight.
A.1 Potassium in the inner wind
Can K I emission arise within AU, before dust has formed? First consider the ionization ratio, which, in a simple model, depends on the star’s photon supply at energies above 4.3 eV and on the electron density in the wind. Suppose that free electrons are provided by the elements with low ionization potentials, giving . At AU, for example, in a simple model we expect cm-3. If the continuum spectrum of VY CMa were a 3000 K Planckian, then it would produce about 1046 potassium-ionizing photons per second; but this is embarrassingly sensitive to temperature and other parameters, and the star’s UV brightness may considerably exceed a simple black-body value (compare Ori, Glassgold & Huggins 1986). Anyway, using reasonable estimates of the photoionization cross-section and recombination coefficient, the values quoted above imply
which applies throughout the inner wind, 12 AU 100 AU. This ratio would be decreased by any additional supply of free electrons, e.g., by some process that can ionize a tiny fraction of the hydrogen and/or an appreciable fraction of carbon; but it is difficult to reduce the K+/K0 ratio by a factor much smaller than 0.2 in this way. Most other likely complications tend to increase the ionization ratio, see Glassgold & Huggins (1986). Altogether, at this level of reasoning, one expects the line-center opacity in the inner wind to be rather small for a resonance line, cm2 g-1 . The total line-center optical depth along a radial path may exceed 10, but if so the effect on the total emergent spectrum is merely a fractional-Å wavelength redistribution of photons near 7699 Å – i.e., quite different from the observed strong emission feature which is not accompanied by a comparable amount of absorption at nearby wavelengths.
If there are large-scale inhomogeneities in the local scattering coefficient , the emergent spectrum can depend on viewing direction; a net surplus of 7699 Å photons may escape in some directions at the cost of a net deficit elsewhere. In order to obtain the observed strong feature in this way, however, one must view the star from a statistically unusual direction. A fundamentally non-spherical model in this vein – for instance, imagine a circumstellar torus seen from a near-axis viewpoint – is difficult to construct for the following reason: In order to obtain the large observed ratio (7699 peak height)/(continuum level) 5, the solid angle of “resonance photon escape” directions must be far smaller than that of the “opaque” directions. (Admittedly this may be the case south of the star, along Slit V.) In summary, this general type of scenario cannot be rejected outright but we hope to find alternatives that are quantitatively more plausible.
Can the observed K I emission be excited by collisional processes in the inner wind? In such a model the required luminosity in the 7699 line is of the order of 150 or erg s-1. Electron collisions are rather ineffective because is insufficient. If the inner-wind temperature is, say, 4000 K, and we adopt the relative electron density mentioned above, then collisional excitation of K I 7665,7699 proves too weak by a factor of , i.e., by 5 to 9 orders of magnitude. Radiative recombination is too weak by about 8 orders of magnitude. Unusual effects such as collisional excitation by fast non-thermal electrons, collisional excitation by hydrogen atoms, etc., are likewise unpromising, though we omit details here.
Should we consider fluorescence, radiative excitation to higher levels of K I? The upper level for 7665,7699 is 4p 2Po, and the next resonance level, 5p 2Po, can be excited from the ground level by photons near 4044 Å. An ensuing cascade, 5p (3d or 5s) 4p, would lead to 7699 emission. Since the photosphere of VY CMa is relatively faint at violet wavelengths, this process seems worthwhile only if it is pumped by some other strong emission line near 4044 Å. So far as we know, there is no likely candidate for this role, nor for pumping K I levels above 5p.
In summary, we can almost eliminate all the obvious excitation processes other than resonance scattering, and even the latter does not seem promising in the inner wind. Therefore let us focus on resonance scattering farther out, AU, where inhomogeneous dust may help to solve the puzzle.
A.2 K I 7699 in zones where dust has recently formed
Once dust has begun to form near AU in the outward mass flow, the K+/K0 ionization ratio becomes even more difficult to predict. The UV flux is greatly reduced by even a small column density of dust, while, on the other hand, some ion species that help provide become depleted. Meanwhile the recombination time is several years, long enough for the gas to move a distance comparable to . Since the data indicate that the K I column density is indeed substantial in dust farther out, let us assume that cm2 g-1, i.e., at least comparable to scattering by dust, in the inner parts of the dusty region. This assumption is questionable but it is not implausible.
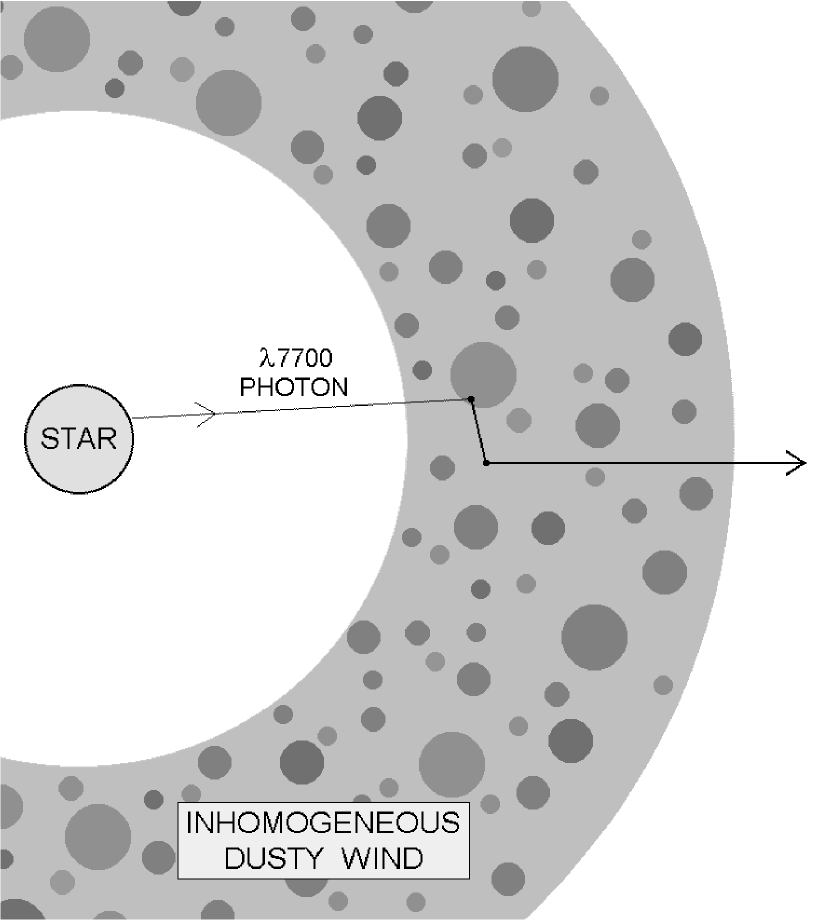
Figure 14 shows, in an idealized way, how resonance scattering
can result in a net emission line if large-scale dusty condensations
are present. Suppose, for the sake of illustration, that –
Each localized dense blob in the figure contains enough
dust to be practically opaque at all relevant wavelengths;
Most photons from the star encounter such an obstacle;
Along some escape paths – not necessarily straight –
the optical thickness of the lower-density medium is less than 3;
The parameters allow about one or two percent of the
red-wavelength continuum radiation to escape, as observed for VY CMa.
Often the escape process involves an encounter with one of the dense
blobs, scattering by a dust grain, and perhaps further scattering
in the less-dense medium. The average dust-grain albedo is obviously
relevant.
In Fig. 14, a 7699 Å photon from the star encounters a dusty
condensation, is resonance-scattered by a potassium atom, and then escapes after
one more scattering event which may be due to either a K I atom or
a dust grain. This type of behavior, averaged over all photons,
leads to an apparent emission line in the emergent spectrum.
There are at least two equivalent ways to see why:
(1) Temporarily imagine, for simplicity, that the dust absorbs but does
not reflect radiation. In that case, if the photon in Fig. 14 had not
been scattered by K I, then it would have been absorbed by dust in
the dense condensation.. This answers a question we asked above,
namely, why does the observed spectrum not show K I 7699
absorption lines to balance the
apparent emission? The answer is that most 7699 scattering
events occur in locations where the continuum radiation would not
otherwise escape anyway, being absorbed by dust if it isn’t scattered
by K I.
(2) Of course, real dust grains reflect radiation as well as absorbing
it. In effect, resonance scattering by K I enhances the overall albedo
at a wavelength of 7699 Å. In other words, resonance scattering
provides an extra way for 7699 Å photons to escape from a dusty
condensation. Once they escape into a less-dense channel, they
have an appreciable probability of escaping from the configuration.
(Moreover, K I scattering may be weak in the low-density regions,
so it does not necessarily impede the final escape process.)
The main point is that the K I emission line may be “formed” by an indirect process at radii beyond 100 AU or so. Our observations indicate that expansion of the dusty medium does not red-shift the emergent K I emission line as much as it does the stellar absorption spectrum (see §3); but a quantitative model is necessary to judge whether this is to be expected. Unfortunately, a model of this type has many adjustable parameters and probably requires Monte-Carlo-style radiative transfer calculations, far beyond the scope of this paper.
Similar reasoning can probably be applied to the Ca I] emission. However, as we noted in §4, the existence of Ca I] in both emission and absorption seems to require an oscillator strength far larger than one would expect for a semi-forbidden transition. If this statement is wrong due to some geometrical or radiative-transfer fallacy, we have not been able to identify the error.
References
- Bernat & Lambert (1976) Bernat, A. P. & Lambert, D. L. 1976, ApJ, 210, 395
- Bowers, Johnston, & Spencer (1983) Bowers, P. F., Johnston, K. J., & Spencer, J. H. 1983, ApJ, 274, 733
- Bujarrabel et al. (2003) Bujarrabel, V., Neri, R., Alcolea, J. & Kahane, C. 2003, A&A, 409, 573
- Danchi et al. (1994) Danchi, W.C., Bester, M., Degiacomi, C.G., Greenhill, L.J., & Townes, C.H. 1994, AJ, 107, 1469
- de Jager (1998) de Jager, C. 1998, A&A Rev., 8, 145
- Dupree, Lobel & Gilliland (1999) Dupree, A.K., Lobel, A. & Gilliland, R.L. 1999, BAAS, 194, 6605
- (7) Efstathiou, A. & Rowan-Robinson, M. 1990, MNRAS, 245, 275.
- Gilliland & Dupree (1996) Gilliland, R.L. & Dupree, A.K. 1996, ApJ, 463, L29
- Glassgold & Huggins (1986) Glassgold, A. E. & Huggins, P. J. 1986, ApJ, 306, 605
- Guilain & Mauron (1996) Guilain, G. & Mauron, N. 1996, A&A, 314, 585
- (11) Herbig, G.H. 1970a, Mem. Soc. Roy. Liege, 19, 13
- (12) Herbig, G.H. 1970b, ApJ, 162, 557
- Herbig (1972) Herbig, G.H. 1972, ApJ, 172, 375
- Herbig (1974) Herbig, G.H. 1974, ApJ, 188, 533
- Humphreys (1970) Humphreys, R. M. 1970, PASP, 82, 1158
- Humphreys (1975) Humphreys, R. M. 1975, PASP, 87, 433
- Humphreys & Davidson (1994) Humphreys, R.M. & Davidson, K. 1994, PASP, 106, 1025
- Humphreys et al. (1997) Humphreys, R.M., et al. 1997, AJ, 114, 2778
- Humphreys et al. (2002) Humphreys, R.M., Davidson, K., & Smith, N. 2002, AJ, 124, 1026
- Hyland et al. (1969) Hyland, A.R., Becklin, E.E., Neugebauer, G. & Wallerstein, G. 1969, ApJ, 15 8, 619
- Jones et al (1993) Jones, T. J. et al. 1993, ApJ, 411, 323
- Jura & Kahane (1999) Jura, M. & Kahane, C. 1999, ApJ, 521, 302
- Jura, Balm, & Kahane (1995) Jura, M., Balm, S. P. & Kahane, C. 1995, ApJ, 453, 721
- Kluckers et al. (1997) Kluckers, V.A., Edmunds, M.G., Morris, R.H. & Wooder, N. 1997, MNRAS, 284, 711
- Lada & Reid (1978) Lada, C.J. & Reid, M.J. 1978, ApJ, 219, 95
- Lobel & Dupree (2000) Lobel, A. & Dupree, A. K. 2000, ApJ, 545, 454
- Lobel & Dupree (2001) Lobel, A. & Dupree, A. K. 2001, ApJ, 558, 815
- Marvel (1997) Marvel, K.B. 1997, PASP, 109, 1286
- Monnier et al. (1999) Monnier, J.D., Tuthill, P.G., Lopez, B., Cruzalebes, P., Danchi, W.C., & Haniff, C.A. 1999, ApJ, 512, 351
- Morris & Bowers (1980) Morris, M. & Bowers, P. F., 1980, AJ, 85, 724
- Morris & Jura (1983) Morris, M. & Jura, M. 1983, ApJ, 267, 179
- Nercessian et al. (1989) Nercessian, E., Guilloteau, S., Omont, A. & Benayoun, J. J. 1989, A&A, 210, 225
- Richards, Yates & Cohen (1998) Richards, A. M. S., Yates, J. A., & Cohen, R. J. 1998, MNRAS, 299, 319
- Robinson (1971) Robinson, L. J. 1971, IBVS, 599
- Schaller et al. (1992) Schaller, G., Schaerer, D., Meynet, G. & Maeder, A. 1992, A&AS, 96, 269
- Schaerer et al. (1993) Schaerer, D., Meynet, G., Maeder, A. & Schaller, G. 1993, A&AS, 98, 523
- Schuster & Humphreys (2005) Schuster, M. T. & Humphreys, R. M. 2005, in preparation
- Smith (2004) Smith, N. 2004, MNRAS,
- Smith et al. (2001) Smith, N., Humphreys, R. M., Davidson, K., Gehrz, R. D., and Schuster, M. T. & Krautter, J. 2001, AJ, 121, 1111
- Uitenbroek, Dupree & Gilliland (1998) Uitenbroek, H., Dupree, A.K., & Gilliland, R.L., 1998, AJ, 116, 2501
- Wallerstein (1958) Wallerstein, G. 1958, PASP, 70, 479
- Wallerstein (1971) Wallerstein, G. 1971, ApJ, 169, 195
- Wallerstein (1977) Wallerstein, G. 1977, ApJ, 211, 170
- Wallerstein (1978) Wallerstein, G. 1978, Observatory, 98, 224
- Wallerstein (1986) Wallerstein, G. 1986, A&AS, 164, 101
- Wallerstein (2001) Wallerstein, G. & Gonzalez, G. 2001, PASP, 113, 954
- Wittkowski et al. (1998) Wittkowski, M., Langer, N. & Weigelt, G. 1998, A&A., 340, L39
| Slit PositionaaSee Figure 1 | Exposure Times |
|---|---|
| I | 60s, 120s |
| II | 4 600s |
| III | 60s, 3 600s |
| V | 60s, 5 600s |
| Slit | ApertureaaExcept where noted the apertures are 10 06. | Position Along Slit | Radial Distance | Position Angle |
|---|---|---|---|---|
| from point nearest star | from Star | from Star | ||
| in arc seconds | in arc seconds | in degrees | ||
| I | 1 | 1.40 | 1.40 | 122 |
| 2bbThe position of the star. | N.A. | 0.00 | 0 | |
| 3 | 1.75 | 1.75 | -58 | |
| 4 | 3.50ccNW arc | 3.50 | -58 | |
| 5 | 5.00 | 5.00 | -58 | |
| 6 | 6.50 | 6.50 | -58 | |
| 7 | 8.00 | 8.00 | -58 | |
| 8 | 9.50 | 9.50 | -58 | |
| II | 1 | -2.80 | 3.23 | 145 |
| 2 | -1.40 | 2.02 | 161 | |
| 3 | 0.00 | 1.28 | -156 | |
| 4 | 1.40 | 1.77 | -104 | |
| 5 | 2.80ccNW arc | 2.93 | -84 | |
| 6 | 4.20 | 4.23 | -76 | |
| 7 | 5.60 | 5.58 | -71 | |
| 8 | 7.00 | 6.95 | -69 | |
| 9 | 8.40 | 8.34 | -67 | |
| III | 1ddS condensation | -0.60 | 1.21 | 178 |
| 2eeSW condensation | 0.60 | 1.12 | -121 | |
| 3ff | 1.60 | 1.81 | -91 | |
| 4 | 3.00ccNW arc | 3.13 | -76 | |
| 5 | 4.50 | 4.48 | -71 | |
| 6 | 5.90 | 5.58 | -68 | |
| 7 | 7.30 | 7.23 | -66 | |
| 8 | 8.70 | 8.62 | -65 | |
| V | 1 | -2.10 | 2.28 | 54 |
| 2 | -0.70 | 0.28 | 18 | |
| 3 | 0.70 | 0.81 | 177 | |
| 4 | 2.10 | 2.07 | -155 | |
| 5 | 3.50ggabsorption may be marginally present; partially covered by emission | 3.44 | -149 | |
| 6 | 4.90 | 4.82 | -147 | |
| 7 | 6.30hhfootnotemark: | 6.22 | -145 | |
| 8 | 7.70 | 7.61 | -144 | |
| 9 | 8.10 | 9.01 | -143 |
Arc 2 hhfootnotemark: Arc 1
| Line | Velocity km s-1 | Previous Velocities - Mean | and Range |
|---|---|---|---|
| km s-1 | km s-1 | km s-1 | |
| K I emission | 41.0 | 51.0 | 40 – 58 |
| K I P Cyg absorption | 7.8 | 6 | 5 – 7 |
| Ca I emission | 41.9 | 49.2 | 36 – 51 |
| Rb I emission | 44.0 | ||
| Absorption lines (9)aaCa II, Fe I, Ti I | 59.9 | 67.5 | 37 – 83 |
References. — Wallerstein 1958, Hyland et al. 1969, Wallerstein 1971, Humphreys 1970, Humphreys 1975, Wallerstein 1977, Wallerstein & Gonzalez 2001
| Aperture | Slit I em | P Cyg Abs. | Slit II em | P Cyg abs. | Slit III em | P Cyg abs |
|---|---|---|---|---|---|---|
| km s-1 | km s-1 | km s-1 | km s-1 | km s-1 | km s-1 | |
| K I emission and P Cyg absorption | ||||||
| 1 | 31.6, 40.2 | 6.7 | 16.8, 29.3 | 25.4, 60.4 | 6.3 | |
| 2 | 41.0 | 7.8 | 25.0 | 6.3 | 27.3, 44.5 | 8.2 |
| 3 | 23.4, 45.6, 52.6 | 10.2 | 25.8, 42.5 | 6.3 | 26.9, 41.7 | 8.2 |
| 4 | 30.8, 56.5 | 10.2 | 42.1 | 8.2 | 34.3, 60.4 | 13.3 |
| 5 | 33.9 | 33.9, 59.7 | 12.9 | 35.0, 70.0 | 12.0 | |
| 6 | 35.1 | 34.3, 67.8 | 12.5 | 34.0, 41.0 | ||
| 7 | 38.6 | 33.5, 41.0 | 36.0 | |||
| 8 | 35.1 | 34.7, 41.0 | 32, 39 | |||
| 9 | 32.0 | |||||
| Ca I emission and P Cyg absorption | ||||||
| 1 | 41.5 | 42.9 | 24.6 | 13.2, 40.1 | ||
| 2 | 41.9 | 41.9 | 31.0 | 39.7 | ||
| 3 | 41.0 | 41.0 | 41.0 | |||
| 4 | 40.6 | 38.8 | ||||
| 5 | 41.5 | 39 | ||||
| 6 | 41 | |||||
| 7 | 42 | |||||
| H emission | ||||||
| 1 | -14aabroad emission | 34.0 | -8.1 | |||
| 2 | bbvery weak, broad emission | -7.6 | -5.3 | |||
| 3 | 10 ccbroad emission | -4.4 | ||||
| 4 | 8.4 | 34.0 | ||||
| 5 | 35.3 | 36 | ||||
| 6 | 37 | 34.0 | 36 | |||
| 7 | 37 | 37.2 | 36 | |||
| 8 | 37 | 38.5 | 36 | |||
| 9 | 37.6 | |||||
| Aperture | Slit I | n lines | Slit II | n lines | Slit III | n lines | Slit V | n lines |
|---|---|---|---|---|---|---|---|---|
| km s-1 | km s-1 | km s-1 | km s-1 | |||||
| Ca II, Fe I, Ti I (8400 – 8800) | ||||||||
| 1 | 63.2 | 9 | 63.2 | 9 | 69.8 | 8 | 62.6 | 9 |
| 2 | 59.9 | 9 | 69.0 | 8 | 75.9 | 8 | 59.3 | 9 |
| 3 | 76.7aaFour of the lines are double. 76.7 km s-1 is the mean velocity of the four single lines and the blues-hifted component of the double lines. The red-shifted component has a mean velocity of 110.1 km s-1 | 8 | 73.6 | 8 | 107.9bbSeveral of the lines in the aperture are obviously asymmetric with a hint of a blue-shifted second component. We were able to measure a velocity of 75.6 km s-1 for this feature in three of the lines. The mean velocity given here is for the single lines and the absorption minimum of the asymmetric lines. | 5 | 64.7 | 9 |
| 4 | 100.4 | 8 | 101.8ccA few lines are asymmetric with a slight extension to the blue. The mean velocity is for the single lines. | 4 | 116.0 | 8 | 64.4 | 8 |
| 5 | 76.7 | 5 | 113.6 | 8 | 102.3ddThree of the lines are asymmetric to the red. The mean velocity is for the single lines plus the absorption minimum of the asymmetric lines. | 7 | 64.6 | 8 |
| 6 | 68.1 | 3 | 107.4eeTwo of the lines are asymmetric to the red. The mean velocity is for the single lines. | 6 | 82.4 | 8 | 64.8 | 8 |
| 7 | 58.5 | 2 | 85.9 | 7 | 78.0 | 6 | 62.7 | 8 |
| 8 | 56.5 | 1 | 78.9 | 6 | 81.3 | 3 | 64.2 | 4 |
| 9 | 83.9 | 3 | 59.5 | 3 | ||||
| Ca I | ||||||||
| 1 | ffAperture is 08 06. | 63.4 | 57.5 | |||||
| 2 | ggabsorption may be marginally present; partially covered by emission | 58.8 | 85.3 | 64.8 | ||||
| 3 | 89.9 | 84.4 | 93.1 | 57.9 | ||||
| 4 | 103.1 | 92.6 | 92.6 | 59.7 | ||||
| 5 | 80.8 | 91.2 | 99.0 | 62.9 | ||||
| 6 | 89.0 | 81.0 | 68.9 | |||||
| 7 | 79.8 | 64.8 | ||||||
| 8 | 76.2 | |||||||
| K I | ||||||||
| 1 | 92.0 | |||||||
| 2 | 88.1 | |||||||
| 3 | 89.7 | 86.5 | ||||||
| 4 | 86.9 | 89.7 | 84.6 | |||||
| 5 | 84.6 | 87.0 | ||||||
| 6 | 84.6 | |||||||
| H | ||||||||
| 1 | 48, 74 | 76 | 73.7 | 92.0 | ||||
| 2 | 48 | 73 | 86.5 | 71.9 | ||||
| 3 | 114 | 76 | 121.7 | 73.7 | ||||
| 4 | 132 | 118 | 118.1 | 68.2 | ||||
| 5 | 117 | 126 | 79.7 | |||||
| 6 | 119 | 109 | 77.8 | |||||
| 7 | 111 | 68.7 | ||||||
| Aperture | K I | P Cyg | Ca I | P Cyg | H |
|---|---|---|---|---|---|
| km s-1 | km s-1 | km s-1 | km s-1 | km s-1 | |
| 1 | 43.3 | 4.3 | 41.9 | 20.0 | -42.8, -2.1, 31.7 |
| 2 | 37.1 | 6.3 | 41.9 | 20.5 | -3.5, 30.3 |
| 3 | 24.1, 60.4 | 6.7 | 40.6 | -3.5 | |
| 4 | 28.1, 52.6, 67.1 | 7.8 | -14.5 | ||
| 5 | (8.6)aaVelocity of the small bump on the blue side of the line profile.,21.9, 65.5 | 41.5 | |||
| 6 | 8.6, 42.5, 56.2 | 40.6 | 35.3 | ||
| 7 | 3.9 | 38.3 | 34.9 | ||
| 8 | (3.9)bbA rather broad feature is weakly present at this velocity for its “peak” emission., 39.0 | 35.8 | |||
| 9 | 40.2 | 37.6 |