11email: paj,nss,je,smp@astro.livjm.ac.uk 22institutetext: Department of Physics, Astronomy & Mathematics, University of Hertfordshire, Hatfield, Hertfordshire, AL10 9AB, UK
22email: knapen@star.herts.ac.uk
The H Galaxy Survey ††thanks: Based on observations made with the William Herschel and Jacobus Kapteyn Telescopes operated on the island of La Palma by the Isaac Newton Group in the Spanish Observatorio del Roque de los Muchachos of the Instituto de Astrofísica de Canarias. The United Kingdom Infrared Telescope is operated by the Joint Astronomy Centre on behalf of the U.K. Particle Physics and Astronomy Research Council.
We study the two main corrections generally applied to narrow-band H fluxes from galaxies in order to convert them to star formation rates, namely for [Nii] contamination and for extinction internal to the galaxy. From an imaging study using carefully chosen narrow-band filters, we find the [Nii] and H emission to be differently distributed. Nuclear measurements are likely to overestimate the contribution of [Nii] to total narrow-band fluxes. We find that in most star formation regions in galaxy disks the [Nii] fraction is small or negligible, whereas some galaxies display a diffuse central component which can be dominated by [Nii] emission. We compare these results with related studies in the literature, and consider astrophysical explanations for variations in the [Nii]/H ratio, including metallicity variations and different excitation mechanisms.
We proceed to estimate the extinction towards star formation regions in spiral galaxies, firstly using Br/H line ratios. We find that extinction values are larger in galaxy nuclei than in disks, that disk extinction values are similar to those derived from optical emission-line studies in the literature, and that there is no evidence for heavily dust-embedded regions emerging in the near-IR, which would be invisible at H. The numbers of galaxies and individual regions detected in Br are small, however, and we thus exploit optical emission line data from the literature to derive global H extinction values as a function of galaxy type and inclination. In this part of our study we find only a moderate dependence on inclination, consistent with broad-band photometric studies, and a large scatter from galaxy to galaxy. Typical extinctions are smaller for late-type dwarfs than for spiral types. Finally, we show that the application of the type-dependent extinction corrections derived here significantly improves the agreement between star formation rates calculated using H fluxes and those from far-infrared fluxes as measured by IRAS. This again supports the idea that heavily dust-embedded star formation, which would be underestimated using the H technique, is not a dominant contributor to the total star formation rate of most galaxies in the local Universe.
Key Words.:
galaxies: general, galaxies: spiral, galaxies: irregular, galaxies: fundamental parameters, galaxies:photometry, galaxies: statistics1 Introduction
The H luminosity observed in spiral and irregular galaxies is believed to be a direct tracer of the ionisation of the inter-stellar medium (ISM) by the ultraviolet (UV) radiation which is produced by young high-mass OB stars. Since only high-mass (10 M⊙) and, therefore, short-lived (20 Myr) stars contribute significantly to the integrated ionising flux, the H emission line thus provides a nearly instantaneous measure of the star formation rate (SFR), independent of the previous star formation history. The two main advantages of using H to detect star formation are the direct relationship between the nebular line emission and the massive SFR, and also the high sensitivity. A small telescope can map star formation down to low levels at high angular resolution, even in faint, low surface-brightness galaxies.
The H Galaxy Survey (HGS) is a study of the star formation properties of a representative sample of galaxies in the local Universe using this technique. We have imaged 334 nearby galaxies in both the H line and the -band continuum. The sample consists of all Hubble types from S0/a to Im with recession velocities between 0 and 3000 km s-1. All galaxies were observed with the, now unfortunately decommissioned, 1.0 metre Jacobus Kapteyn Telescope (JKT), part of the Isaac Newton Group of Telescopes (ING) situated on La Palma in the Canary Islands. The selection and the observation of the sample are discussed in James et al. (2004), hereafter Paper I. A key element of this project is to extend the study to fainter galaxies than has been done in previous large surveys.
The two major limitations of narrow-band H imaging are contamination by the [Nii] line doublet, and uncertainties in the extinction corrections to be applied to each galaxy. In this paper we will investigate refinements to the corrections applied by previous authors. The HGS sample contains more faint, dwarf galaxies than most previous studies, and thus we aim to derive corrections applicable to both these objects, and the brighter spiral galaxies.
The [Nii] lines are located either side of the 6563Å H line, at 6548Å and 6583Å and will be referred to as [Nii]-6548 and [Nii]-6583 in this paper. The widths of the narrow-band H filters range from 44Å to 55Å thus including both [Nii] lines - as do almost all narrow-band H observations of galaxies. The [Nii]-6548 line is weaker than the [Nii]-6583 line, with [Nii]-6583/[Nii]-6548 3. The contribution to the total flux for both lines together ([Nii]-total henceforth) causes a scatter when using H measurements to infer SFRs. In order to improve calculations of SFRs it is therefore important to be able to correct for the [Nii] contamination.
Whilst the ratio of [Nii] to H in the nuclei of spiral galaxies has been well studied (e.g., Keel 1983; Rubin & Ford 1986) and found to be high (often greater than 1), Kennicutt & Kent (1983) find that nuclear [Nii] emission rarely dominates the integrated photometry of galaxies and hence global corrections for [Nii] contamination are much smaller. The most commonly used corrections for entire galaxies are those derived by Kennicutt (1983) and Kennicutt & Kent (1983). Spectrophotometric [Nii]/H ratios of individual extragalactic Hii regions from the literature (see Kennicutt & Kent 1983 and references therein) were compiled from 14 spiral galaxies (mostly of type Sc) and 7 irregular galaxies. The average H/(H + [Nii]-total) ratio was found to be fairly constant, spanning the ranges 0.75 0.12 for the spirals, and 0.93 0.05 for the irregulars (Kennicutt 1983). In terms of the ratio [Nii]-total/H this corresponds to a median value of 0.33 for spirals and 0.08 for irregulars. These values were calculated by finding the [Nii]-total/H ratio of the brightest Hii regions, averaging for each galaxy and then determining the mean value for spiral and irregular types. This implicitly assumes that all Hii regions have the same proportion of [Nii]-total to H emission as those regions measured. However, the integrated galaxy spectroscopy presented by Kennicutt (1992) shows generally stronger [Nii] emission than the earlier studies. Mean values of [Nii]-6583/H are 0.75 (st. dev 0.55) for types Sa–Sbc, 0.36(0.16) for types Sc–Sm, and 0.15(0.11) for Im galaxies (omitting the, probably misclassified, galaxy IC 883 from the Im sample). Including the [Nii]-6548 emission would make the discrepancy larger; however, these ratios were taken from deblended spectra as the H and [Nii] lines were only marginally resolved.
Similarly, McQuade et al. (1995) find high mean [Nii]-total/H ratios, of 0.6060.432 for 3 normal spirals, 0.9091.34 for 12 barred spirals and 0.8380.431 for 5 Type 2 Seyfert galaxies. The 3 blue compact dwarf galaxies in their sample have a much lower mean [Nii]-total/H ratio, 0.1040.018, and 3 blue compact galaxies have an intermediate mean ratio, 0.2760.036. The one LINER in their sample has very strong [Nii] emission, with [Nii]-total/H 3.627. These ratios are derived from circular apertures of 13.5 arcsec diameter, thus sampling only the central regions of most of these galaxies.
Jansen et al. (2000) use integrated spectra of 196 nearby galaxies to show that the principal determinant of [Nii]/H ratio is galaxy luminosity rather than type. In their study, the [Nii]/H ratios for galaxies brighter than -19.5 are in agreement with the values found by Kennicutt (1992), but fainter than this a striking trend is seen towards much lower values of this ratio. These fainter galaxies are dominated in the Jansen et al. (2000) sample by late-type Sd–Im galaxies, but interestingly the same trend is clearly seen for earlier type spirals. At -16, [Nii]/H ratios of 0.1 are typical. A similar trend in log([Nii]-total/H ) vs galaxy luminosity is found by Gavazzi et al. (2004).
In this paper, a new method of investigating the relative strengths of H and [Nii] is introduced and explored. This method will enable both the integrated ratio over the whole galaxy and the ratios of individual regions to be calculated. Particular attention will be paid to radial variations in the [Nii]-total/H ratio, both for the practical reason that many literature determinations of this ratio have been based on measurements of the central regions of galaxies, and because there are theoretical reasons to expect significant variation with radius, due to metallicity changes and different excitation processes.
The major source of systematic error in the conversion of H fluxes to SFRs is due to the effects of extinction within the galaxy being observed. There is a great deal of uncertainty as to the exact magnitude of this extinction and how it varies with galaxy luminosity and type. Studies using radio data (which are not affected by extinction) of large samples of individual Hii regions in nearby galaxies yield mean extinction values ranging from A(H) = 0.5 mag to A(H) = 1.8 mag (e.g. Caplan & Deharveng 1986; Kaufman et al. 1987; van der Hulst et al. 1988; Caplan et al. 1996; Niklas et al. 1997). Kennicutt (1998) adopts a single correction of 1.1 mag for the effective H extinction of entire galaxies for all Hubble types. These samples, however, mainly contain bright galaxies, whereas the HGS also includes many faint and irregular galaxies. For very small irregular galaxies, extinction may be systematically lower due to the smaller quantity of ISM which the H flux must traverse. Alternatively, most of the extinction could be associated with the star forming region itself, in which case galaxy type and size will be of lesser importance. In this paper we will determine the extinction towards known star formation regions, and search for highly embedded star formation which may not be apparent through optical observations, using 3 techniques. The first will present new Br imaging data for galaxies in our sample, and use the Br/H ratio to estimate extinction towards individual Hii regions in these galaxies. The number of galaxies detected in the Br line is small, however, so a further investigation is presented making use of literature H and H line fluxes for a large sample of spiral galaxies. This sample enables type-dependent extinction corrections to be derived and the inclination dependence of extinction to be investigated. Finally, a statistical analysis is made of star formation rates for galaxies in the present sample, using both optical H fluxes and far-IR fluxes from the IRAS survey. This provides a test of the type-dependent extinction corrections derived here, and enables a further search for heavily dust-embedded star formation which may be missed by optical or even near-IR observations.
The organisation of the rest of this paper is as follows. In Section 2 of this paper we will investigate the fraction of [Nii] emission in the total H + [Nii] flux, how this varies between bulges and disks of spiral galaxies, and suggest possible reasons for this variation. In Section 3, we use Br flux measurements from a sample of galaxies to investigate internal extinction. In Section 4, we use data published by the Universidad Complutense de Madrid (UCM) survey collaboration to investigate the dependences of extinction on galaxy inclination and morphology. In Section 5, the SFRs calculated using both H and far-infrared (FIR) data are compared, used to check the type-dependent extinction corrections, and to constrain deeply-embedded star formation. Section 6 summarizes the main conclusions of this paper.
2 Photometric separation of [Nii] and H
2.1 Methods
The [Nii] 6584Å filter (n6584) at the JKT has a narrow passband (21Å), which is centred on the H line for galaxies with recession velocities close to 960 km s-1. If such galaxies are observed through the n6584 filter, the narrow passband virtually excludes (% transmission) the [Nii] lines. Observations taken through the wider 6594Å H filter (h6594) in the JKT filter set include both the [Nii]-6583 and the H emission. Using the transmission values from the scanned filter profiles on the ING website (see Table 1 for specific values adopted for each observed galaxy), the continuum-subtracted images can be scaled and subtracted so as to produce pairs of images in the H and [Nii]-6583 lines respectively (the [Nii]-6548 line is included in the analysis by multiplying [Nii]-6583 fluxes by a factor of 4/3). The key point to note in Table 1 is that the transmission values of the H line are very similar for the two filters, while those for the [Nii]-6583 line are an order of magnitude lower in the narrower filter; this difference enables the separation process to work. The relative strengths of the H and [Nii]-6583 fluxes can be derived from the separated images using aperture photometry.
By applying this method to a range of galaxies of different types, it is possible to look at variations in the ratio of H to [Nii] both as a function of galaxy type, and of spatial location within each galaxy. In the latter case the effects resulting from radial metallicity gradients, for example, can be investigated.
2.2 Observations
Five hours of service time were granted on the JKT to obtain images through the n6584 filter for the study of [Nii] emission strengths. The observing took place in December 2000 and January 2001. Three galaxies were observed through the n6584 (3 1200 s integrations) and -band continuum filters. H data were taken as part of the main survey. Two further galaxies were observed through the n6584 filter during the main HGS observing time.
The galaxies range from spiral types S0/a to Scd and are listed in Table 1, along with their recession velocities. Photometric calibration was obtained by using observations of Landolt standard stars to define zero-points and airmass corrections for each night as described in Paper I.
| Galaxy | Hubble Type | (km s-1) | ||||
|---|---|---|---|---|---|---|
| UGC 2141 | S0/a | 987 | 0.4149 | 0.4452 | 0.4626 | 0.0680 |
| UGC 2210 | SBc | 1211 | 0.4683 | 0.4298 | 0.3958 | 0.0203 |
| UGC 855 | SABc | 1202 | 0.4667 | 0.4320 | 0.3992 | 0.0213 |
| UGC 8403 | SBcd | 965 | 0.4084 | 0.4425 | 0.4671 | 0.0756 |
| UGC 11872 | SABb | 1150 | 0.4568 | 0.4446 | 0.4171 | 0.0297 |
2.3 Producing separate H and [Nii] images
The -band continuum images were scaled and subtracted from the n6584 filter images. The scaling factor was found to be /n6584 = 118.51.8 from photometry of 41 foreground and standard stars. This is identical, within the errors, to the value of 118.42.2 obtained by multiplying spectrophotometric stellar fluxes by the digitised filter transmission profiles.
The continuum-subtracted images taken through the h6594 filter were scaled so as to match the photometric zeropoint of the n6584 filter images. In the cases where there were large differences in the seeing conditions in the two images, a Gaussian smoothing was applied to the image with the better seeing. The continuum-subtracted images were scaled by the appropriate factors from Table 1 and subtracted to produce one image mapping the [Nii] emission from the galaxy and one image containing only the H light.
2.4 [Nii] and H distributions in individual galaxies
For each of the 5 galaxies, the ratio of the [Nii]-6583 to the H flux and the distribution of each were investigated for the whole galaxy by plotting growth curves. The fluxes were measured in, typically, 50-80 equally spaced elliptical apertures. The location of the galaxy centre was determined by centroiding on the galaxy nucleus in the -band image, and the ellipticity and position angle of the apertures were taken from the Uppsala Galaxy Catalogue (UGC, Nilson 1973). The growth curve from the separated [Nii]-6583 image was divided by that obtained from the separated H image to obtain the ratio [Nii]-6583/H as a function of distance from the galaxy centre.
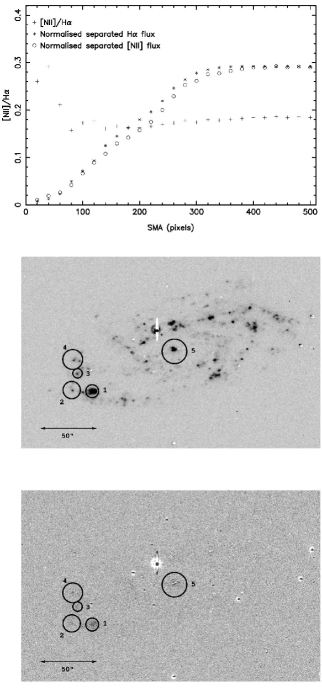
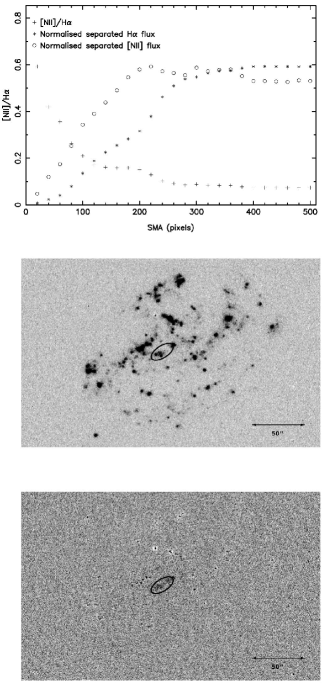
Figures 1 and 2 show this ratio and the two growth curves, normalised to the maximum [Nii]-6583/H ratio, displayed in the upper frame of each group. The middle frame of each group is the uncontaminated H image and the bottom image shows the distribution of the [Nii]-6583 emission.
UGC 2141
Figure 1 (left) shows that in this galaxy, the [Nii]-6583 and H do not separate into distinct regions as found in some of the other galaxies. The [Nii]-6583 image shows a diffuse mix of positive and negative readings, showing that the method has not worked particularly well in this case. This will be, in part, due to the large seeing difference between the nights in which the galaxy was observed through the h6594 filter (2.0 arcsec) and the n6584 filter (1.0 arcsec). However, this should not affect the large-scale trends or overall ratios shown in Fig. 1.
The ratio of [Nii]-6583 to H increases in the outer regions of the galaxy and levels off at a value of 0.13. Thus, the value of H/(H + [Nii]-total) is 0.85, which is higher than the mean value suggested Kennicutt (1983), and [Nii] emission is relatively weak in this galaxy.
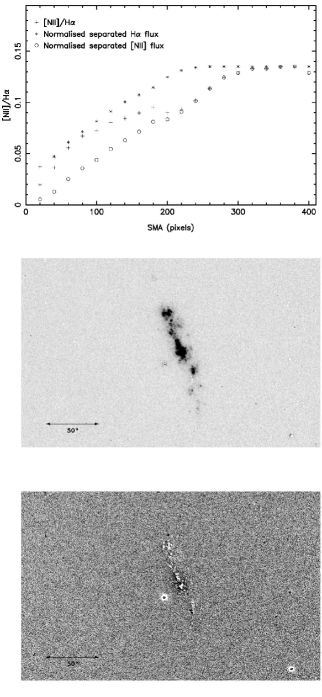
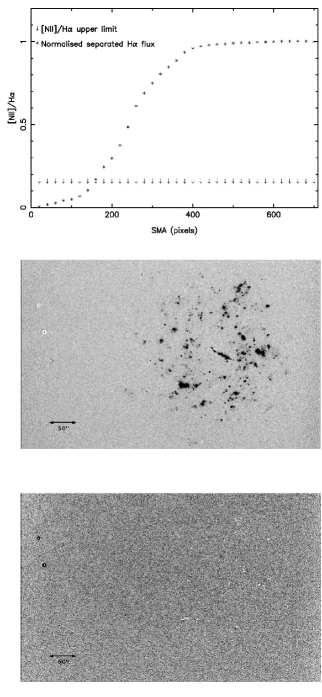
UGC 2210
Figure 1 (centre) shows virtually no [Nii] emission. The [Nii] growth curve shows no significant departures from zero and it is only possible to put an upper limit on the [Nii] to H ratio for the whole galaxy. The upper limits shown in this figure correspond to the highest value detected in any of the photometric apertures used. The 3 upper limit on the [Nii]-6583/H ratio for the whole galaxy is 0.02, which is equivalent to a lower limit of 0.97 on H/(H + [Nii]-total).
UGC 2855
Figure 1 (right) shows that there is a high ratio of [Nii]-6583 to H in the nucleus, but this ratio falls significantly in the disk. There is an arc of [Nii]-6583 emission, however, located at the eastern end of one of the spiral arms.
The asymptotic value of [Nii]-6583/H is 0.18. H/(H + [Nii]-total) is, therefore, 0.80 for the whole galaxy.
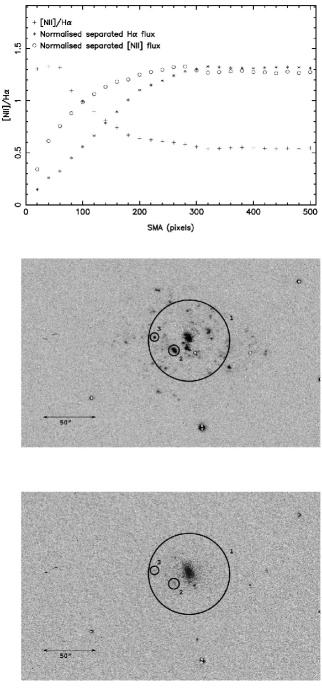
UGC 8403
Figure 2 (left) shows strong nuclear [Nii]-6583 emission, peaking in the centre with an [Nii]-6583/H ratio of 0.59. This falls rapidly and there is very little sign of [Nii] in the disk. The average ratio for the whole galaxy is just 0.07, which corresponds to H/(H + [Nii]-total) = 0.91.
UGC 11872
Figure 2 (right) shows very strong [Nii]-6583 emission in the galaxy nucleus, with a ratio of [Nii]-6583 to H of 1.33 over the central 20′′ in radius. UGC 11872 is listed on NED as containing a low-ionisation nuclear emission region (LINER). The [Nii]-6583 emission is much weaker in the outer regions of the disk, but the total [Nii]-6583/H ratio for the galaxy is still 0.54, easily the largest fraction in the 5 galaxies studied. The fraction of H to the H + [Nii]-total flux is 0.58 for the entire galaxy.
The above results are summarised in Table 2. The quoted errors represent the standard deviation of individual points about the asymptotic values in the [Nii]/H growth curves.
| Galaxy | [Nii]-6583/H | H/(H + [Nii]-total) |
|---|---|---|
| U2141 | 0.133 | 0.849 |
| U2210 | 0.020 | 0.974 |
| U2855 | 0.185 | 0.802 |
| U8403 | 0.074 | 0.910 |
| U11872 | 0.541 | 0.582 |
For the three galaxies where individual [Nii]-emitting regions were visible, the ratio of [Nii] to H was investigated separately in each emission-line region. Circular or elliptical apertures were placed around the regions in the positions indicated in Figs. 1 and 2. The fluxes were recorded in identical apertures in both the H-only image and the [Nii]-6583 image. The results are combined in Table 3.
| Region | [Nii]-6583/H | H/(H + [Nii]-total) | |
|---|---|---|---|
| U2855 | 1 | 0.228 | 0.767 |
| 2 | 0.520 | 0.591 | |
| 3 | 0.407 | 0.649 | |
| 4 | 0.529 | 0.587 | |
| 5N | 0.289 | 0.722 | |
| U8403 | N | 0.536 | 0.582 |
| U11872 | 1N | 0.800 | 0.484 |
| 2 | 0.337 | 0.691 | |
| 3 | 0.277 | 0.731 |
If we were to assume that all Hii regions in a galaxy have approximately the same ratio of [Nii] to H, then the mean value of H/(H + [Nii]-total) for spiral galaxies, calculated from the individual regions listed in Table 3, would be 0.6450.03. This is in fair agreement with the value quoted in Kennicutt (1983) of 0.750.12, which was derived using effectively the same assumption. However, the majority of the above regions were selected on their [Nii] emission, which can obviously bias the mean ratio. The process was repeated for some of the most luminous regions in the H-only image. The [Nii] fluxes for these regions were predicted assuming H/(H + [Nii]-total) = 0.75 and should have all been easily detectable. With the exception of regions 2 and 3 in UGC 11872, no corresponding [Nii] flux could be measured in any of these areas.
The 3 upper limit on the [Nii] to H ratio lies between 0.034 and 0.117 for the regions investigated. Since these limits are well below the average ratio found from Table 3, the assumption of equal ratios of [Nii] to H in all Hii regions can not be valid.
A further test of this is to remove the regions in which [Nii] was detected and use a single large aperture to measure the ratio of the remaining [Nii] to H in each galaxy. The results are presented in Table 4, and again show that the ratio of [Nii] to H is low outside the most strongly line-emitting regions.
| Galaxy | [Nii]-6583/H | H/(H + [Nii]-total) |
|---|---|---|
| U2855 | 0.147 | 0.836 |
| U8403 | 0.068 | 0.917 |
| U11872 | 0.241 | 0.757 |
2.5 Literature studies of [Nii] emission
Burbidge & Burbidge (1962) found evidence for the variation in the [Nii]-total/H ratio within spiral galaxies, with the typical ratio being 1/3 in disk regions, but rising to 1 (occasionally significantly higher) in nuclear regions. They suggested that such variations could be due to either metallicity gradients, resulting in a higher nitrogen abundance in the central parts of galaxies, or to a higher electron temperature in these regions. Osterbrock (1989) also notes the ambiguity inherent in interpreting the [Nii]/H ratio, but he notes that it clearly splits ‘HII-like’ galaxies from those thought to be powered by active galactic nuclei. This point is discussed by Baldwin et al. (1981), who demonstrate that higher values of the ratio can result either from shock heating, or from photoionization with a power-law spectrum, rather than the near-black-body spectrum expected from stellar photoionization. The nearby Sab LINER, M81, provides a particularly well-studied example of the systematic variations found in the [Nii]/H ratio. Stauffer & Bothun (1984) measured the [Nii]-6583 /H ratio for 10 disk regions, finding values in the range 0.22–0.45, whereas the nuclear value of this ratio is found by Filippenko & Sargent (1988) to be much larger at 2.3. Most authors have followed Peimbert (1968) in ascribing the radial changes in this ratio primarily to the abundance gradient.
A highly interesting phenomenon of great relevance to the current study is the occurrence of Extended Nuclear Emission-line Regions (ENERs) noted in the bulge regions of nearby spiral galaxies by Devereux and collaborators (Devereux et al. 1994, 1995; Hameed & Devereux 1999). These are areas of diffuse emission, seen through filters transmitting H [Nii] light, which do not have the clumpy appearance associated with star formation regions, and are cospatial with the old or intermediate-age stellar populations of galaxy bulges. Such components have been found in M 31 (Devereux et al. 1994), M 81 (Devereux et al. 1995), and in 7 out of a sample of 27 Sa–Sab galaxies studied by Hameed & Devereux (1999). These authors argue strongly that these extended components, which typically comprise 30% of the H [Nii] luminosity in these galaxies, are completely unrelated to star formation activity, and they propose that this emission is either shock-excited, or photo-ionized by extremely hot post-AGB stars. The latter option provides a simple explanation for this emission being distributed throughout the bulge region. It is clear that the central extended emission found in the present study, most clearly in UGC 11872, but also from UGC 2855 and UGC 8403, is the same ENER phenomenon noted by Devereux and collaborators, and the high [Nii]-6583 /H ratio we find throughout these regions lends weight to the suggestion that these are not excited by star formation.
2.6 [Nii] vs H emission - summary and conclusions
The method discussed here for photometrically separating the [Nii] and H emission from galaxies can be used both to refine the [Nii] corrections proposed by Kennicutt (1983) for future H based studies of star formation activity, and to study the nature of emission-line sources in galaxies. The current sample size of this investigation is very small, but even so, we see a wide variation in the strength and distribution of [Nii] emission in each galaxy. For example, UGC 2210 and UGC 2855 are both Sc galaxies, and yet their [Nii] profiles are very different. No correlation is evident here between between [Nii] / H ratio and galaxy luminosity, but this is not surprising given the small sample size and the scatter in this relation found by Jansen et al. (2000) and Gavazzi et al. (2004). UGC 2141, 2855 and 11872 lie close to the best-fit line for this correlation as presented by Gavazzi et al. (2004), but UGC 8403 has weak [Nii] emission for a relatively bright spiral galaxy, and UGC 2210 has weaker [Nii] than any galaxy studied by Gavazzi et al. (2004).
The Kennicutt (1983) correction agrees well with this work for individual regions selected by their high [Nii] fluxes. For the remaining galaxy, and the galaxy as a whole, however, the correction significantly overestimates the [Nii] contamination effects.
Clearly, further observations through the n6584 filter are required, particularly of irregular galaxies, before a new set of [Nii] corrections can be derived. For the SFRs published in Paper I, the current standard corrections were used for comparability with other work. If a value of H/(H + [Nii]) of 0.823, suggested by the mean of the values for the 5 entire galaxies in Table 2, is taken, then the derived SFRs as reported in Paper I are too low by 7%.
The photometric separation method is also a good way of investigating the distribution of [Nii] within each galaxy. Three out of the 4 galaxies for which positive [Nii] measurements could be made showed higher [Nii]/H fractions in the metal-rich nuclear regions than in their younger disks, including diffuse components which we identify with the ENER phenomenon discussed by Devereux and collaborators (Devereux et al. 1994, 1995; Hameed & Devereux 1999). The higher nuclear ratios are consistent with the findings of earlier studies (e.g. Burbidge & Burbidge 1962), and may explain the high values found by McQuade et al. (1995), whose study was based on spectroscopy of central regions of galaxies.
3 Investigating internal extinction effects using Br observations
3.1 Methods
Compared to H, the effective extinction at the wavelength of the Br 2.166m hydrogen recombination line is lower by a factor of 7.1 (calculated using the extinction curve of Cardelli et al. 1989), making this line an excellent probe of dust-embedded star formation. Assuming case B recombination (Osterbrock 1989), the intrinsic Br/H line ratio can be predicted. Comparing the measured and predicted ratios, we can calculate the excess extinction at H compared to Br, and hence the total extinction at H, by the assumption of a standard extinction law.
The Br line is relatively weak, however, with a flux 104 times weaker than that of H (Osterbrock 1989; this assumes 10,000 K and an electron density cm-3). Thus a 4 metre class telescope is required for Br observations in galaxies. The UFTI (UKIRT Fast Track Imager) camera at UKIRT (United Kingdom InfraRed Telescope) with the Br and Brz filters (centred on 2.166m and 2.173m respectively) is ideal for this work as the filters can be used for galaxies with recession velocities up to 4500 km s-1, encompassing the full range of recession velocities for galaxies in our sample (0–3000 km s-1). Three nights of observing time (2001 January 17-19) on UKIRT were awarded for Br observations of a subset of the H sample.
3.2 UKIRT observations and data reduction
Thirty-nine galaxies were selected from the H survey sample, subject only to the selection criteria of this survey (Paper I) and the need to sample all spiral and irregular Hubble types, and excluding the largest galaxies (3.5 arcmin) because of the field of view of the infrared camera used. Twenty-one of these were spirals ranging between Hubble types S0/a to Sd inclusive, and 18 were irregulars with a range of absolute magnitudes. During the three night run, 22 of the galaxies were observed through one of the two Br filters and the continuum filter. Given the difficulties encountered in detecting Br emission, the decision was made at the telescope to target preferentially galaxies with the strongest H line emission.
Exposure times varied from 600 s to 3600 s through the Br filters, depending on the magnitude of the galaxy. The Br filter was used for galaxies with velocities less than 1000 km s-1, and the Brz filter for those with higher redshifts. A 300 s exposure was taken for each galaxy through the filter (centred on 2.1123m) for continuum subtraction. A dark image was taken for each observation, and sky flats and standard stars were observed throughout the night. Observations of standard stars confirmed that all three nights were photometric, and were used to calculate the scaling factors between the two Br filters and the filter. For the 10 stars observed through both the and the Br filters, the mean ratio of detected counts, /Br, was found to be 10.740.10. A value for /Brz of 7.130.09 was derived from the 8 standard stars observed through these filters. Appropriately scaled and aligned images were subtracted from each Br frame to remove the continuum emission.
3.3 Br detections
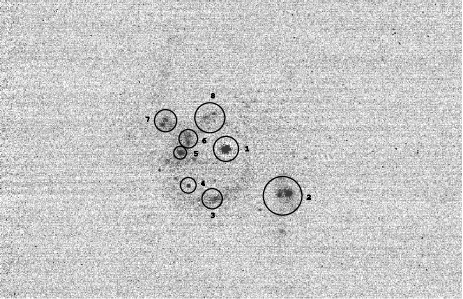
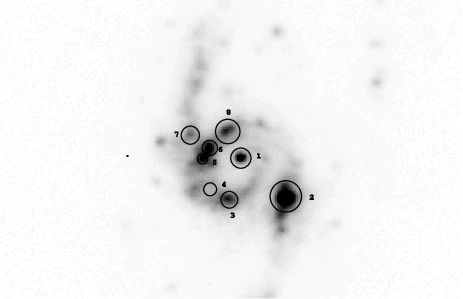
Out of the 22 galaxies observed, only eight show any sign of Br detections after continuum subtraction. In the cases of six of these, there are 1-3 detections of small, isolated regions. The Br image of UGC 5786, however, contained a detection of nearly the whole galaxy, with eight strong regions that particularly stand out (Fig. 3, left image). UGC 5786 is a very strong H emitter (Fig. 3, right image), and has the highest observed H flux in the H Galaxy Survey.
In order to correlate the Br regions with their H counterparts, the Br data were rebinned to match the pixel scale of H images. To measure the coordinate offset between the two sets of data, the centroid was found for the galaxy nucleus, or a bright non-saturated star, in both the JKT -band image and the UKIRT -band image. There was found to be no significant rotation between the two sets of images.
Br fluxes were calculated by placing an aperture around each region. An annular sky region was taken in cases where there were no other sources nearby. Random measurement errors were investigated by changing the size and position of the sky annulus or offset region. Systematic errors caused by structure in the background were investigated using 25 artificially-generated sources with a two-dimensional Gaussian profile, and sizes comparable to the real sources detected in the Br frames. For each detected real source, the artificial sources were scaled to match the real source and added to the real frame. Aperture photometry was then performed on the embedded fake sources and the standard deviation in values was used as a measure of the error in the determination of the flux of the real source. These sky-background errors dominate over other sources of error, such as the uncertainty in the continuum scaling factors.
The apertures around the Br regions were transformed to the H coordinate system and the H flux for the corresponding region was then calculated. In most cases, the regions detected in Br matched up with obvious regions in the H image. The errors on the H measurements were found to be much less than those on the Br measurements. The dominant source of error when calculating H fluxes was shown in Paper I to be the uncertainty in the continuum scaling factors (10% for a typical galaxy observed through the h6570 or h6594 narrow-band filters), and the total uncertainty to be between 10 and 15%.
Table 5 shows the Br fluxes and their corresponding H fluxes for all the detected regions, with the exception of a small number of weak detections with no H counterpart. The 1 errors given are those derived from the slight movement of the Br aperture and changing the sky region (col. 5), the variation in counts measured from fake sources with the same flux as the object (col. 6), and the error analysis for H fluxes in Shane (2002) (col. 8). UGC 3711 was observed on two nights: 17/01/01 (N1) and 19/01/01 (N3). The Br fluxes for both galaxies are in agreement within the quoted errors.
In col. 9, the ratio of the detected fluxes is presented. The intrinsic flux of the Br line is 104 times less than that of H and the effective extinction is 7.1 times lower (following the extinction law of Cardelli et al. 1989); thus the H extinction coefficient, (H), is given by :
is the correction for Galactic extinction, as quoted on the NASA/IPAC Extragalactic Database (NED). The factor of 0.75 corrects for [Nii] contamination in the H flux (see Section 2). This is the correction recommended by Kennicutt (1983), however, if we substitute the value 0.823, suggested by the mean H/(H + [Nii]-total) ratio for the 5 entire galaxies in Table 2, the values of (H) will be slightly lower. As an example, the extinction found for region 3 of UGC 5786 will fall from 1.48 to 1.37 if this change is made. Since we are investigating individual Hii regions here, however, we continue to use Kennicutt’s value (which was also derived for luminous individual Hii regions) in this analysis. This value is also consistent with the mean correction found in Section 2.4 for individual regions, but this does constitute a significant source of uncertainty in the following analysis.
| UGC | type | region | (Wm-2) | (Wm-2) | |||||
|---|---|---|---|---|---|---|---|---|---|
| 2455 | IBm | 1 | 6.662(–18) | 10.5% | 8.8% | 2.501(–16) | 15% | 37.5 | 1.1 |
| 2 | 1.543(–18) | 36.0% | 35.0% | 2.629(–18) | 15% | 1.7 | 5.0 | ||
| H1 | 2.994(–18) | 25.3% | 17.7% | 9.650(–17) | 15% | 32.2 | 1.2 | ||
| 3711 (N1) | IBm | 1 | 4.460(–18) | 10.3% | 17.0% | 2.304(–16) | 15% | 51.7 | 1.0 |
| 2 | 1.376(–18) | 15.7% | 28.0% | 5.278(–17) | 15% | 38.4 | 1.4 | ||
| 3711 (N3) | 1 | 4.154(–18) | 6.2% | 15.2% | 2.304(–16) | 15% | 55.5 | 0.9 | |
| 2 | 1.017(–18) | 11.2% | 48.0% | 5.278(–17) | 15% | 51.9 | 1.0 | ||
| 5731 | SAab | N | 3.878(–17) | 11.4% | 3.6% | 1.190(–16) | 15% | 3.1 | 4.7 |
| 5786 | SABbc | 1(N) | 2.306(–17) | 2.3% | 2.9% | 3.881(–16) | 15% | 16.8 | 2.6 |
| (pec) | 2 | 2.175(–17) | 4.3% | 2.9% | 1.587(–15) | 15% | 72.9 | 0.8 | |
| 3 | 7.864(–18) | 4.2% | 7.6% | 3.228(–16) | 15% | 41.1 | 1.5 | ||
| 4 | 3.307(–18) | 8.3% | 14.1% | 1.066(–16) | 15% | 32.2 | 1.8 | ||
| 5 | 6.305(–18) | 2.0% | 9.8% | 1.841(–16) | 15% | 29.2 | 1.9 | ||
| 6 | 8.373(–18) | 4.5% | 7.6% | 3.909(–16) | 15% | 46.7 | 1.3 | ||
| 7 | 9.488(–18) | 3.2% | 7.6% | 2.396(–16) | 15% | 25.3 | 2.1 | ||
| 8 | 8.399(–18) | 16.6% | 7.6% | 5.144(–16) | 15% | 61.2 | 1.0 | ||
| H1 | 2.820(–18) | 24.0% | 16.4% | 1.080(–16) | 15% | 38.3 | 1.6 | ||
| 6123 | SBb | N | 8.291(–18) | 9.1% | 11.1% | 4.983(–17) | 15% | 6.0 | 3.9 |
| 7985 | SABd | 1.229(–18) | 10.8% | 32.6% | 9.410(–17) | 15% | 76.6 | 0.7 |
The values of (H) for each region are recorded in col. 10. In most cases the extinction values lie between 0.5 and 1.8 mag, in agreement with the findings of previous studies. Four regions have significantly higher values (2.5 mag). The high extinction regions in UGC 5731, UGC 5786 and UGC 6123 are all situated in the nucleus of the galaxy, and are indicated with an N in Table 5. The high extinction region in UGC 2455 coincides with a region that is bright in the -band image, but appears faint and diffuse when viewed in H. Finally, we note that similar data taken with 4.2 metre William Herschel Telescope using the INGRID 10241024 near-IR array camera (Packham et al. 2003) show clear Br emission from the nucleus of UGC 4779. This emission implies a highly dust-embedded source at the centre of this galaxy ( 6–7), given the weak H emission found from the corresponding region.
3.4 Putting limits on Br detections
Due to the low number of Br detections in our observations, we determined the minimum flux that a region would need in order to give a 3 detection in each image, thus enabling us to derive useful limits from non-detections. This was done by creating a frame with randomly-placed artificial sources as discussed in Section 3.3. The generated frame was then re-normalised and added to each of the observed Br galaxy images. Photometry was performed on the artificial sources and the mean value, along with the 1 error was calculated. The re-normalisation factor was adjusted until the mean value fell below 3. The mean count rate was then converted into a flux in the same way as if a real Br source was being investigated. This calculated flux corresponds to the minimum Br source flux that we could reliably detect (to a 3 certainty) in each frame. The results varied from frame to frame, but were all between 1.2 and 5.7 Wm-2. This range is around the same as the values detected for the fainter Br regions. Thus we are detecting Br at the very limits of what is possible with the UKIRT images.
We also investigated whether there were any Br regions which should have been detected, given the intrinsic line ratios which we assume here, but which were not seen. For each galaxy observed by UKIRT, the H image was examined and the fluxes of the regions with the brightest H emission were measured. If an extinction of (H) = 1.1 mag is assumed, there should be corresponding Br fluxes approximately 44 times fainter than these H fluxes, and under the most extreme assumption of no extinction, a Br source should be present with 1/104 times the H flux. In all cases where the predicted Br flux for a region was greater than or close to the calculated minimum Br flux that would give a 3 detection, aperture photometry was carried out on that region in the Br image.
Fourteen regions were investigated in 9 different galaxies. In the majority of cases any Br flux found was below the 3 certainty level. Two new regions were identified however, one in UGC 2455 and a further one in UGC 5786 (below region 2 in Fig. 3). Data for these regions are presented in Table 5, with the regions identified as UGC 2455 H 1 and UGC5786 H 1.
| UGC | region | (Wm-2) | (Wm-2) | ||
|---|---|---|---|---|---|
| 2392 | 1.240(–16) | 1.299(–18) | 95.46 | 0.20 | |
| 2455 | a | 6.540(–17) | 1.759(–18) | 37.18 | 1.06 |
| b | 7.260(–17) | 1.759(–18) | 41.27 | 0.93 | |
| 3711 | 1.300(–16) | 1.802(–18) | 72.14 | 0.59 | |
| 5731 | 1.600(–16) | 2.693(–18) | 59.41 | 1.00 | |
| 5786 | 1.070(–16) | 1.742(–18) | 61.42 | 0.97 | |
| 6797 | 1.530(–16) | 2.162(–18) | 75.39 | 0.70 | |
| 7232 | 1.130(–16) | 2.611(–18) | 43.28 | 1.39 | |
| 7690 | 1.980(–16) | 3.092(–18) | 64.04 | 0.89 | |
| 7985 | a | 1.380(–16) | 2.727(–18) | 50.61 | 1.20 |
| b | 1.190(–16) | 2.727(–18) | 43.64 | 1.39 | |
| c | 1.820(–16) | 2.727(–18) | 66.74 | 0.85 |
The extinction values obtained here are consistent with those found previously. For the remaining regions, the upper limits for detectable Br fluxes found using the randomly-placed artificial sources were used to place upper limits on the extinction coefficient for these regions. These are shown in Table 6. The limits show that the extinction values in these H selected Hii regions do not lie above the range of extinction values found by other authors (i.e. 1.8 mag). The region investigated in UGC 2392 has mag and, thus, appears to contain much less extincting dust than normal.
From our study of artificial sources, no 3 limits for Br detections were found with fluxes less than the lower limit value of . This value is the minimum limit in the case where there is no extinction, and this gives confidence in our photometry, reduction procedures and the physical assumptions made.
3.5 Br fluxes in the literature
Br fluxes for a further two galaxies in our H sample have been measured previously during spectroscopic studies of extinction in starburst galaxies. These values have been published in Kawara et al. (1989), Ho et al. (1990), and Calzetti et al. (1996).
The H fluxes for the corresponding areas were found from our data and used to calculate the values for the H extinction coefficient in these regions. In the case of UGC 12699, the region investigated was the bright starburst nucleus. For UGC 8098, Calzetti et al. (1996) observed the main star-forming region, which is located a long way south of the nucleus.
The quoted Br fluxes, the measured corresponding H fluxes and the calculated values for the H extinction coefficient are presented in Table 7.
| Reference | UGC | (Wm-2) | (Wm-2) | ||
|---|---|---|---|---|---|
| Kawara et al. (1989) | 12699 | (–17) | (–15) | 43.7 | 1.32 |
| Ho et al. (1990) | 12699 | 4.7(–17) | (–15) | 41.5 | 1.38 |
| Calzetti et al. (1996) | 12699 | (–17) | (–15) | 44.7 | 1.29 |
| Calzetti et al. (1996) | 8098 | (–17) | (–15) | 89.2 | 0.53 |
The three values for UGC 12699 are all in very good agreement within the quoted uncertainties. The extinction value in UGC 8098 is low, but within the range quoted in the literature for individual Hii regions.
3.6 Investigating extinction through Br observations - summary and conclusions
Twenty-two galaxies were observed through Br filters at UKIRT in order to investigate the effects of extinction internal to some of the galaxies observed in the H Galaxy Survey sample. Only 8 of the galaxies provided any detections of Br however, with most of these containing just 1-3 isolated regions of measurable flux. UGC 5786 was the only object where nearly the whole galaxy could be detected in Br. These data cannot be used, therefore, to investigate the overall effective extinction for entire galaxies.
H extinction coefficients were calculated for each of these individual regions and have been plotted in Fig. 4, along with the upper limits derived from investigating the regions with the highest H fluxes. In most cases, (H) values are found to be in the 0.5-1.8 mag range quoted in the literature and indicated by the dashed lines in the plot. Error bars have been omitted here for clarity, but one third of the plotted values are consistent with the Kennicutt (1998) value of 1.1 mag, represented by the solid line. Higher extinction values were found in nuclear regions, indicating the presence of large amounts of extincting dust.

Insufficient data were available here to investigate any relationship with galaxy morphology. It is clear, however, that (H) varies even within a single galaxy, and hence a significant fraction of the extinction must be associated with the star-forming regions themselves. In the following Section, we will use published data from the literature to continue our investigation into internal extinction.
4 Internal extinction from literature H and H observations.
4.1 The UCM H survey
The UCM survey (Zamorano et al. 1994, 1996) used a Schmidt telescope, a low-dispersion objective prism and photographic emulsion to search a wide field of sky for low redshift emission line galaxies (ELGs). The UCM instrumentation limits the survey to z 0.045. Gallego et al. (1995) report the detection of 264 ELGs in an area covering 471.4 square degrees, more than half of which (138 objects) do not appear in any published catalogue.
Follow up imaging has been published by Vitores et al. (1996a, b), papers which contain the Hubble type data used here, and statistical analyses of the sample galaxies, respectively. The morphological distribution of the sample is dominated by late-type galaxies (66% being Sb or later) with 10% presenting typical parameters of E-S0 types, and a further 10% being irregulars. This result is a consequence of the UCM selection by the presence of emission features. Nine blue compact dwarf galaxies were also detected. Follow-up slit spectroscopy was obtained, enabling the calculation of H and H fluxes (Gallego et al. 1996).
The UCM dataset thus provides galaxy ellipticities (Pérez-González et al. 2001), morphologies (Vitores et al. 1996a) and colour excesses (Gallego et al. 1996) for a large number of galaxies. These can be used to investigate the dependence of internal extinction on galaxy inclination and morphology, which proved impossible with our Br observations.
The UCM line fluxes were obtained spectroscopically from slit widths between 2 and 4 arcsec. The mean redshift of the galaxies is approximately 0.02, thus the derived (H) values will be predominantly for the central regions. There are significant uncertainties in line fluxes for weak-lined galaxies due to the 0.3 nm correction applied to compensate for photospheric absorption underlying both H and H lines (Pérez-González et al. 2003). As a result, the analysis presented below was done twice; once for all galaxies with relevant data, and then including only galaxies with H EW greater than 1 nm and H EW greater than 6 nm, for which the absorption-correction uncertainties will be minimised.
4.2 The dependence of internal extinction on inclination
The colour excess values in Gallego et al. (1996) are computed using either H/H or H/H observed intensity ratios. Corrections for Galactic extinction can be found in Vitores et al. (1996a). These have been determined from the Burstein & Heiles (1982) maps at the Galactic coordinates of each UCM object. The corrected values of can be converted to (H) using the extinction law of Cardelli et al. (1989), which gives:
where the extinction parameter is defined as
Figure 5 shows the calculated H extinction internal to each of the UCM spiral galaxies, in magnitudes, plotted against the cosine of the inclination for 109 UCM spiral galaxies. A least-squares regression method to all 109 points gives
The linear correlation coefficient for this fit is 0.106, however, indicating that the significance for the relationship is just 72%. A fit to just the points with strong line emission (the solid points in Fig. 5) gives no correlation at all; the slope is -0.030, with a correlation coefficient of just 0.012. It is clear that selecting on strong emission lines excludes many of the galaxies with high internal extinction, and the mean A() value is only two-thirds as large for this subset. The scatter in extinction values is large compared to the systematic corrections implied by the above regression fit (0.1-0.2 mag). No inclination corrections were applied to H fluxes presented in Paper I.

4.3 The dependence of internal extinction on morphology
We can also use the UCM data to investigate whether there is significant type dependence of extinction values. Vitores et al. (1996a) classify each of the UCM galaxies according to the classical Hubble types, as well as including the BCD (Blue Compact Dwarf) type. They define BCDs as galaxies possessing all of the following properties: compact appearance in the direct image, linear size () lower than 10 kpc, luminosity , and photometric parameters typical of later Hubble types. Spectral information from Gallego et al. (1996) was also used for confirmation.
The extinctions calculated from the colour-excess values in Gallego et al. (1996) are plotted against the assigned morphologies in Fig. 6. The plot featuring the individual galaxy values shows a large scatter within each galaxy type. Vitores et al. (1996a) estimate the typical uncertainty in their adopted morphologies to be about one Hubble type. However, this is unlikely to be the primary cause of the scatter, as inspection of the mean extinctions for each galaxy type reveals that (H) varies little between S0 and Sb type galaxies. The mean extinction is slightly lower for late-type spirals and drops substantially for irregulars and BCD galaxies.
Kennicutt (1998) recommends an H extinction value of 1.1 mag for all galaxy types, while Tresse & Maddox (1998) and Tresse et al. (2002) use H/H ratios to derive a mean value consistent with 1.0 mag in , i.e 0.75 mag at H. Figure 6 would suggest higher corrections, of around 1.5 mag, for early-type spiral galaxies (S0-Sbc), 1.2 mag for late-type spirals (Sc+), and a lower value of around 0.4 mag for Magellanic irregulars and dwarf galaxies.
This type dependence is generally consistent with results from previous studies, most of which have been based on broad-band photometry. Valentijn (1994) found extinction effects to be larger for Sb and high surface brightness Sc galaxies than for later types. Han (1992) found systematically larger extinction for types Sbc–Sc (0.90) than for either earlier types, S0/a–Sb (0.73) or later types, Scd(0.51). Finally, Buat & Xu (1996) found the near-UV 2000Å extinction of Sa-Scd spirals to be significantly larger than that for Sd-Irr types (0.9 and 0.2 mag. respectively).


It should be remembered that the UCM extinction corrections are derived from optical lines, and thus there may be a selection effect against high (H). However, the values derived are generally consistent with those from Br/H ratios presented in ths paper, which will be less subject to such effects. The UCM measurements are also primarily made from nuclear regions and may somewhat overestimate the extinction characteristic of outer, disk regions. Figure 4 demonstrates that nuclear extinction values can be substantially larger than disk values for the same galaxy, and Domingue et al. (2000) find clear evidence of higher interarm extinction values towards the central regions of 18 pairs of overlapping galaxies. Thus it is possible that the results shown in Fig. 6 would be different if extinctions were plotted specifically for disk regions, but at present there is no dataset available to test this possibility.
The Kennicutt extinction correction was applied when calculating SFRs in Paper I for ease of comparability with similar studies. The effects of applying the type-dependent corrections suggested above will be investigated in the following Section, and in further papers.
5 Comparison of star formation rates derived from H and far-infrared luminosities
5.1 Motivation for a test using H and IRAS data
In this Section we will compare SFRs calculated using both HGS H fluxes, and FIR fluxes from IRAS (the Infrared Astronomy Satellite). There are two main reasons for doing this. Firstly, we can compare ‘direct’ measures of star formation, as represented by the detected H flux from a galaxy, with indicators derived from dust re-emission, i.e. the FIR flux. This will provide a test of the type-dependent H extinction corrections by comparing against an almost extinction-independent measure of star formation for our galaxies. Secondly, this will provide constraints on any very deeply dust-embedded star formation component which in principle could be missed entirely by optical and even near-IR measurements, but would certainly result in FIR luminosity. Such components are known to exist, for example in the ultraluminous infrared sources for which Arp 220 is the local archetype, but it is of great interest to know whether such components exist, and at what level, in more normal galaxies.
The IRAS all-sky survey resulted in FIR fluxes for over 30,000 galaxies (Moshir et al. 1992), and these can be used as an indirect tracer of star formation. Complications arise from the uncertainties in the processes responsible for the heating of the IR-emitting dust. Devereux & Young (1990) and Devereux & Hameed (1997) argue that high-mass ionising stars dominate the dust heating. If this is the case, then the FIR luminosity of a galaxy should correlate well with the H luminosity, since this is also the result of the UV radiation field from OB stars. Others (e.g. Lonsdale Persson & Helou 1987; Buat & Deharveng 1988; Sauvage & Thuan 1992) have argued that cirrus emission from dust heated by the general stellar radiation field, including old, low-mass stars, is also an important factor. In this case, we would expect early-type galaxies, with older overall stellar populations, to produce higher FIR luminosities than predicted by H-calculated SFRs.
The large size of the HGS sample, combined with the excellent coverage of galaxy morphologies and surface brightnesses, provides the basis for investigating the reliability of using FIR luminosities to trace high-mass star formation.
5.2 Calculation of star formation rates from IRAS flux densities
The HGS sample was cross-correlated with the IRAS Faint Source Catalogue v2.0 (FSC) using a search radius of 60′′ around the galaxy positions quoted in NED. 178 galaxies were found in common.
A convenient conversion from flux measurements in the IRAS bands to a total FIR flux is given by Helou et al. (1988); these values were converted into FIR luminosities using galaxy distances calculated as described in Paper I, using the Virgocentric inflow model of Schechter (1980), and an asymptotic Hubble constant of 75 km s-1 Mpc-1.
The calibration of to SFR varies within the literature and depends on assumptions about the star formation timescale and initial mass function. Kennicutt (1998) gives a calibration calculated for starbursts with ages less than years. In more quiescent, normal star-forming galaxies, the empirical relation found by Buat & Xu (1996) is the most appropriate, and hence is used here:
| (1) |
This correlation is based on IRAS and UV flux measurements of 152 disk galaxies. The values given in brackets indicate the 1 interval found for the FIR to UV luminosity ratio.The H SFRs listed in Paper I are determined using the equation derived by Kennicutt et al. (1994):
| (2) |
An internal extinction correction of 1.1 mag. (H) was initially used for all galaxy types in calculating H SFR values.
5.3 Comparing HGS and IRAS star formation rates
The 178 galaxies with both HGS and IRAS SFRs are plotted in Fig. 7. The galaxies are coded by galaxy type. The dashed line in the figure represents a one-to-one correlation. The solid line is the best-fit line calculated from a least-squares regression fit to the data. The equation of this line is:
| (3) |
The plot shows a good correlation between the two measures of SFR, although there is a significant deviation from the one-to-one line. The linear correlation coefficient is 0.91 (where a value of 1 is a perfect correlation and a value of 0 indicates no correlation), with a significance of 99.99%. For the most rapidly star-forming galaxies, predominantly Sb-Sc types, the two measures of SFR agree very well. For the galaxies with lower SFRs, comprised mainly of the later types, the FIR tracer seems significantly to underestimate the star formation, compared to the H.

Figure 7 can be compared with the middle plot of fig. 1 in Cram et al. (1998), where H SFRs are plotted against SFRs from radio-power measurements. The latter can be replaced by 60 m IR emission, since the top plot shows a strong one-to-one correlation between the two. The trend for IR measurements to predict lower SFRs at the low end of the scale than the H measurements is visible here. One possible reason for this is that galaxies with low SFRs may have lower dust opacities, and thus be less efficient at absorbing the stellar-UV radiation field from new stars and re-emitting it at infrared wavelengths.
The slope of a best fit-line to the plot of H SFR vs radio SFR in Cram et al. (1998) is much less than 1, and lower than the gradient for the HGS-IRAS relation, 0.85. Both investigations show that the assumption of a linear correlation between FIR luminosity and SFR in Equation 1 with a slope of unity in the log-log plot does not appear to be valid. This is further supported by Sauvage & Thuan (1992), who find a slope of 0.69 when examining the same relationship for a sample of 135 galaxies. They argue that this supports the two-component model where the FIR luminosity comes from both star-forming regions and quiescent cirrus-like regions of the ISM.
The right-hand axis in Fig. 7 displays the FIR luminosity. The plot clearly shows a strong, tight correlation between FIR luminosity and the SFR as determined by the H luminosity. If the latter is assumed to be an accurate and reliable measure of the total star formation (bearing in mind the uncertainties in extinction and [Nii] corrections), then Equation 3 can be used to derive a non-linear, empirical correlation between FIR luminosity and the star formation rate of a galaxy:
| (4) |
Since this equation is derived from SFRs calculated using Equation 2, it implicitly assumes the same Salpeter IMF.
5.4 A test of morphology-dependent extinction corrections
We will now make use of the extinction independence of FIR emission to perform a simple test of the efficiency of the morphology-dependent extinction correction derived from the UCM data in Section 4.3.
The galaxies in Fig. 7 are coded by morphological type. It can clearly be seen that the early-type galaxies (S0/a-Sab) tend to lie above the best-fit line, indicating an excess of FIR flux compared to the predictions of the new calibration. This is in agreement with the findings of Buat & Xu (1996) and supports the theories of old, low-mass stars contributing significantly to the dust-heating stellar radiation field. Young et al. (1996), for their sample of 120 disk galaxies, and Devereux & Young (1990), for 124 spiral galaxies from the survey of Kennicutt & Kent (1983), on the other hand, find no significant difference in the regions where the early- and late-type spiral galaxies are located on their equivalent plots.
Figure 8 contains histograms of the ratio of the FIR SFR (as calculated using Equation 4) to the H SFR for different galaxy morphologies. The difference between early and late types is immediately clear. The 22 early-type spirals (S0/a-Sab) display the largest scatter, but clearly show the highest IRAS/HGS SFR ratios. For later types, this ratio systematically decreases. The mean ratios and their standard errors are given in the top row of Table 8. The trend is the same as that seen by Sauvage & Thuan (1992), but much stronger than that found by Devereux & Young (1990) and Young et al. (1996).
| S0/a-Sab | Sb-Sc | Scd-Sm | Im | S0/a-Im | |
|---|---|---|---|---|---|
| mean , (H) = 1.1 | 3.170.91 | 1.290.09 | 0.860.05 | 0.620.06 | 1.280.13 |
| mean , variable (H) | 2.180.66 | 0.890.06 | 0.780.05 | 1.180.11 | 1.050.09 |
| 22 | 70 | 62 | 24 | 178 |


In addition to contributions from the old stellar populations, there are several other possible causes of the observed decrease in SFR(IRAS)/SFR(HGS) along the Hubble sequence. Figure 6 shows that the H extinction is higher in early-type spiral galaxies and falls off towards the latest types. The H luminosities used to calculate the SFRs here have all been corrected by the same extinction factor ((H)=1.1 mag), irrespective of galaxy type. If we have underestimated the extinction in early-type galaxies, then the H luminosities will also be underestimated and the observed SFR(IRAS)/SFR(HGS) will be too high. The converse is true for the late types. Kewley et al. (2002) compare IR and H SFRs for a sample of 93 galaxies before and after correcting each galaxy individually for extinction. Before corrections they find the same trend as above, but after the corrections are applied they find that the SFR(IR)/SFR(H) ratios for early and late types are approximately equal.
The results of replacing the standard 1.1 mag correction in the HGS sample with the corrections suggested by the UCM data in Section 4.3, i.e. 1.5 mag for S0/a-Sc, 1.2 mag for Scd-Sm and 0.4 mag for Im galaxies, can be seen in Fig. 8 and in the second row of Table 8. From these results, simple type-dependent extinction corrections seem to be an improvement on a global correction.

A further point related to the type-dependent extinctions is that the galaxies with lower optical extinctions may also experience a lower efficiency of converting stellar light into FIR emission, as predicted by the models of Charlot & Longhetti (2001), and confirmed observationally by Hirashita et al. (2003). This should imply a residual correlation between SFR(IRAS)/SFR(H) and galaxy luminosity, even after correction of H fluxes for type-dependent extinction, in the sense that low-luminosity galaxies will have anomalously low SFR(IRAS) values. Also, as mentioned by Hirashita et al. (2003), the SFR(IRAS) values for luminous early-type galaxies may be boosted by a component due to dust heating by the strong older stellar population in these galaxies. Figure 9 is a replotting of Fig. 7, but with the H SFR corrected for type-dependent extinction, which provides a test of these predictions. The regression fit to the points has a slope of 1.088, confirming that the type-dependent extinction corrections have reduced the difference between the two estimators of SFR, and significantly reduced the scatter. However, there is still a clear underprediction of SFR from FIR fluxes for the lower luminosity spiral and irregular galaxies; this underprediction becomes less marked for brighter spiral galaxies, and there is indeed evidence for excess FIR emission in some of the brighter early-type galaxies. Thus Fig. 9 gives good qualitative agreement with the predictions of Charlot & Longhetti (2001) and Hirashita et al. (2003).
5.5 Constraints on deeply embedded star formation in normal galaxies
The results described in Section 5.4 also argue against there being a dominant deeply-embedded star formation component in a significant fraction of the normal galaxy population sampled by this study. Such a population would power a far-IR flux excess, accompanied by little or no H emission, and would result in a tail of galaxies lying to the right of the main peaks shown in Fig. 8. Few such galaxies are observed, although some caveats should be noted. Firstly, Fig. 8 does show a significant fraction of galaxies with far-IR excesses up to 0.4 dex, or a factor 2.5 relative to the mean ratio for each type. This is particularly true for the S0/a–Sab galaxies. Thus we cannot exclude the possibility that a significant minority of our galaxies have up to half of their star formation in a deeply embedded component. Secondly, we do not model the absolute ratio of far-IR to H flux, so it is possible that all galaxies have a significant embedded star formation component, and for some reason this is always present in the same ratio to the component that is visible in the H line. Indeed, Charlot et al. (2002) use modelling of the H and far-IR emission from star forming galaxies to conclude that H-based measurements of star formation rates underestimate the true value by a factor 3, compared with far-IR measurements. However, the principal reason they find for this is the absorption of ionizing photons within star formation regions, rather than the presence of a dominant embedded component. It is also interesting to note that Dopita et al. (2002) find that H measurements provide a reliable estimate of total star formation rates even in luminous and ultraluminous interacting and merging galaxies, as long as optical spectroscopic data is available to enable removal of active nuclear components, and to give corrections for reddening and [Nii] contamination. Given this, it is not surprising that we have found good consistency between far-IR and H star formation rates for the more normal galaxies in the present sample, which have had similar corrections applied. This lack of dominant deeply-embedded star formation components has also been demonstrated by the comparison of UV and FIR emission by, for example, Buat et al. (1999) and Hirashita et al. (2003). It should be stressed that this has only been demonstrated in the local Universe and may well not be valid at high redshifts.
6 Conclusions
We have studied the two major corrections which need to be applied to narrow-band H fluxes from galaxies in order to convert them to SFRs, i.e. [Nii] contamination removal and correction for extinction internal to the galaxy in question.
-
From an imaging study using carefully-chosen narrow-band filters, we find that the [Nii] emission is generally very differently distributed to the H emission, and that in particular nuclear measurements (e.g. from slit spectroscopy) can significantly over-estimate the contribution of [Nii] to total narrow-band fluxes. In most star formation regions in galaxy disks, the [Nii] fraction is small or negligible, and [Nii] corrections applied in most previous studies may significantly under-estimate disk star formation rates as a result.
-
We estimate the extinction towards star formation regions in spiral galaxies from Br/H line ratios. The main results from this study are that extinctions are larger for regions in galaxy nuclei compared with those in disks; disk extinction values are similar to those derived from optical emission-line ratios; and there is no evidence for heavily dust-embedded regions emerging in the near-IR, which would be invisible at H. However, the numbers of galaxies and individual regions detected using this method are small, and we thus exploit optical emission-line data for the UCM study to derive global H extinction values as a function of galaxy type and inclination.
-
We find evidence supporting the overall size of corrections (1 mag.) applied by previous authors, and determine typical extinctions to be smaller for late-type dwarfs than for spiral types.
-
We show that the application of type-dependent extinction corrections derived here significantly improves the agreement between star formation rates calculated using H fluxes and those from far-IR fluxes as measured by the IRAS satellite.
-
These findings support the idea that heavily dust-embedded star formation, which would be underestimated using the H technique, is not a dominant contributor to the total star formation rate of most galaxies.
Acknowledgements.
The Jacobus Kapteyn and William Herschel Telescopes are operated on the island of La Palma by the Isaac Newton Group in the Spanish Observatorio del Roque de los Muchachos of the Instituto de Astrofísica de Canarias. The United Kingdon Infrared Telescope is operated by the Joint Astronomy Centre on behalf of the U.K. Particle Physics and Astronomy Research Council. This research has made use of the NASA/IPAC Extragalactic Database (NED) which is operated by the Jet Propulsion Laboratory, California Institute of Technology, under contract with the National Aeronautics and Space Administration. The referee, Dr V. Buat, is sincerely thanked for her many helpful comments and suggestions.References
- Baldwin et al. (1981) Baldwin, J. A., Phillips, M. M., & Terlevich, R. 1981, PASP, 93, 5
- Buat & Deharveng (1988) Buat, V. & Deharveng, J. M. 1988, A&A, 195, 60
- Buat et al. (1999) Buat, V., Donas, J., Milliard, B., & Xu, C. 1999, A&A, 352, 371
- Buat & Xu (1996) Buat, V. & Xu, C. 1996, A&A, 306, 61
- Burbidge & Burbidge (1962) Burbidge, E. M. & Burbidge, G. R. 1962, ApJ, 135, 694
- Burstein & Heiles (1982) Burstein, D. & Heiles, C. 1982, AJ, 87, 1165
- Calzetti et al. (1996) Calzetti, D., Kinney, A. L., & Storchi-Bergmann, T. 1996, ApJ, 458, 132
- Caplan & Deharveng (1986) Caplan, J. & Deharveng, L. 1986, A&A, 155, 297
- Caplan et al. (1996) Caplan, J., Ye, T., Deharveng, L., Turtle, A. J., & Kennicutt, R. C. 1996, A&A, 307, 403
- Cardelli et al. (1989) Cardelli, J. A., Clayton, G. C., & Mathis, J. S. 1989, ApJ, 345, 245
- Charlot et al. (2002) Charlot, S., Kauffmann, G., Longhetti, M., et al. 2002, MNRAS, 330, 876
- Charlot & Longhetti (2001) Charlot, S. & Longhetti, M. 2001, MNRAS, 323, 887
- Cram et al. (1998) Cram, L., Hopkins, A., Mobasher, B., & Rowan-Robinson, M. 1998, ApJ, 507, 155
- Devereux & Hameed (1997) Devereux, N. A. & Hameed, S. 1997, AJ, 113, 599
- Devereux et al. (1995) Devereux, N. A., Jacoby, G., & Ciardullo, R. 1995, AJ, 110, 1115
- Devereux et al. (1994) Devereux, N. A., Price, R., Wells, L. A., & Duric, N. 1994, AJ, 108, 1667
- Devereux & Young (1990) Devereux, N. A. & Young, J. S. 1990, ApJ, 350, 25
- Domingue et al. (2000) Domingue, D. L., Keel, W. C., & White, R. E. 2000, ApJ, 545, 171
- Dopita et al. (2002) Dopita, M. A., Pereira, M., Kewley, L. J., & Capaccioli, M. 2002, ApJS, 143, 47
- Filippenko & Sargent (1988) Filippenko, A. V. & Sargent, W. L. W. 1988, ApJ, 324, 134
- Gallego et al. (1995) Gallego, J., Zamorano, J., Aragon-Salamanca, A., & Rego, M. 1995, ApJ, 455, 1
- Gallego et al. (1996) Gallego, J., Zamorano, J., Rego, M., Alonso, O., & Vitores, A. G. 1996, A&AS, 120, 323
- Gavazzi et al. (2004) Gavazzi, G., Zaccardo, A., Sanvito, G., Boselli, A., & Bonfanti, C. 2004, A&A, 417, 499
- Hameed & Devereux (1999) Hameed, S. & Devereux, N. 1999, AJ, 118, 730
- Han (1992) Han, M. 1992, ApJ, 391, 617
- Helou et al. (1988) Helou, G., Khan, I. R., Malek, L., & Boehmer, L. 1988, ApJS, 68, 151
- Hirashita et al. (2003) Hirashita, H., Buat, V., & Inoue, A. K. 2003, A&A, 410, 83
- Ho et al. (1990) Ho, P. T. P., Beck, S. C., & Turner, J. L. 1990, ApJ, 349, 57
- James et al. (2004) James, P. A., Shane, N. S., Beckman, J. E., et al. 2004, A&A, 414, 23
- Jansen et al. (2000) Jansen, R. A., Fabricant, D., Franx, M., & Caldwell, N. 2000, ApJS, 126, 331
- Kaufman et al. (1987) Kaufman, M., Bash, F. N., Kennicutt, R. C., & Hodge, P. W. 1987, ApJ, 319, 61
- Kawara et al. (1989) Kawara, K., Nishida, M., & Phillips, M. M. 1989, ApJ, 337, 230
- Keel (1983) Keel, W. C. 1983, ApJS, 52, 229
- Kennicutt et al. (1994) Kennicutt, R., Tamblyn, P., & Congdon, C. 1994, ApJ, 435, 22
- Kennicutt (1983) Kennicutt, R. C. 1983, ApJ, 272, 54
- Kennicutt (1992) Kennicutt, R. C. 1992, ApJ, 388, 310
- Kennicutt (1998) Kennicutt, R. C. 1998, ARA&A, 36, 189
- Kennicutt & Kent (1983) Kennicutt, R. C. & Kent, S. M. 1983, AJ, 88, 1094
- Kewley et al. (2002) Kewley, L. J., Geller, M. J., Jansen, R. A., & Dopita, M. 2002, AJ, in press, astro-ph/0208508
- Lonsdale Persson & Helou (1987) Lonsdale Persson, C. J. & Helou, G. 1987, ApJ, 314, 513
- McQuade et al. (1995) McQuade, K., Calzetti, D., & Kinney, A. L. 1995, ApJS, 97, 331
- Moshir et al. (1992) Moshir, M., Kopman, G., & Conrow, T. A. O. 1992, IRAS Faint Source Survey, Explanatory supplement version 2 (Pasadena: Infrared Processing and Analysis Center, California Institute of Technology)
- Niklas et al. (1997) Niklas, S., Klein, U., & Wielebinski, R. 1997, A&A, 322, 19
- Nilson (1973) Nilson, P. 1973, Uppsala general catalogue of galaxies (Acta Universitatis Upsaliensis. Nova Acta Regiae Societatis Scientiarum Upsaliensis - Uppsala Astronomiska Observatoriums Annaler, Uppsala: Astronomiska Observatorium, 1973)
- Osterbrock (1989) Osterbrock, D. E. 1989, Astrophysics of gaseous nebulae and active galactic nuclei (University Science Books)
- Pérez-González et al. (2001) Pérez-González, P. G., Gallego, J., Zamorano, J., & Gil de Paz, A. 2001, A&A, 365, 370
- Pérez-González et al. (2003) Pérez-González, P. G., Gil de Paz, A., Zamorano, J., et al. 2003, MNRAS, 338, 508
- Packham et al. (2003) Packham, C., Thompson, K. L., Zurita, A., et al. 2003, MNRAS, 345, 395
- Peimbert (1968) Peimbert, M. 1968, ApJ, 154, 33
- Rubin & Ford (1986) Rubin, V. C. & Ford, K. W. 1986, ApJ, 305, 35
- Sauvage & Thuan (1992) Sauvage, M. & Thuan, T. X. 1992, ApJ, 396, 69
- Schechter (1980) Schechter, P. L. 1980, AJ, 85, 801
- Shane (2002) Shane, N. S. 2002, PhD thesis, Liverpool John Moores University
- Stauffer & Bothun (1984) Stauffer, J. R. & Bothun, G. D. 1984, AJ, 89, 1702
- Tresse & Maddox (1998) Tresse, L. & Maddox, S. J. 1998, ApJ, 495, 691
- Tresse et al. (2002) Tresse, L., Maddox, S. J., Le Fèvre, O., & Cuby, J.-G. 2002, MNRAS, 337, 369
- Valentijn (1994) Valentijn, E. A. 1994, MNRAS, 266, 614
- van der Hulst et al. (1988) van der Hulst, J. M., Kennicutt, R. C., Crane, P. C., & Rots, A. H. 1988, A&A, 195, 38
- Vitores et al. (1996a) Vitores, A. G., Zamorano, J., Rego, M., Alonso, O., & Gallego, J. 1996a, A&AS, 118, 7
- Vitores et al. (1996b) Vitores, A. G., Zamorano, J., Rego, M., Gallego, J., & Alonso, O. 1996b, A&AS, 120, 385
- Young et al. (1996) Young, J. S., Allen, L., Kenney, J. D. P., Lesser, A., & Rownd, B. 1996, AJ, 112, 1903
- Zamorano et al. (1996) Zamorano, J., Gallego, J., Rego, M., Vitores, A. G., & Alonso, O. 1996, ApJS, 105, 343
- Zamorano et al. (1994) Zamorano, J., Rego, M., Gallego, J. G., et al. 1994, ApJS, 95, 387