A highly-ionized absorber in the X-ray binary 4U 132362: a new explanation for the dipping phenomenon
We report the detection of narrow Fe xxv and Fe xxvi X-ray absorption lines at keV and keV in the persistent emission of the dipping low-mass X-ray binary 4U 132362 during a 2003 January XMM-Newton observation. These features are superposed on a broad emission feature centered on keV. During dipping intervals the equivalent width of the Fe xxv feature increases while that of the Fe xxvi feature decreases, consistent with the presence of less strongly ionized material in the line-of-sight. As observed previously, the changes in the 1.0–10 keV spectrum during dips are inconsistent with a simple increase in absorption by cool material. However, the changes in both the absorption features and the continuum can be modeled by variations in the properties of an ionized absorber. No partial covering of any component of the spectrum, and hence no extended corona, are required. From persistent to deep dipping the photo-ionization parameter, , expressed in erg cm s-1, decreases from of to of , while the equivalent hydrogen column density of the ionized absorber increases from () 1022 atoms cm-2 to () 1022 atoms cm-2. Since highly-ionized absorption features are seen from many other dip sources, this mechanism may also explain the overall changes in X-ray spectrum observed during dipping intervals from these systems.
Key Words.:
Accretion, accretion disks – Stars: individual: 4U 132362 – X-rays: general1 Introduction
4U 132362 is a faint (3–10 mCrab) low-mass X-ray binary (LMXB) which exhibits X-ray bursts and 2.94 hour periodic intensity dips. The source was first detected by Uhuru and Ariel V (Forman et al. 1978; Warwick et al. 1981) and the dips and bursts were discovered using EXOSAT (van der Klis et al. 1985; Parmar et al. 1989). From the burst properties, the distance of 4U 132362 was constrained to be between 10–20 kpc (Parmar et al. 1989). During the dips, which typically last for 30% of the orbital cycle, the 1–8 keV intensity varies irregularly with a minimum of 50% of the average value outside of the dips. These dips are believed to be due to obscuration in the thickened, azimuthally structured, outer regions of an accretion disk (White & Swank 1982). The presence of periodic dips indicates that the source is viewed relatively close to edge-on, at an inclination angle, , of 60–80∘ (Frank et al. 1987), where is defined as the angle between the line-of-sight and the rotation axis of the accretion disk.
The BeppoSAX 1.0–150 keV spectrum of the 4U 132362 persistent emission can be modeled by a cutoff power-law with a photon index, , of and a folding energy, , of keV together with a blackbody with a temperature of keV which contributes 15% of the 2–10 keV flux (Bałucińska-Church et al. 1999). From observations with the RXTE Proportional Counter Array, Barnard et al. (2001) report the presence of a keV Fe emission feature with an equivalent width, , of eV. Quasi-periodic oscillations at 1 Hz were discovered in the persistent emission, dips, and bursts by Jonker et al. (1999). Radial intensity profiles from the imaging Medium-Energy Concentrator Spectrometer on BeppoSAX indicate the presence of a substantial dust halo around the source (Barnard et al. 2001). Such an intense halo is not unexpected since 4U 132362 is located close to the galactic plane () and its emission is absorbed by interstellar material in the line-of-sight equivalent to H atoms cm-2. This high absorption probably also explains why the IR counterpart is undetected at optical wavelengths (Smale 1995).
The 1–10 keV spectra of most of the dip sources, including 4U 132362, become harder during dipping. However, these changes are inconsistent with a simple increase in photo-electric absorption by cool material, as an excess of low-energy photons is usually present. Two approaches have been used to model this spectral evolution. Initially, in the “absorbed plus unabsorbed” approach (e.g., Parmar et al. 1986) the persistent (non-dipping) spectral shape was used to model spectra from dipping intervals. It was included with, and without, additional absorption. The spectral evolution during dipping was accounted for by a large increase in the column density of the absorbed component, and a decrease of the normalization of the unabsorbed component. The latter decrease was attributed to electron scattering in the absorber. More recently, in the “progressive covering”, or “complex continuum” approach (e.g., Church et al. 1997), the X-ray emission is assumed to originate from a point-like blackbody, or disk-blackbody component, together with a power-law component from an extended corona. This approach models the spectral changes during dipping intervals by the partial and progressive covering of the extended component by an opaque neutral absorber. The absorption of the point-like component is allowed to vary independently from that of the extended component. This approach has been successfully applied to a number of dipping LMXBs including 4U 132362 (Bałucińska-Church et al. 1999; Barnard et al. 2001).
The improved sensitivity and spectral resolution of Chandra and XMM-Newton is allowing narrow absorption features from highly ionized Fe and other metals to be observed from a growing number of X-ray binaries. In particular, Fe xxv (He-like) or Fe xxvi (H-like) 1s-2p resonant absorption lines near 7 keV were reported from the micro-quasars GRO J165540 (Ueda et al. 1998; Yamaoka et al. 2001), GRS 1915+105 (Kotani et al. 2000; Lee et al. 2002) and H 1743322 (Miller et al. 2004), and from the neutron star systems Cir X1 (Brandt et al. 1996; Brandt & Schulz 2000; Schulz & Brandt 2002), GX 13+1 (Ueda et al. 2001; Sidoli et al. 2002; Ueda et al. 2004), MXB 1658298 (Sidoli et al. 2001), X 1624490 (Parmar et al. 2002), X 1254690 (Boirin & Parmar 2003) and XB 1916053 (Boirin et al. 2004). The lines from Cir X1, GX 13+1 and H 1743322 are blue-shifted, indicating that the highly ionized plasma is an outflow in these sources. The systems that exhibit the Fe xxv and Fe xxvi features are mainly dipping sources (see Table 5 of Boirin et al. 2004). The lack of any orbital phase dependence of the features (except during dips) suggests that the absorbing plasma is located in a thin cylindrical geometry around the compact object. Such highly ionized plasma is probably a common feature of accreting binaries, but is preferentially detected in the dipping sources, presumably due to being viewed at inclination angles within of the orbital plane.
Here, we report the detection of narrow Fe xxv and Fe xxvi 1s-2p X-ray absorption lines from the dipping LMXB 4U 132362. These features are independently reported by Church et al. (2005). We show that the lines are associated with an ionized absorber which has different properties during persistent and dipping intervals. We demonstrate that these differences can account for the broad-band spectral changes observed between persistent and dipping intervals.
2 Observation and data analysis
2.1 Data reduction
The XMM-Newton Observatory (Jansen et al. 2001) includes three 1500 cm2 X-ray telescopes each with an European Photon Imaging Camera (EPIC) at the focus. Two of the EPIC imaging spectrometers use MOS CCDs (Turner et al. 2001) and one uses PN CCDs (Strüder et al. 2001). Reflection Grating Spectrometers (RGS, den Herder et al. 2001) are located behind two of the telescopes. 4U 132362 was observed by XMM-Newton for 50 ks on 2003 January 29 between 09:05 and 22:58 UTC. The thin optical blocking filter was used with the EPIC cameras. The EPIC PN and MOS1 cameras were operated in timing mode. The EPIC MOS2 camera was operated in full window mode. As the MOS2 full window mode data is strongly affected by pile-up and MOS1 timing mode data is currently not well calibrated, we concentrate on the analysis of PN data. We note that the PN CCD is more sensitive to the presence of lines than the MOS CCDs with an effective area a factor 5 higher at 7 keV and a better energy resolution. RGS data from both gratings in first and second order were also used. All data products were obtained from the XMM-Newton public archive and reduced using the Science Analysis Software (SAS) version 5.4.1. No intervals of enhanced solar activity were present.
In PN timing mode, only one PN CCD chip (corresponding to a field of view of 13644) is used and the data from that chip are collapsed into a one-dimensional row (44) to be read out at high speed. This allows a time resolution of 30 s, and photon pile-up occurs only for count rates 1500 counts s-1. Only single and double events (patterns 0 to 4) were selected. Source events were extracted from a 53′′ wide column centered on the source position (RAWX 30 to 43). Background events were obtained from a column of the same width, but centered 115′′ from 4U 132362 (RAWX 2 to 15). The latest response matrix file for the PN timing mode provided by the XMM-Newton calibration team (epn_ti40_sdY9.rsp, released in 2003 January), was used. Ancillary response files were generated using the SAS task arfgen. EPIC PN spectra were rebinned to oversample the full-width at half-maximum () of the energy resolution by a factor 3, and to have a minimum of 25 counts per bin to allow the use of the statistic.

The SAS task rgsproc was used to produce calibrated RGS event lists, spectra, and response matrices. The RGS spectra do not show evidence for any narrow spectral features. Therefore, they were mainly used to check for consistency with the PN spectra and to better constrain the low-energy part of the spectrum. They were rebinned to have a minimum of 25 counts per bin.
2.2 Spectral analysis
In order to check for consistency between the different instruments, we first examined the spectrum of the entire observation. Since this includes persistent, dipping and bursting intervals, it is of limited scientific interest. We combined the four 0.3–1.7 keV RGS spectra (RGS1 and RGS2, orders 1 and 2) and the 0.6–10 keV PN spectrum. We fit them with a model consisting of a blackbody and a power-law, both modified by photo-electric absorption from neutral material. A constant factor, fixed to 1 for the PN spectrum, but allowed to vary for each RGS spectrum, was included multiplicatively in order to account for cross-calibration uncertainties. The residuals from the best-fit model are shown in Fig. 1. The fit is unacceptable (reduced , , of 2.7 for 431 degrees of freedom, d.o.f.), due mainly to the presence of strong absorption lines near 7 keV superposed on a broad emission feature and a significant excess in the PN spectrum near 1 keV, which is not detected in the RGS. Since this feature may have an instrumental origin, we concentrate on the spectral structure near 7 keV in this paper.
Therefore, we use EPIC PN spectra only in the energy range 1.7–10 keV. We include RGS spectra (RGS1 and RGS2, orders 1 and 2) to better constrain the low-energy spectral shapes of the average of the persistent, shallow and deep dipping intervals (Sect. 3.2). We restrict the RGS energy range to 1.0–1.7 keV because very few source events are detected below 1 keV. When the data are further divided (Sect. 3.3), the RGS count rate of the individual segments becomes too low for the spectra to be useful and only PN data are used. In either case, since there is no evidence for any narrow features in the RGS spectra, only the PN spectra are plotted to improve clarity.
Spectral analysis was performed using XSPEC (Arnaud 1996) version 11.2, and SPEX package (Kaastra et al. 1996) version 2.00.09. The photo-electric cross sections of Morrison & McCammon (1983) are used throughout to account for absorption by neutral gas with solar abundances (Anders & Grevesse 1989, abs model within SPEX, and wabs model in XSPEC). Spectral uncertainties are given using of 2.71, corresponding to 90% confidence for one interesting parameter, and to 95% confidence for upper limits. The values obtained from SPEX are calculated using estimated errors on the model rather than errors on the data (see the SPEX user’s manual). All s are quoted with positive values both for absorption and emission features.


2.3 Narrow absorption features
The narrow absorption features evident near 7 keV were accounted for by including a photo-ionized absorber in the spectral model. We use the xabs model of SPEX, which treats, in a simplified manner, the absorption by a thin slab composed of different ions, located between the ionizing source and the observer. The xabs model assumes that the angle subtended by the slab as seen from the ionizing source is small. Therefore, emission from the slab and scattering by the slab of the ionizing source into the line-of-sight are neglected, and only absorption and scattering out of the line-of-sight by the slab are considered. The processes taken into account are the continuum and the line absorption by the ions and (from SPEX version 2.00.09) scattering out of the line-of-sight by the free electrons in the slab. The transmission, , of the slab is calculated as , where and are the total continuum and line optical depth, respectively, and is the electron scattering optical depth. The relativistic energy-dependent Klein-Nishina correction is applied to compute , but the classical Thomson approximation is valid below 10 keV where we will examine the spectra. Therefore, , with the Thomson cross-section and the electron column density, and this scattering term is energy independent. On the contrary, and are energy dependent. Most continuum opacities are taken from Verner & Yakovlev (1995), while line opacities and wavelengths for most ions are taken from Verner et al. (1996) (see the details and additional references in the SPEX user’s manual). is a function of and which are free parameters of xabs. is the average systematic velocity shift of the absorber, in km s-1. Negative and positive values of correspond to blue and red shifts, respectively. is the turbulent velocity broadening of the absorber in km s-1, defined as , where is the total width of a line and the thermal contribution. is also a function of the optical depth of each individual line, , and thus of the column density of each ion. However, in xabs, the relative column densities of the ions are coupled through a photo-ionization model, so that only two free parameters are introduced: and . is the equivalent hydrogen column density of the ionized absorber in units of atoms cm-2. is the ionization parameter of the absorber defined as , where is the luminosity of the ionizing source, the electron density of the plasma and the distance between the slab and the ionizing source. is expressed in units of erg cm s-1, but we will omit the units when quoting values in this paper. Using codes such as XSTAR (Kallman & Bautista 2001) or CLOUDY (Ferland 2003), and assuming a broad-band ionizing continuum from infra-red to hard X-rays, the ionic column densities of a photo-ionized slab can be pre-calculated for different values of . During the fitting process, SPEX reads in the grid of pre-calculated ionic column densities and finds the best set and consequently the best-fit values for and . and are linked self-consistently to these two parameters, respectively, via the photo-ionization model.
In this paper, we use a grid of ionic column densities pre-calculated using CLOUDY and assuming that the ionizing continuum may be represented by a cutoff power-law with of 44 keV, as measured in the BeppoSAX spectrum of 4U 132362 (Bałucińska-Church et al. 1999), and with of 1.96. This value of was obtained by fitting simultaneously the EPIC PN and RGS persistent spectra of 4U 132362 by an absorbed cutoff power-law with fixed to 44 keV (although better fits are obtained with multi-component modeling, see e.g. Sect. 3.2).
The approach followed using xabs can be considered as a first attempt to include physics when modeling the absorption features. Although the assumed geometry is a very simple one, a strong advantage of xabs is that all relevant ions are automatically taken into account and their relative column densities are coupled in a physical way. Since ions having small cross-sections can contribute significantly to the absorption when combined, and since absorption features can be blended, xabs represents a strong improvement over the approach consisting in accounting for each apparent absorption feature individually in a spectrum. Nevertheless, in order to give a more objective description of the absorption features, we also fit the most prominent ones with Gaussian line profiles using XSPEC.
The effects of assuming a different ionizing continuum on our results and the importance of line re-emission into the line-of-sight are estimated in Appendix A.
| Persistent | Dipping | |
|---|---|---|
| Shallow | Deep | |
| 0.83–1.01 | 1.01–1.08 | |
| 1.20–1.86 | 1.86–2.02 | 2.02–2.10 |
| 2.12–2.85 | 2.85–3.02 | 3.02–3.12 |
| 3.20–3.80 | 3.80–4.08 | 4.08–4.15 |
| 4.20–4.80 | 4.80–5.06 | 5.06–5.14 |
| 5.20–5.60 | ||
3 Results
3.1 Lightcurve and hardness-intensity diagram
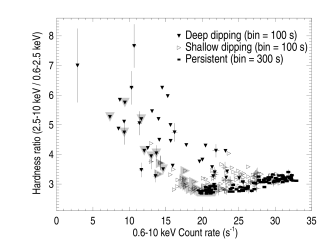
The EPIC PN 0.6–10 keV lightcurve is shown in Fig. 2 (panels a and b) with a binning of 40 s. Panel c shows the hardness ratio (counts in the 2.5-10 keV energy range divided by those between 0.6–2.5 keV) also with a binning of 40 s. Times are not barycenter-corrected. The cycle number is indicated on the top axis. This was determined from the reference time of 9.57 hr on 2003 January 29 (corresponding to an XMM-Newton time of 160209470.4 s) visually estimated as the dip center time, and using a period of 2.938 hr (Bałucińska-Church et al. 1999). Integer values of the cycle number correspond to phase 0, or estimated dip mid-times. This convention differs from the one adopted in X-ray binaries showing both periodic dips and total eclipses, where phase 0 is usually chosen as the mid eclipse time. Fig. 4 shows the hardness ratio as a function of the 0.6–10 keV count rate.


Seven X-ray bursts are observed. Two of them occur during dipping, near cycles 3.9 and 4.9. Five dips are visible. Fig. 3 shows an expanded view of the second and third bursts with a time resolution of 1 s and of two dips with a time resolution of 8 s. The dip shape varies from dip to dip. However, the dips seem to follow a repetitive pattern. The intensity first decreases while the hardness ratio remains more or less constant, and at some point, both the intensity and the hardness ratio become highly variable on timescales between tens of seconds and minutes. The deepest segments of the dips are clearly associated with the strongest hardening (Fig. 4). We refer to the first and second part of this pattern as “shallow” and “deep” dipping, respectively, and select intervals corresponding to persistent, shallow dipping and deep dipping emission as indicated in Table 1. The 0.6–10 keV persistent intensity (outside the dips and the bursts) of 4U 132362 increases slowly throughout the observation from 20 to 32 counts s-1 and then decreases at the end (Fig. 2b). The hardness ratio of the persistent emission increases in correlation with the intensity from 2.7 to 3.3 (Fig. 4). The burst frequency seems to increase with the intensity of the persistent emission. A time-resolved spectral analysis indicates that none of the bursts show evidence for photospheric radius expansion.
3.2 Persistent, shallow and deep dipping spectra
We extracted EPIC PN and RGS spectra for each category of emission (Table 1), excluding X-ray bursts. Spectral analysis was performed on combined PN and RGS spectra, as described in Sect. 2.2. A blackbody plus power-law model modified by neutral absorption (abs*(pl+bb) model within SPEX) fits the overall continuum reasonably well in all three cases. Examination of the spectral residuals reveals narrow absorption features around 7 keV, superposed on a broader emission feature. To account for this complexity, we included a broad Gaussian emission feature (gau) and absorption from a photo-ionized plasma (xabs, see Sect. 2.3) in the model. The best-fit parameters of the abs*xabs*(pl+bb+gau) are given in Table 2 and the ionized absorber further described in Appendix A. Figs. 5 and 6 show the best-fit model and residuals. The 7 keV features are very well modeled.
In all three cases, the continuum can be well described by a power-law with a photon index of 1.9, a blackbody with a temperature, , of 1 keV and a Gaussian emission feature centered on 6.6 keV with a of 1.1–2 keV. The contribution of the power-law to the total 0.5–10 keV luminosity is 88%. The broad Gaussian emission feature is detected at a confidence level of 8.3, 5 and 2.5, in the persistent, shallow and deep dipping spectrum, respectively. The hydrogen column density, , is 3.5–3.9 1022 atoms cm-2. The parameters describing the persistent, shallow dipping and deep dipping continua are consistent with each other at the 90% confidence level.

| Component | Pers. | Dipping | |
|---|---|---|---|
| Parameter | Shallow | Deep | |
| abs | |||
| ( cm-2) | 3.5 | 3.6 | 3.9 |
| xabs | |||
| ( cm-2) | 3.6 | 6 | 14 |
| (erg cm s-1) | 3.90 | 3.6 | 3.0 |
| (km s-1) | 1700 1000 | 600 | 90 |
| (km s-1) | -20 | 0 | 0 |
| pl | |||
| 1.90 | 1.9 0.1 | 1.8 | |
| ( ph. s-1 keV-1) | 9 | 10 2 | 10 |
| bb | |||
| (keV) | 0.98 | 1.1 0.1 | 1.2 |
| ( cm2) | 6 | 4 | 2 |
| gau | |||
| (keV) | 6.6 | 6.9 0.2 | 6.4 |
| (keV) | 2.0 | 1.3 | 1.1 |
| (1042 ph s-1) | 5 | 3 | 3 |
| (10-10 erg cm-2 s-1) | 1.97 | 1.76 | 1.27 |
| (1036 erg s-1) | 5.19 | 4.75 | 3.90 |
| / (%) | 88.3 | 87.5 | 87.3 |
| / (%) | 10.7 | 11.9 | 11.9 |
| / (%) | 1.0 | 0.6 | 0.8 |
| 1.13 | 1.19 | 0.95 | |
| d.o.f. | 315 | 235 | 207 |
| Exposure (ks) | 30.4 | 10.8 | 4.2 |
In contrast, the properties of the ionized absorber show an evolution from persistent to deep dipping (except for which is poorly constrained due to the limited energy resolution). The hydrogen column density of the ionized absorber, , increases marginally from () 1022 atoms cm-2 to () 1022 atoms cm-2, while the photo-ionization parameter decreases significantly from persistent, with of , to deep dipping with of . The strongest lines in the persistent spectrum are the Fe xxv and Fe xxvi 1s-2p ones (see Fig. 6 and Table 7). During shallow dipping, the of the Fe xxv line increases while that of Fe xxvi decreases. In the deep dipping stage, the Fe xxvi line has become weak, and the observed absorption feature at 6.60 keV is due to a blend of Fe xxv to Fe xxi lines. Therefore, the spectral differences in the narrow absorption features between persistent and dipping emission can be modeled by the presence of an ionized absorber with a higher column density and lower ionization parameter during dipping intervals.

decreases from to km s-1, from persistent to deep dipping. Fig. 7 shows the confidence contours of versus for the persistent, shallow dipping and deep dipping spectra. In the persistent spectrum, is well constrained whereas is poorly constrained. This is evidence for the absorption lines being unsaturated, i.e. on the linear part of the curve of growth, where their s increase linearly with the column density, independently of the velocity broadening. On the contrary, in the deep dipping spectrum, is poorly constrained whereas is well constrained. This indicates that the lines are saturated: their s do not strongly depend on the column density anymore, but rather increase with the velocity broadening.
Fig. 8 shows the transmission of the ionized and neutral absorbers individually, and the total transmission for the persistent, shallow and deep dipping spectra fit with the model described in Table 2. The transmission of the ionized absorber is nearly unity for the persistent emission. Only the Fe xxv and Fe xxvi lines are strongly evident. The number of lines increases from the persistent to the deep dipping stage. In addition, due to the continuum opacity of the ions, the continuum transmission becomes highly affected, particularly between 1.5–4 keV. This effect contributes strongly to the change in spectral ratio between the persistent and dipping intervals.
Table 3 shows the best-fit parameters of the most prominent absorption features fit with simple Gaussian profiles. Table 4 shows the upper limits on the and optical depth, , of non detected absorption lines and edges, respectively. The measured values and upper limits are all consistent with the values predicted by the photo-ionized absorber model (Tables 7 and 8). Note that, because of the limited spectral resolution, the measured s in Table 3 should be compared to the sum of the s of the various lines in Table 7 likely to contribute to the measured feature, i.e. the various lines whose energy is within the width of the measured feature.
| Persistent | Dipping | ||
| Shallow | Deep | ||
| Ident. | Fe xxv | Fe xxv | Fe xxi–xxv |
| (keV) | 6.68 0.04 | 6.68 0.03 | 6.60 0.02 |
| (eV) | 100 | 75 | 120 |
| (eV) | |||
| Ident. | Fe xxvi | ||
| 6.97 | |||
| 136 | |||
| Ident. | Energy | Persistent | Dipping | |
|---|---|---|---|---|
| (keV) | Shallow | Deep | ||
| Lines | (eV) | |||
| S xvi | 2.623 | 4 | 7 | 8 |
| Fe xxvi | 6.973 | 21 | 34 | |
| Fe xxv | 7.881 | 8 | 25 | 38 |
| Fe xxv | 8.296 | 8 | 17 | 25 |
| Edges | ||||
| Si xiv | 2.67 | 0.10 | ||
| Fe xxv | 8.83 | 0.02 | 0.04 | 0.06 |


There are fainter features remaining in the spectra. An absorption feature is visible in the persistent spectrum at keV and can be fit by a Gaussian with a width 330 eV and and of eV. A weak absorption line is predicted by xabs at 4.108 keV due to Ca xx (Table 7). However, this energy is inconsistent at a 3.3 level with that of the observed feature. Alternatively, a dramatic blue-shift of 9700 km s-1 would be required for the observed feature to be interpreted as Ca xx. This is incompatible with the blue-shift of 1020 km s-1 determined primarily from the strong Fe xxv and Fe xxvi absorption lines during persistent emission (Table 2). A 4.2 keV feature is also visible in the shallow and deep dipping spectra, and can be described by a Gaussian profile with parameters consistent with those obtained from the persistent spectrum. A broad “bump” near 3.5 keV is also present in all three spectra. Its origin is unclear, but it may be due to incorrect modeling of the nearby Au mirror edges connected with the structured residuals near 2.2 keV and 2.8 keV.
3.2.1 The broad Fe emission line
In order to investigate whether the large width ( keV, see Table 2) of the Gaussian emission feature detected at 6.6 keV could be due to relativistic effects, we modeled the line in the persistent spectrum using the Laor (1991) model. The resulting fit is acceptable ( of 1.16 for 311 d.o.f.), but not statistically better than the one obtained using a simple broad Gaussian line. Most of the parameters of the Laor model are poorly constrained. The Gaussian line energy is keV, and the normalization is 1042 ph s-1. The derived inner radius for the emitting region is G/c2 and the outer radius is 92 G/c2. The emissivity slope is , the emissivity scale 69 and the inclination . Thus, while the large width may be due to relativistic broadening, we cannot exclude that other broadening mechanisms such as Compton scattering and emission from a range of ionization states contribute to the broadening.
3.3 Time-resolved spectral fits
The results of Sect. 3.2 suggest that, to first order, the only change in the spectrum during dips is the appearance of an extra absorption component that affects the underlying “persistent” spectrum. A closer inspection of Figs. 2 and 4 shows, however, that the persistent flux is also changing on a long time scale and that the persistent hardness ratio is evolving in correlation with the flux. These secular spectral changes were not accounted for in Sect. 3.2. In this section, we want to test the hypothesis that the spectral changes observed between a persistent and a dipping segment can be explained uniquely by variations in the properties of the absorbers in the line-of-sight, as long as any secular spectral change attributed to the underlying source is taken into account.


To account for these secular changes in the persistent emission, we assumed that the neutral absorption remains constant, and we fixed it to our best-fit value of the average persistent spectrum (Table 2), = 3.5 1022 atoms cm-2, that we call the “galactic” value, although part of the neutral absorber might be located close to the binary system. We then fit the individual persistent spectra (Table 1) with the abs*xabs*(pl+bb+gau) model fixing to the galactic value. We also fixed , and the parameters of the Gaussian emission line to the values obtained for the average persistent spectrum (Table 2). Thus, the only parameters free to vary were , , , , and . The fits are acceptable, and the values of , , and obtained in this way for each of the individual persistent spectra are considered as our “reference values”.
Finally we fit all the individual spectra (persistent, shallow and deep dipping) using the abs*xabs*(pl+bb+gau) model. was allowed to vary, but , , and were fixed to the values obtained directly from the previous fits (the reference values) in the case of the persistent spectra, and to values interpolated from adjacent reference values in the case of the dipping spectra. Since the XMM-Newton observation started while 4U 132362 was probably dipping, the interpolated values for the first dip were taken equal to the reference values of the following persistent segment. was kept fixed to 0 for both the persistent and dipping segments. The energy and of the Gaussian emission line were fixed to the values obtained for the corresponding average spectra (Table 2), but its normalization was left free to vary.
| Persistent | Dipping | ||
|---|---|---|---|
| Shallow | Deep | ||
| ( cm-2) | |||
| ( cm-2) | |||
The results of this set of fits are shown in Fig. 9. The fit quality remains acceptable with between 0.75–1.13 for 153 to 184 d.o.f. In the individual segments, the values of , the normalization of the Gaussian emission line, and of are all found to be consistent with the values obtained from the average spectra.
The most interesting results concern , and , and are shown in the upper left panels of Fig. 9. For these parameters, the values obtained for the persistent and dipping segments form distinguishable and well constrained groups. The values for all persistent intervals are consistent with each other and have a weighted average of () 1022 atoms cm-2 (Table 5) in agreement with the galactic value, as expected. is significantly higher in the deep dipping intervals. The only exception comes from the deep dipping segment around cycle 3; this is probably due to the dipping activity being very deep for a short time, and resembling shallow dipping elsewhere (see Fig. 3). If we exclude this segment, the weighted average value of during deep dipping intervals is () 1022 atoms cm-2 (Table 5). This is larger than the persistent value at a 5.7 level, and represents an increase by a factor 1.2. In the shallow dipping intervals, is intermediate between the galactic and the deep dipping values.
shows the same behavior as , but the difference between the persistent and the dipping values is even more pronounced (note the logarithmic scale for this parameter in Fig. 9). The weighted averages for each emission category are listed in Table 5. is () 1022 atoms cm-2 during persistent segments and () 1022 atoms cm-2, a factor 10 higher, during deep dipping intervals. is intermediate during the shallow dipping and seems to increase with the count rate. The values obtained from the time-resolved spectral fits are significantly larger than those obtained from the average spectra. This is not unexpected and actually constitutes the main result of this time-resolved analysis. Indeed, in the average spectral analysis, all the parameters were free to vary, and spectral changes could be accounted for by a simultaneous moderate change of together with all the other parameters, including the normalizations of the additive components. On the contrary, in the time-resolved spectral analysis, the parameters of the additive components were fixed to their underlying persistent values, and the spectral changes from persistent to dipping intervals were forced to be accounted for only by larger amounts of absorbing material.
Finally, the values of can also be clearly distinguished between persistent and dipping segments. On average, is during persistent intervals, and only during deep dipping, which is lower at a 10 level. The values for the shallow dipping intervals are intermediate (Table 5).
Summarizing, the spectral changes in both the absorption narrow features and the continuum observed between persistent and dipping emission can be modeled simply by variations in the properties of the neutral and ionized absorbers, with the ionized absorber playing the main role. During dipping, both the amount of neutral and ionized absorbing material in the line-of-sight is higher with a much larger difference for the ionized material. In addition, the material in the line-of-sight is less ionized during dipping than during persistent intervals.
4 Discussion
We report the detection of narrow Fe xxv (He-like) and Fe xxvi (H-like) 1s-2p resonant X-ray absorption lines at 6.68 and keV in the persistent emission of 4U 132362. These features are superposed on a broad emission feature centered on keV. During dipping intervals the of the Fe xxv feature increases while that of the Fe xxvi feature decreases implying the presence of less strongly ionized material in the line-of-sight during dips. The overall 1.0–10 keV spectrum becomes harder during the dips, but this change is inconsistent with a simple increase in absorption by cool material. We demonstrate that both the changes in the continuum and absorption lines observed between persistent and dipping intervals can be modeled mainly by changes in the properties of an ionized absorber which has a higher column density and lower ionization parameter during dipping intervals than during persistent intervals.
Fe xxv or Fe xxvi absorption lines near 7 keV were reported from the micro-quasars GRO J165540 (Ueda et al. 1998; Yamaoka et al. 2001), GRS 1915+105 (Kotani et al. 2000; Lee et al. 2002) and H 1743322 (Miller et al. 2004, the classification as a micro-quasar is preliminary), and from the neutron star systems Cir X1 (Brandt et al. 1996; Brandt & Schulz 2000; Schulz & Brandt 2002), GX 13+1 (Ueda et al. 2001; Sidoli et al. 2002; Ueda et al. 2004), MXB 1658298 (Sidoli et al. 2001), X 1624490 (Parmar et al. 2002), X 1254690 (Boirin & Parmar 2003), XB 1916053 (Boirin et al. 2004) and now 4U 132362.
All these systems except GRS 1915+105 and GX 13+1 show dipping activity indicating that their inclination is 60–80∘. Note that the report of dipping activity in H 1743322 is preliminary (Miller et al. 2004). An inclination of 70∘ is attributed to GRS 1915+105 assuming that the superluminal jets are perpendicular to the accretion disk (Mirabel & Rodriguez 1994). The inclination of GX 13+1 is unknown, but its 24 day periodic energy-dependent X-ray modulation (Corbet 2003) might indicate a relatively high inclination. Therefore, most of the systems exhibiting Fe xxv or Fe xxvi absorption lines are viewed relatively close to edge-on. This and the lack of any orbital phase dependence of the features (e.g., Yamaoka et al. 2001; Boirin & Parmar 2003) except during dips, suggest that the highly-ionized absorber is located in a thin cylindrical geometry around the compact object. Such highly-ionized disk atmosphere or wind is probably a common feature of accreting binaries, but is preferentially detected in the dipping sources, presumably due to being viewed at inclination angles within of the orbital plane.
Chandra HETGS observations revealed blue-shifts of 500 km s-1 for the lines from Cir X1, GX 13+1 and H 1743322, interpreted as evidence for outflows in these systems (Schulz & Brandt 2002; Ueda et al. 2004; Miller et al. 2004). The absorption lines from the other binaries do not appear to be strongly blue-shifted. However, most of the results come from ASCA Solid-state Imaging Spectrometer and XMM-Newton EPIC which has a factor 4 poorer energy resolution than the HETGS at Fe-K. Therefore, the geometry and dynamics of the highly-ionized plasma remain an open question. Whether the plasma is in- or out-flowing and its velocity might depend on parameters such as the luminosity and the distance between the absorber and the ionizing source. The upper limit to any blue-shift during persistent emission from 4U 132362 is 1020 km s-1.
The emission line detected at keV in the persistent spectrum of 4U 132362 is very broad, with a of keV. While relativistic broadening cannot be excluded, the conditions for such an effect to occur are not expected to be met in neutron star systems like 4U 132362 as easily as in black hole systems where relativistically broadened lines are usually observed. Furthermore, the inclination of derived from the Laor model is inconsistent with the inclination of inferred from the absence of eclipses in 4U 132362, assuming a mass of 1.4 M⊙ and 1 M⊙ for the neutron star and the secondary star, respectively. Alternatively, a secondary mass of 0.3 M⊙ would be required to make the two inclinations consistent with each other. Other mechanisms such as Compton scattering, rotational velocity broadening and emission from a range of ionization states may contribute to the broadening in 4U 132362. We caution that the detection and width of such an emission Gaussian depends on the continuum modeling which is poorly constrained due to the lack of data above 10 keV. However, an emission line was reported at keV in the 2–20 keV RXTE Proportional Counter Array spectrum of 4U 132362 (the line width was fixed to 0.4 keV, Barnard et al. 2001). Furthermore, broad Fe lines have been detected using XMM-Newton from other neutron star systems that show highly-ionized absorption features such as MXB 1658298 ( keV, Sidoli et al. 2001) and GX 13+1 ( keV, Sidoli et al. 2002).
Changes in the Fe xxvi and Fe xxv absorption features between persistent and dipping intervals have been reported from Cir X1 (Schulz & Brandt 2002), H 1743322 (Miller et al. 2004), and from the classical dipping LMXBs X 1624490 (Parmar et al. 2002) and XB 1916053 (Boirin et al. 2004). From persistent to dipping intervals, the strength of the He-like feature increases while that of the H-like feature decreases, indicating that the material in the line-of-sight is less ionized during dipping. In the case of MXB 1658298, whilst Sidoli et al. (2001) report that there is no obvious orbital dependence of the s of the Fe features, their Fig. 4 shows that the ratio of Fe xxv/Fe xxvi s is at a maximum during dips (orbital phase 0.8), consistent with the presence of less-ionized material. Boirin & Parmar (2003) did not examine the dip seen from X 1254690 due to simultaneous enhanced background counting rate related to solar activity. Despite the lower signal to noise ratio implied during the dip, a re-analysis of the 2001 XMM-Newton observation using the photo-ionized absorber model presented in this paper (assuming the same ionizing continuum) indicates that is , and , during persistent, shallow and deep dipping intervals, respectively, clearly demonstrating that the absorber is less ionized during dipping. In the case of 4U 132362, this absorbing material has an ionization parameter which decreases from a of during persistent intervals to during deep dipping. We note that the absolute values of might suffer from a systematic uncertainty due to mis-evaluation of the ionizing continuum (see Appendix A). However, this systematic effect does not affect the relative differences in observed between persistent and dipping intervals. Thus, it is likely that the absorbing material responsible for the dipping activity in X-ray binaries is in general less-ionized than during persistent intervals.
In the case of 4U 132362, we demonstrate not only that the ionization parameter is lower during dipping, but also that the equivalent hydrogen column density is significantly higher than during persistent intervals. The line-of-sight absorber may be considered to have changed from being “hot” (almost fully ionized) to “warm”. During persistent emission, most of the abundant metals except for Fe are almost fully ionized and the only prominent absorption features are due to Fe xxv and Fe xxvi (Fig. 8; upper right panel). As the level of dipping increases, absorption from a much wider range of ions is evident because of the higher column density and the lower ionization parameter. The continuum transmission becomes highly affected due to the continuum opacity of the ions and to the presence of many more deep narrow features which blend together (Fig. 8, middle and lower right panels). This results in an apparent change in the continuum shape.
The spectral changes during dips from LMXBs are often modeled using the “progressive covering”, or “complex continuum” approach (e.g., Church et al. 1997; Bałucińska-Church et al. 1999; Barnard et al. 2001). There, the X-ray emission is assumed to originate from a point-like blackbody, or disk-blackbody component, together with a power-law component from an extended corona. This approach models the spectral changes during dipping intervals by the partial and progressive covering of the extended component by an opaque neutral absorber. In the case of 4U 132362 we have demonstrated that changes in the properties of an ionized absorber provide an alternative explanation for the overall spectral changes during dips. The changes in the continuum and in the narrow lines are modeled self-consistently in a simple way. No partial covering of any component of the spectrum is required. Consequently, the model does not exclude that the X-ray emission originates from point-like components, and an extended corona is not required. Since similar changes in the Fe line ratios (and therefore also in ionized absorbers) are observed from many other dip sources, it is likely that this mechanism is important in modifying the continuum shape during dips from these other sources as well. However, answering whether this mechanism is sufficient to model the complex changes seen from the other dip sources, or whether “progressive covering” is also required, will have to await further investigation and particularly the high spectral resolution observations of dipping LMXBs expected from Astro-E2.
While this paper was under revision, an analysis of the same XMM-Newton observation of 4U 132362 was reported by Church et al. (2005). There, it is argued that our model based on an ionized absorber can be ruled out because “the increase of electron column density in dipping would cause a decrease in X-ray continuum intensity at every energy due to Thomson scattering by a factor ”, and in particular a too large decrease of the 20–50 keV flux compared to what was observed with BeppoSAX. However, the electron scattering optical depth, (see Sect. 2.3), is energy dependent, and its approximation by the energy independent Thomson term, , does not hold at high energy. In fact, using the numbers quoted in our Table 5, we calculate that our model (in which the energy dependent Klein-Nishina formula is used to compute ) predicts a 20–50 keV flux decrease of 25% during dips, consistent with the value of less than % measured with BeppoSAX (Bałucińska-Church et al. 1999).
Acknowledgements.
We thank Frank Verbunt and Jean in ’t Zand for helpful discussions and careful reading of the manuscript. We are grateful to the anonymous referee whose comments have lead to important improvements in the analysis. This work is based on observations obtained with XMM-Newton, an ESA science mission with instruments and contributions directly funded by ESA member states and the USA (NASA). The SRON is supported financially by the NWO, the Netherlands Organization for Scientific Research. M. Díaz Trigo acknowledges an ESA Fellowship.Appendix A The photo-ionized absorber
| Persistent | Dipping | ||||||
| Shallow | Deep | ||||||
| Ion | |||||||
| (cm-2) | (cm-2) | (cm-2) | |||||
| H II | 22.55 | 1 | 22.74 | 1 | 23.14 | 1 | |
| He III | 21.48 | 2 | 21.67 | 2 | 22.07 | 2 | |
| C VII | 18.94 | 4 | 19.13 | 4 | 19.53 | 4 | |
| N VIII | 18.48 | 6 | 18.67 | 6 | 19.07 | 6 | |
| O VIII | - | - | 16.80 | 19 | 18.01 | 11 | |
| O IX | 19.24 | 3 | 19.43 | 3 | 19.82 | 3 | |
| Ne X | - | - | - | - | 17.92 | 15 | |
| Ne XI | 18.55 | 5 | 18.74 | 5 | 19.11 | 5 | |
| Na XII | 16.88 | 15 | 17.06 | 16 | - | - | |
| Mg XIII | 18.08 | 8 | 18.27 | 7 | 17.90 | 16 | |
| Al XIV | 17.01 | 13 | 17.19 | 14 | - | - | |
| Si XIV | 16.56 | 18 | 17.19 | 13 | 18.21 | 9 | |
| Si XV | 18.08 | 7 | 18.24 | 8 | 18.46 | 8 | |
| S XVI | 16.64 | 17 | 17.25 | 12 | 18.06 | 10 | |
| S XVII | 17.78 | 9 | 17.91 | 10 | 17.93 | 12 | |
| Ar XIX | 16.88 | 14 | 16.95 | 17 | - | - | |
| Ca XXI | 16.78 | 16 | - | - | - | - | |
| Fe XXI | - | - | - | - | 17.62 | 20 | |
| Fe XXII | - | - | - | - | 17.88 | 17 | |
| Fe XXIII | - | - | - | - | 17.93 | 13 | |
| Fe XXIV | - | - | 17.11 | 15 | 17.80 | 18 | |
| Fe XXV | 17.43 | 11 | 17.92 | 9 | 17.92 | 14 | |
| Fe XXVI | 17.66 | 10 | 17.67 | 11 | - | - | |
| Fe XXVII | 17.41 | 12 | 16.94 | 18 | - | - | |
| Ni XXVII | 16.42 | 19 | - | - | - | - | |
| Ni XXVIII | 16.41 | 20 | - | - | - | - | |
In this appendix, we give a detailed description of the photo-ionized absorber as modeled by xabs in the averaged spectra of 4U 132362 (see Sects. 2.2 and 3.2, and Table 2) and estimate the validity of some assumptions of the xabs model in the case of 4U 132362.
The electron effective temperature implied by the photo-ionization model is 270 eV, 150 eV and 70 eV, for the persistent, shallow and deep dipping spectra, respectively. Table 6 lists the column densities of the most abundant ions. Table 7 lists the strongest absorption lines due to the ionized absorber. Table 8 lists the strongest absorption edges. They are significant only in the deep dipping spectrum. There, the s of these edges are high compared with the strength of the lines from the same ions. This confirms that the ionized absorber is in a saturated regime during deep dipping, as opposed to an unsaturated regime during persistent and shallow dipping emission.
| Pers. | Dipping | ||||||||
| Sha. | Deep | ||||||||
| Ion | Energy | ||||||||
| Transition | (keV) | (eV) | (eV) | (eV) | |||||
| O viii | 1s-2p | 0.654 | - | - | 1.6 | 19 | - | - | |
| Ne x | 1s-2p | 1.022 | - | - | 1.5 | 21 | - | - | |
| Fe xxiv | 2s-3p | 1.163 | - | - | 1.6 | 18 | - | - | |
| Fe xxiv | 2s-3p | 1.167 | - | - | 2.8 | 10 | - | - | |
| Mg xii | 1s-2p | 1.473 | 0.4 | 20 | 1.7 | 17 | - | - | |
| Si xiii | 1s-2p | 1.865 | - | - | - | - | 3.0 | 21 | |
| Si xiv | 1s-2p | 2.004 | 0.5 | 17 | 2.2 | 14 | 3.2 | 18 | |
| Si xiv | 1s-2p | 2.006 | 1.1 | 10 | 4.0 | 9 | 3.6 | 16 | |
| S xv | 1s-2p | 2.461 | - | - | - | - | 4.3 | 11 | |
| S xvi | 1s-2p | 2.620 | 0.7 | 15 | 2.5 | 12 | 3.7 | 15 | |
| S xvi | 1s-2p | 2.623 | 1.3 | 9 | 4.7 | 7 | 4.3 | 12 | |
| S xv | 1s-3p | 2.884 | - | - | - | - | 3.1 | 19 | |
| S xvi | 1s-3p | 3.107 | - | - | - | - | 3.1 | 20 | |
| Ar xvii | 1s-2p | 3.140 | - | - | - | - | 3.9 | 14 | |
| Ca xix | 1s-2p | 3.902 | - | - | - | - | 4.9 | 9 | |
| Ca xx | 1s-2p | 4.108 | 0.6 | 16 | 1.6 | 20 | - | - | |
| Fe xxi | 1s-2p | a | 6.544 | - | - | - | - | 8.3 | 6 |
| Fe xxii | 1s-2p | b | 6.586 | - | - | - | - | 8.7 | 5 |
| Fe xxii | 1s-2p | c | 6.587 | - | - | - | - | 9.1 | 4 |
| Fe xxiii | 1s-2p | d | 6.596 | - | - | - | - | 3.5 | 17 |
| Fe xxiii | 1s-2p | e | 6.629 | - | - | 1.9 | 16 | 11.7 | 2 |
| Fe xxiv | 1s-2p | f | 6.653 | - | - | 2.2 | 15 | 6.0 | 8 |
| Fe xxiv | 1s-2p | g | 6.662 | 0.8 | 14 | 6.4 | 5 | 9.5 | 3 |
| Fe xxiv | 1s-2p | h | 6.677 | - | - | - | - | 4.5 | 10 |
| Fe xxv | 1s-2p | 6.700 | 21.9 | 1 | 38.2 | 1 | 11.9 | 1 | |
| Fe xxvi | 1s-2p | 6.952 | 6.8 | 3 | 6.6 | 4 | - | - | |
| Fe xxvi | 1s-2p | 6.973 | 13.3 | 2 | 12.3 | 3 | - | - | |
| Ni xxvii | 1s-2p | 7.805 | 1.9 | 6 | 4.2 | 8 | - | - | |
| Fe xxv | 1s-3p | 7.881 | 4.6 | 4 | 12.5 | 2 | 7.3 | 7 | |
| Ni xxviii | 1s-2p | 8.073 | 0.4 | 21 | - | - | - | - | |
| Ni xxviii | 1s-2p | 8.101 | 0.8 | 13 | - | - | - | - | |
| Fe xxvi | 1s-3p | 8.246 | 1.3 | 8 | - | - | - | - | |
| Fe xxvi | 1s-3p | 8.252 | 2.6 | 5 | 2.7 | 11 | - | - | |
| Fe xxv | 1s-4p | 8.296 | 1.7 | 7 | 5.1 | 6 | 4.0 | 13 | |
| Fe xxv | 1s-5p | 8.487 | 0.8 | 12 | 2.5 | 13 | - | - | |
| Fe xxvi | 1s-4p | 8.698 | 0.5 | 18 | - | - | - | - | |
| Fe xxvi | 1s-4p | 8.701 | 1.0 | 11 | - | - | - | - | |
| Fe xxvi | 1s-5p | 8.909 | 0.5 | 19 | - | - | - | - | |
| a , b , c , | |||||||||
| d , e , f , | |||||||||
| g , h . | |||||||||
To evaluate how the choice of the ionizing continuum affects our results, we calculated new grids of relative ionic abundances using CLOUDY assuming various ionizing spectra, and fit the average spectra again using these new grids. When the ionizing spectrum is assumed to be a cutoff power-law with of 2.1 (instead of 1.96) and of 44 keV, we find that the best-fit parameters are all consistent with those in Table 2 except which is higher, with in the case of the persistent emission. Indeed, the considered ionizing spectrum is softer, and the electron temperature of the photo-ionized absorber has dropped to 230 eV. Therefore a higher luminosity, and hence a higher (if and are unchanged), are required to produce the iron ions in the same ratios. On the contrary, when the assumed ionizing spectrum consists of a cutoff power-law with of 1.7 and of 44 keV, becomes significantly lower, with for the persistent spectrum, as expected from a harder ionizing spectrum (the electron temperature is now 330 eV). For the shallow and deep dipping spectrum, we derive of , , respectively. Therefore, although the absolute value of depends on the assumed shape of the ionizing spectrum (which is poorly known), the relative change of observed from persistent to deep dipping is un-affected. Note that the absolute value of does not only depend on the assumed ionizing spectrum, but more generally, on the photo-ionization model (XSTAR or CLOUDY) used (Steenbrugge et al. 2005).
Using the xabs model to account for narrow absorption lines, we have neglected resonant emission lines coming from ionized material located outside the line-of-sight, that would partly re-fill-in the absorption features. If these emission lines were not neglected, the observed equivalent width of a feature, , would be related to the equivalent width, , due to absorption only, by the relation: , where is the solid angle subtended by the ionized material. The column density of the absorber should then be estimated from rather than from . Assuming that the ionized material subtends a solid angle of (see e.g. Ueda et al. 2004), we find that for the persistent emission (linear regime of the curve-of-growth), the equivalent column density of the absorber would be higher by 25%. This value is comparable to the uncertainty on in the average persistent spectrum (Table 2), and the standard deviation of the values among the individual persistent segments (Fig. 9).
| Persistent | Dipping | |||||||||
|---|---|---|---|---|---|---|---|---|---|---|
| Shallow | Deep | |||||||||
| Edge Energy | ||||||||||
| (keV) | (eV) | (eV) | (eV) | |||||||
| Si xiv | 2.67 | - | - | - | - | - | - | 0.052 | 76 | 4 |
| Fe xxii | 8.38 | - | - | - | - | - | - | 0.017 | 82 | 2 |
| Fe xxiii | 8.48 | - | - | - | - | - | - | 0.018 | 90 | 1 |
| Fe xxv | 8.83 | 0.005 | 26 | 1 | 0.016 | 81 | 1 | 0.016 | 81 | 3 |
| Fe xxvi | 9.28 | 0.004 | 22 | 2 | 0.004 | 22 | 2 | - | - | - |
Using xabs, we have also neglected recombination lines from the photo-ionized material. If such line emission from the ions were important, not only the resonant line would be emitted, but also the associated intercombination and forbidden lines, in the case of He-like ions. In a photo-ionized plasma, the Fe xxv forbidden emission line at 6.6341 keV (or alternatively, the intercombination line if the density is high) is expected to be a factor 2.3 stronger than the resonance emission line at 6.6986 keV. Now, no narrow line is detected at the energy of the forbidden transition in the average persistent spectrum of 4U 132362. This indicates that narrow line emission does not play an important role compared to narrow line absorption. To further quantify this, we have derived the upper-limit on the normalization of the forbidden line, , and added a narrow emission line with an energy fixed to that of the resonant transition and with a normalization fixed to /2.3, to the model described in Table 2 for the persistent average spectrum. We then performed the fit again and found that all the best-fit parameters are consistent with the previous values. In particular, is found to be 1022 atoms cm-2, in agreement with the value reported in Table 2. Therefore, the assumption that recombination lines from the photo-ionized material can be neglected is a posteriori verified in the case of 4U 132362.
References
- Anders & Grevesse (1989) Anders, E. & Grevesse, N. 1989, Geochim. Cosmochim. Acta., 53, 197
- Arnaud (1996) Arnaud, K. A. 1996, in ASP Conf. Ser. 101: Astronomical Data Analysis Software and Systems V, 17
- Bałucińska-Church et al. (1999) Bałucińska-Church, M., Church, M. J., Oosterbroek, T., et al. 1999, A&A, 349, 495
- Barnard et al. (2001) Barnard, R., Balucińska-Church, M., Smale, A. P., & Church, M. J. 2001, A&A, 380, 494
- Boirin & Parmar (2003) Boirin, L. & Parmar, A. N. 2003, A&A, 407, 1079
- Boirin et al. (2004) Boirin, L., Parmar, A. N., Barret, D., Paltani, S., & Grindlay, J. E. 2004, A&A, 418, 1061
- Brandt et al. (1996) Brandt, W. N., Fabian, A. C., Dotani, T., et al. 1996, MNRAS, 283, 1071
- Brandt & Schulz (2000) Brandt, W. N. & Schulz, N. S. 2000, ApJ, 544, L123
- Church et al. (1997) Church, M. J., Dotani, T., Balucinska-Church, M., et al. 1997, ApJ, 491, 388
- Church et al. (2005) Church, M. J., Reed, D., Dotani, T., Balucinska-Church, M., & Smale, A. P. 2005, MNRAS, in press, astro-ph/0412228
- Corbet (2003) Corbet, R. H. D. 2003, ApJ, 595, 1086
- den Herder et al. (2001) den Herder, J. W., Brinkman, A. C., Kahn, S. M., et al. 2001, A&A, 365, L7
- Ferland (2003) Ferland, G. J. 2003, ARA&A, 41, 517
- Forman et al. (1978) Forman, W., Jones, C., Cominsky, L., et al. 1978, ApJS, 38, 357
- Frank et al. (1987) Frank, J., King, A. R., & Lasota, J. P. 1987, A&A, 178, 137
- Jansen et al. (2001) Jansen, F., Lumb, D., Altieri, B., et al. 2001, A&A, 365, L1
- Jonker et al. (1999) Jonker, P. G., van der Klis, M., & Wijnands, R. 1999, ApJ, 511, L41
- Kaastra et al. (1996) Kaastra, J. S., Mewe, R., & Nieuwenhuijzen, H. 1996, in UV and X-ray Spectroscopy of Astrophysical and Laboratory Plasmas. Frontiers science series, no. 15, 411
- Kallman & Bautista (2001) Kallman, T. & Bautista, M. 2001, ApJS, 133, 221
- Kotani et al. (2000) Kotani, T., Ebisawa, K., Dotani, T., et al. 2000, ApJ, 539, 413
- Laor (1991) Laor, A. 1991, ApJ, 376, 90
- Lee et al. (2002) Lee, J. C., Reynolds, C. S., Remillard, R., et al. 2002, ApJ, 567, 1102
- Miller et al. (2004) Miller, J. M., Raymond, J., Homan, J., et al. 2004, ArXiv Astrophysics e-prints
- Mirabel & Rodriguez (1994) Mirabel, I. F. & Rodriguez, L. F. 1994, Nature, 371, 46
- Morrison & McCammon (1983) Morrison, R. & McCammon, D. 1983, ApJ, 270, 119
- Parmar et al. (1989) Parmar, A. N., Gottwald, M., van der Klis, M., & van Paradijs, J. 1989, ApJ, 338, 1024
- Parmar et al. (2002) Parmar, A. N., Oosterbroek, T., Boirin, L., & Lumb, D. 2002, A&A, 386, 910
- Parmar et al. (1986) Parmar, A. N., White, N. E., Giommi, P., & Gottwald, M. 1986, ApJ, 308, 199
- Schulz & Brandt (2002) Schulz, N. S. & Brandt, W. N. 2002, ApJ, 572, 971
- Sidoli et al. (2001) Sidoli, L., Oosterbroek, T., Parmar, A. N., Lumb, D., & Erd, C. 2001, A&A, 379, 540
- Sidoli et al. (2002) Sidoli, L., Parmar, A. N., Oosterbroek, T., & Lumb, D. 2002, A&A, 385, 940
- Smale (1995) Smale, A. P. 1995, AJ, 110, 1292
- Steenbrugge (2005) Steenbrugge, K. C. 2005, A&A, in preparation
- Strüder et al. (2001) Strüder, L., Briel, U., Dennerl, K., et al. 2001, A&A, 365, L18
- Turner et al. (2001) Turner, M. J. L., Abbey, A., Arnaud, M., et al. 2001, A&A, 365, L27
- Ueda et al. (2001) Ueda, Y., Asai, K., Yamaoka, K., Dotani, T., & Inoue, H. 2001, ApJ, 556, L87
- Ueda et al. (1998) Ueda, Y., Inoue, H., Tanaka, Y., et al. 1998, ApJ, 492, 782
- Ueda et al. (2004) Ueda, Y., Murakami, H., Yamaoka, K., Dotani, T., & Ebisawa, K. 2004, ApJ, 609, 325
- van der Klis et al. (1985) van der Klis, M., Jansen, F., van Paradijs, J., & Stollmann, G. 1985, Space Science Reviews, 40, 287
- Verner et al. (1996) Verner, D. A., Verner, E. M., & Ferland, G. J. 1996, Atomic Data and Nuclear Data Tables, 64, 1
- Verner & Yakovlev (1995) Verner, D. A. & Yakovlev, D. G. 1995, A&AS, 109, 125
- Warwick et al. (1981) Warwick, R. S., Marshall, N., Fraser, G. W., et al. 1981, MNRAS, 197, 865
- White & Swank (1982) White, N. E. & Swank, J. H. 1982, ApJ, 253, L61
- Yamaoka et al. (2001) Yamaoka, K., Ueda, Y., Inoue, H., et al. 2001, PASJ, 53, 179