Abstract
We make use of the on-going All Imaging Survey of the UV GALEX satellite cross-correlated with the IRAS all sky survey to build samples of galaxies truly selected in far-infrared or in ultraviolet. We discuss the amount of dust attenuation and the star formation rates for these galaxies and compare the properties of the galaxies selected in FIR or in UV.
keywords:
Ultraviolet, far-infrared, galaxies, dust attenuation, star formation ratesDust attenuation and star formation in the nearby universe: the ultraviolet and far-infrared points of view
Introduction
The measure of the star formation rate (SFR) in galaxies is based on the analysis of the emission from young stars which escapes the galaxies or is absorbed and re-emitted by the gas or the dust. In this paper, we will focus on UV and IR emissions. These emissions are closely related by the energetic budget at work in star forming galaxies: the UV light which does not escape the galaxy is absorbed by the interstellar dust and re-emitted in the far-IR. Therefore both emissions originate from the same stellar populations and their comparison is a powerful tracer of the dust attenuation (Buat & Xu [1996],Gordon et al. [2000]). They are also closely related to the recent star formation rate over similar timescales (Buat & Xu [1996],Kennicutt [1998]). In this paper we will combine the new GALEX data together with the existing far-IR data from IRAS.
1 The data
We have worked on 600 deg2 observed by GALEX in NUV( nm and FUV ( nm) to build two samples of galaxies. The first one, called the NUV selected sample includes all the galaxies brighter than m(NUV) = 16 mag (AB scale), among the 88 selected galaxies (excluding ellipticals and active galaxies) only 3 are not detected by IRAS at 60 . The second sample, called the FIR selected sample is based on the IRAS PSCz (Saunders et al. [2000]): 118 galaxies from this catalog lie within our GALEX fields, only 1 is not detected in NUV.
2 Dust attenuation in the nearby universe
Mean values of the dust attenuation
For both samples we measure the dust attenuation using the F(dust)/F(NUV)
ratio. This ratio is a quantitative measure of the dust attenuation at UV
wavelengths (e.g. Buat & Xu [1996], Gordon et al.
[2000]). The formulae used here
are adapted to the GALEX
bands (Buat et al. 2004, ApJL, in press). The total (8-1000 ) dust
emission is calculated from the fluxes at 60 and 100 using the Dale et
al. ([2001]) recipe.
A moderate attenuation is found in the NUV selected sample with
mag in NUV and and mag in FUV. As
expected the dust attenuation is higher in the FIR selected sample with
mag in NUV and mag in FUV.
A comparison of the FIR and UV luminosity densities from IRAS (Saunders et al.
[1990]) and GALEX (Thilker et al. 2004, ApJL, in press) leads to
a mean dust attenuation at z0 of 1.1 mag in NUV and 1.6 mag in FUV: the
nearby universe is not very obscured.
.
The "IRX-" relation
From their study of starburst galaxies Meurer and coll. (e.g. Meurer et al.
[1999]) have found a strong correlation between the slope
of the UV continuum (fitted as a power law
between 1200 and 2500 Å) and F(dust)/F(FUV). They concluded that
is a reliable tracer of the dust attenuation in galaxies. However
further works showed that this law is not universal and that ultra-luminous
infrared galaxies (Goldader et al. [2002]) and normal spiral
galaxies (Bell [2002]) do not follow the relation found for starbursts.
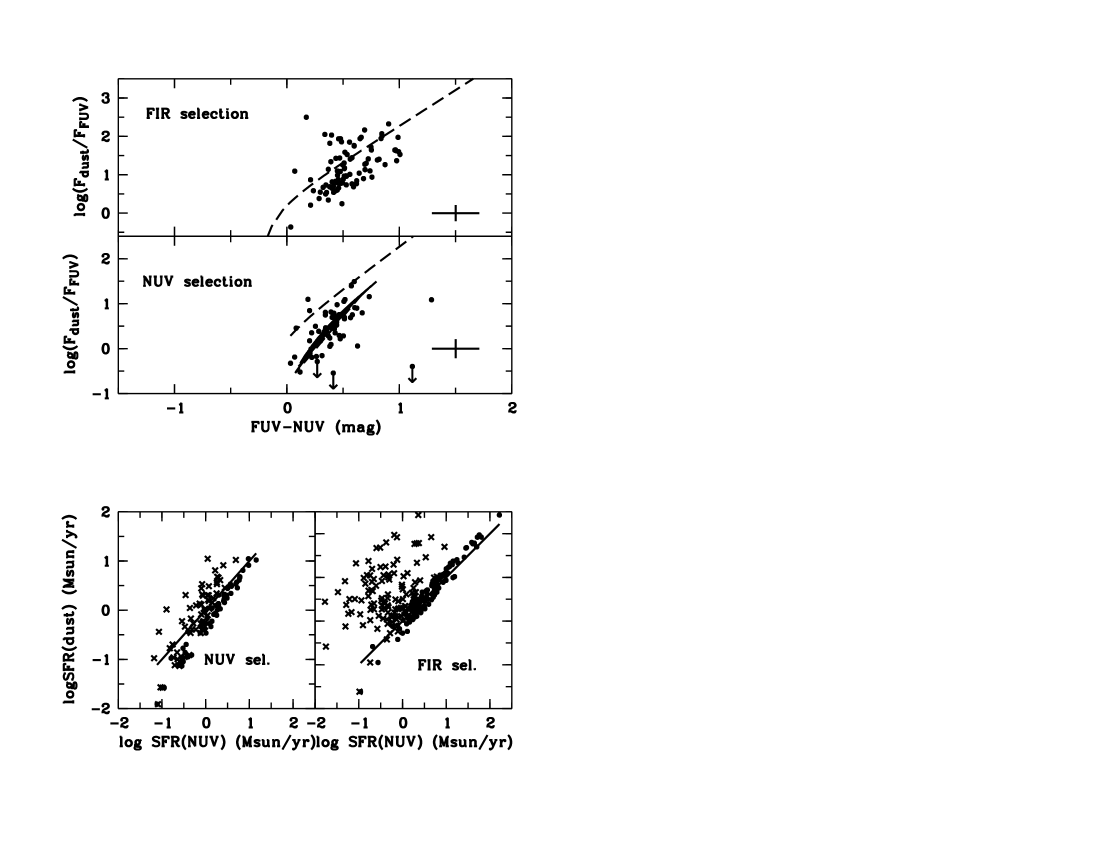
The FUV-NUV color from the GALEX observation is directly linked to
(Kong et al. [2004]). We have plotted this color versus
F(dust)/F(FUV) for our two samples of galaxies in Fig. 1 and compared to the
predictions for starburst galaxies.
Obviously is not a reliable tracer of the dust attenuation in our NUV
and FIR selected samples. Moreover, different behaviors are found within both
samples: whereas the FIR selected galaxies spread over a large area of the
diagram most of the NUV selected galaxies lie below the starburst relation.
This may be due to age effects in the stellar populations: assuming a b
parameter
(defined as the ratio of the recent SFR divided by the past averaged one)
equal to 0.25
leads to a reasonable fit using the models of Kong et al. [2004].
3 The measure of the star formation rate
UV and total dust emissions can be calibrated in a recent star formation rate
assuming a recent (over years) star formation history and an
initial mass
function (Buat & Xu [1996], Kennicutt [1998]). When using
the dust luminosity one must add an additional hypothesis about the absorption
of the stellar light by the dust. The classical hypothesis (also made in this
work) is that all the stellar light from the young stars is absorbed by the
dust (Kennicutt [1998]). In this paper we also assume a constant SFR
over years, a Salpeter IMF. Using Starburst99 synthesis models we
obtain:
and
.
In Fig 1 are plotted the SFR estimated from the NUV luminosity against the SFR
from the dust luminosity. In both samples, the observed NUV luminosity
strongly under-estimates the SFR the effect being worse for the FIR selected
sample. When the NUV selected sample is corrected for dust attenuation the
agreement is very good (as expected) between both estimates of the SFR in the
FIR selected sample since we are dominated in each case by the dust
emission. Conversely in the NUV selected sample the SFR estimated from the
dust luminosity alone is found to underestimate the SFR as compared to the NUV
corrected luminosity. The discrepancy increases towards the low SFRs to reach
a factor 3 for SFR of 0.3 M. Therefore, using the dust
emission alone to measure the total SFR in all galaxies can be misleading, the
best way being to combine UV and IR emissions to estimate reliable SFRs.
1
References
- [2002] Bell, E. 2002, ApJ 577, 150
- [1996] Buat, V., Xu, C. 1996, A & A, 306, 61
- [2001] Dale, D., Helou, G., Contursi, A., Silbermann, N., Kolhatkar, S. 2001, ApJ, 549, 215
- [2002] Goldader,J., D., Meurer, G., Heckman, T., M., Seibert, M., Sanders, D. B., Calzetti, D., Steidel, C., C. 2002, ApJ 568, 651
- [2000] Gordon, K, Clayton, G., Witt, A., Misselt, K 2000, ApJ 533, 236
- [1998] Kennicutt, R. 1998, ARAA 36, 189
- [2004] Kong, X., Charlot, S., Brinchmann, J., Fall, M. 2004, MNRAS 349. 769
- [1999] Meurer, G. R., Heckman, T. M., & Calzetti, D. 1999, ApJ, 521, 64
- [2000] Saunders, W. et al. 2000, MNRAS 317, 55
- [1990] Saunders, W., Rowan-Robinson, M., Lawrence, A. et al. 1990, MNRAS 242, 318