The exceptional X-ray variability of the dwarf Seyfert nucleus NGC 4395
Abstract
An analysis of the X-ray variability of the low luminosity Seyfert nucleus NGC 4395, based on a long XMM-Newton observation, is presented. The power spectrum shows a clear break from a flat spectrum () to a steeper spectrum () at a frequency Hz, comparable to the highest characteristic frequency found previously in a Seyfert galaxy. This extends the measured values to lower than previous studies of Seyfert galaxies, and is consistent with an inverse scaling of variability frequency with black hole mass. The variations observed are among the most violent seen in an AGN to date, with the fractional rms amplitude () exceeding per cent in the softest band. The amplitude of the variations seems intrinsically higher in NGC 4395 than most other Seyferts, even after accounting for the differences in characteristic frequencies. The origin of this difference is not clear, but it is unlikely to be a high accretion rate ( per cent for NGC 4395). The variations clearly follow the linear rms-flux relation, further supporting the idea that this is a ubiquitous characteristics of accreting black holes. The variations are highly coherent between different energy bands with any frequency-dependent time delay limited to per cent.
keywords:
galaxies: active – galaxies: Seyfert: general – galaxies: individual: NGC 4395 – X-ray: galaxies1 Introduction
The nucleus of the dwarf galaxy NGC 4395 (Filippenko & Sargent 1989) lies at the edge of the parameters space formed by Active Galactic Nuclei (AGN). It is among the nearest (; Thim et al. 2004) and lowest luminosity (; Moran et al. 1999; Lira et al. 1999) Seyfert galaxies known, and harbours a central black hole with a mass probably in the range (Filippenko & Ho 2003), which compares to more luminous Seyfert galaxies with black hole masses typically in the range (Wandel, Peterson & Malkan 1999). In addition, it shows some of the strongest X-ray variability of any radio-quiet AGN (Iwasawa et al. 2000; Shih, Iwasawa & Fabian 2003) with variations of nearly an order of magnitude in a few thousand seconds. Yet in other respects, such as optical and ultraviolet emission (and absorption) line properties, it resembles its more luminous counterparts (Filippenko & Sargent 1989; Crenshaw et al. 2004).
The X-ray variations of Seyfert galaxies are characterised by a ‘red noise’ power spectrum (Lawrence et al. 1987; McHardy 1989), approximated by a steep power law at high frequencies [] with an index breaking to a flatter index below some break frequency (e.g. Edelson & Nandra 1999; Nandra & Papadakis 2001; Uttley, McHardy & Papadakis 2002; Vaughan, Fabian & Nandra 2003; Markowitz et al. 2003; McHardy et al. 2004). The prevailing hypothesis is that scales inversely with the mass of the black hole (or, equivalently, the break timescale scales with ). Indeed, the limited data to date are consistent with a simple scaling relation for all black holes, from Galactic Black Holes (GBHs) in X-ray binaries (; McClintock & Remillard 2004) to supermassive black holes in AGN (). If this relation holds then the break timescales in Seyferts may be used to infer the mass of the central black hole by comparison with the power spectra of well studied GBHs such as Cygnus X-1 (Belloni & Hasinger 1990; Nowak et al. 1999) which contains a black hole (Herrero et al. 1995). Uncovering the dependence of the characteristic variability frequencies with the fundamental source parameters (mass, luminosity, accretion rate, etc.) may help clarify the origin of the variability itself.
However, this simple hypothesis is difficult to test (see discussions in Markowitz et al. 2003; McHardy et al. 2004 and Papadakis 2004). GBHs typically possess masses whereas the majority of the well studied Seyfert galaxies have masses . Thus the region of parameter space remains unexplored. NGC 4395, with its unusually low mass black hole, falls in this critical region. Previous studies of its X-ray variability (Shih et al. 2003) using ASCA suggested the expected power spectral break was present (at Hz), but this was poorly determined due to the interrupted sampling of the data (caused by the periodic Earth occulations and SAA passages of the low Earth orbit). XMM-Newton, with its day orbit and high throughput, does not suffer from this problem and has been providing the best constraints on the high frequency power spectra of Seyferts (Vaughan et al. 2003a; Vaughan & Fabian 2003; McHardy et al. 2004). The present paper describes a time series analysis of the data from a long -ks XMM-Newton observation of NGC 4395 designed to confirm the break timescale and test the scaling hypothesis. A future paper (Iwasawa et al. in prep.) will discuss other aspects of this observation.
2 XMM-Newton observation
NGC 4395 was observed by XMM-Newton (Jansen et al. 2001) over 2003-November-30 and 2003-December-01 for a duration of s. This paper will concentrate on the results from the EPIC pn camera which provided the highest signal-to-noise X-ray data.
Extraction of science products from the Observation Data Files (ODFs) followed standard procedures using the XMM-Newton Science Analysis System v5.6.0 (SAS). The data were taken with the EPIC cameras in full-frame mode. The field of NGC 4395 contains several other bright X-ray sources, although the nucleus itself is not confused by these in the EPIC pn image. Source data were therefore extracted from the pn image using a circular region (of radius arcsec) around the centroid of the nuclear source. Only events corresponding to patterns (single and double pixel events) were used for the pn analysis. Background events were extracted from a region on the same CCD unaffected by source photons. These showed the background to be relatively low and stable throughout the first ks of the observation. During the final ks (as the spacecraft approached the radiation belts at perigee) the background rate increased dramatically; these data were ignored for the present analysis. The final extracted dataset contained source counts. The source count rate was low enough that pile-up effects were negligible.
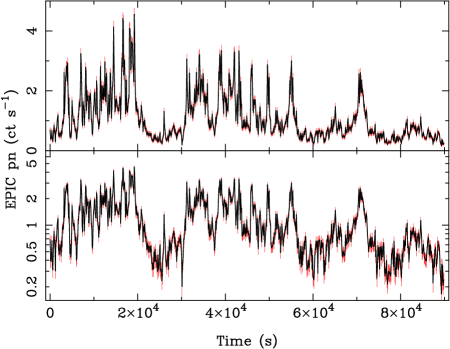
Light curves were extracted from the EPIC pn data in four different energy bands: keV (full band), keV (soft band), keV (medium band) and keV (hard band). These were corrected for telemetry drop outs (less than per cent of the total time), background subtracted and binned to s time resolution. The errors on the light curves were calculated by propagating the Poisson noise. The light curves were not corrected for the per cent ‘live time’ of the pn camera (which is only a scaling factor). The full band light curve is shown in Fig. 1. During the XMM-Newton observation the average keV flux was , similar to the flux during the long ASCA observation taken in 2001 ( ; Shih et al. 2003), indicating the source was in a fairly typical flux state.
3 Time Series Analysis
The average source (background subtracted) and background count rates are shown in Table 1 along with the fractional excess rms variability amplitude of the source (; Vaughan et al. 2003b) in each energy band. The variability amplitude is remarkably high, as can clearly be seen in the light curve (Fig. 1). A fractional rms in excess of unity is extremely rare and only occurs in the most variable AGN known (NGC 4051, Green, McHardy & Done 1999; IRAS 13224–3809, Boller et al. 1997). Thus NGC 4395 clearly deserves to be compared to the most variable AGN. The maximum-to-minimum variation through the length of the observation is a factor .
| Band | source (ct s-1) | background (ct s-1) | (%) |
|---|---|---|---|
| full | |||
| soft | |||
| medium | |||
| hard |

3.1 Rms-flux correlation
As can clearly be seen in the light curve, the distribution of fluxes seems asymmetric, with a skewed tail of very high fluxes, interspersed between periods of low and stable flux. (As a crude test, examine the light curve upside down. It appears qualitatively different when viewed this way indicating an asymmetry.) One might be tempted to naively interpret the high points as individual events (‘flares’ or ‘shots’) occurring between relatively quiescent periods. However, there is a more straightforward interpretation in terms of the ‘rms-flux’ relation known to exist in both Galactic X-ray binaries (Uttley & McHardy 2001) and Seyfert galaxies (Vaughan et al. 2003a; Vaughan et al. 2003b; McHardy et al. 2004). Fig. 2 demonstrates this relation operates in NGC 4395. As discussed by Uttley, McHardy & Vaughan (2004) this is a natural artifact of a non-linear transformation of some underlying linear variability process. At high fluxes the rms amplitude is proportionally higher, hence the light curve appears more erratic, while at low fluxes the rms is lower and the light curve smoother. In effect the non-linear transformation is a ‘stretching’ at high fluxes and a ‘compression’ at low fluxes. The effect on the light curve is more apparent in NGC 4395 simply because of its exceptionally large variability amplitude, which increases the overall effect. In order to illustrate this point the lower panel of Fig. 1 shows the same light curve with a logarithmic flux scale, which effectively transforms the distribution of data to a more linear state and eliminates the linear rms-flux correlation. (On the logarithmic scale the plot does not look so different from its upside down counterpart.) Thus the appearance of ‘flaring’ and ‘quiescent’ periods does not require any non-linear dynamics but is simply a consequence of the well-established rms-flux relation (which is a static non-linear effect).
3.2 Power spectral analysis
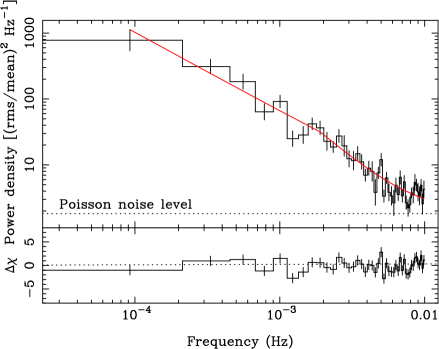
The power spectrum was examined by calculating the logarithmically binned periodogram (following the prescription given in Papadakis & Lawrence 1993). The result is shown in Fig. 3, which clearly reveals the red noise spectrum spanning at least two decades of temporal frequency.
In order to compare the spectrum with those of other Seyferts, as well as GBHs, and to determine the interesting power spectral parameters, simple models were fitted to the binned periodogram. The Poisson noise in the light curve added a constant ‘background’ level to the spectrum, which was accounted for in the fitting by including a constant at the appropriate level in the model (see Appendix A of Vaughan et al. 2003b). It is important to note that this observation of NGC 4395 is free from spectral distortions such as ‘aliasing’ and ‘red noise leak’ that commonly affect Seyfert observations. This was demonstrated by comparison with Monte Carlo simulations (see below), and implies that direct fitting of an analytical model to the binned data is a perfectly reasonable procedure.
As a first test a simple power law was fitted to the binned periodogram. This gave a rather poor fit ( for the full band data). Allowing for a break in the power law gave a substantial improvement ( for additional free parameters), significant at per cent in an -test. The best-fitting broken power law model and the data-model residuals are shown in Fig. 3. The free parameters were the power law index below the break (), the index above the break (), the break frequency () and the normalisation. Table 2 summarises the results of fitting this model to the data from all four energy bands. The low frequency slope is consistent with that obtained from an analysis of the long ASCA observation by Shih et al. (2003; ), but the break frequency is marginally inconsistent with this previous analysis. This may be partly due to the worse sampling (resulting in some spectral distortion) for the ASCA data, but could also indicate the break frequency genuinely changed between the two observations.
The broken power law model provided a formally unacceptable fit to the full band data, but the residuals (Fig. 3) did not show any obvious cause for alarm. The soft and medium band data were reasonably well fitted using this model, while the hard band remained poorly fitted. Part of this may be due to the model having the wrong shape break (e.g. too sharp), although fits with smoothly bending power laws (see McHardy et al. 2004) gave very similar quality fits ( for the full band data). Regardless of whether the shape of the break is more complicated than used in these simple models, the existence of a break is clearly demonstrated. In all the bands the best-fitting model breaks from to with the break frequency constrained to lie in the range Hz. Fig. 4 shows the change in as each parameter is varied. Using the smoothly bending power law model predicted a slightly lower break frequency ( Hz), compared to the sharply breaking model, together with a slightly flatter low frequency slope .

| Band | ( Hz) | |||
|---|---|---|---|---|
| full | ||||
| soft | ||||
| medium | ||||
| hard |
The Monte Carlo fitting procedure discussed by Vaughan et al. (2003a; see also Green et al. 1999 and Uttley et al. 2002) was also used to fit these data. This takes into account any power spectral distortion due to the time sampling of the data. However, in the case of NGC 4395 there were found to be no differences in best-fitting model parameters between the simple (analytical) and robust (Monte Carlo) fitting techniques. There are two reasons for this. The first is that aliasing is negligible due to the fact the data are contiguously binned from an (effectively) continuous photon counting signal (van der Klis 1989). The second is that red noise leak was not present because the power spectrum was flat at the lowest measured frequencies; leakage is only substantial when the low frequency power spectrum remains steep (; Uttley et al. 2002). Given that the binned periodogram is free from distortion, the simple fitting was used over the Monte Carlo method because it is substantially faster and allowed for a much larger grid of model parameters to be computed in a reasonable amount of processing time. (For most other Seyferts, where the power spectrum remains steep at the lowest frequencies probed by XMM-Newton, the Monte Carlo method should be used.)
3.3 Cross-spectral analysis
The cross-spectrum is closely related to the power spectrum. It offers a comparison between two simultaneously sampled time series (such as X-ray light curves in different energy bands) in frequency space. The modulus of the cross-spectrum is used to define the coherence (Vaughan & Nowak 1997), a measure of the degree of correlation between variations in the two time series. If one dataset is simply a delayed or smoothed copy of the other, the coherence will be unity. If the two datasets reflect totally independent variations the coherence will be zero. The cross-spectrum can also be used to measure the phase lag, or the time delay between the two time series (assuming they are reasonable coherent). The coherence and phase lags of GBHs have been discussed by e.g. Nowak et al. (1999) and examined in Seyfert galaxies by Papadakis, Nandra & Kazanas (2001), Vaughan et al. (2003a), Vaughan & Fabian (2002) and McHardy et al. (2004).

Fig. 5 shows the coherence between the three different energy bands for NGC 4395. Clearly at low frequencies the variations are highly coherent (), while at high frequencies the coherence becomes increasingly difficult to measure due to the relatively stronger contribution from Poisson noise. The coherence was calculated using the method of Vaughan & Nowak (1997) which corrects for the effect of Poisson noise. There is a slight tendency for the coherence to fall off at higher frequencies in the soft-to-hard comparison (lower panel of the figure) which would be consistent with that seen in other Seyfert 1 galaxies (e.g. Papadakis et al. 2001; Vaughan et al. 2003a; McHardy et al. 2004). Fig. 6 shows the corresponding time lag spectra. It is clear that there are no significant time delays between the bands, even at the lower frequencies, with an upper limit of s at Hz ( s), which corresponds to a per cent delay. Unsurprisingly the cross-correlation functions (computed using the Discrete Correlation Function of Edelson & Krolik 1988) were reasonably symmetric and peaked at zero lag.

4 Discussion
4.1 Summary of results
The high frequency variability properties of NGC 4395 have been examined using a long ( ks) XMM-Newton observation. The variations clearly followed the linear rms-flux relation previously observed in both GBHs and other Seyfert galaxies, further supporting the idea that this is a universal property of the X-ray variations from accreting black holes. The high frequency power spectrum was steep above a break frequency Hz, below which it broke to a slope . The break frequency is the second highest recorded to date for an AGN (the record is presently held by Ark 564; Papadakis et al. 2002). The cross-spectrum between different energy bands shows the variations at frequencies were highly coherent and any frequency dependent time delay is constrained to be shorter than . In other Seyferts, such as NGC 7469 (Papadakis et al. 2001), MCG–6-30-15 (Vaughan et al. 2003a) and NGC 4051 (McHardy et al. 2004), the delays are typically per cent. The limits of the time delays for NGC 4395 therefore did not rule out typical time delay characteristics. Although the variations in these relatively broad-band light curves were highly coherent, there is a strong energy-dependence to the amplitude of the variations. This will be discussed in a forthcoming paper (Iwasawa et al. in prep).
4.2 The relation
Fig. 7 shows the relation for ten Seyfert galaxies using measurements from the literature (see also Markowitz et al. 2003; McHardy et al. 2004; Papadakis 2004), together with the new break frequency determined for NGC 4395. The power spectral break frequencies from the other ten Seyferts were collected from the following papers: Ark 564 (Papadakis et al. 2002); NGC 4051 (McHardy et al. 2004); NGC 3516, NGC 3783, NGC 4151, NGC 5548, Fairall 9 (Markowitz et al. 2003); Mrk 766 (Vaughan & Fabian 2003); MCG–6-30-15 (Vaughan et al. 2003a) and NGC 5506 (Uttley et al. 2002). Black hole mass estimates were taken from the reverberation mapping studies where possible: Ark 564 (upper limit from Collier et al. 2002); NGC 4051 (Shemmer et al. 2003); NGC 3516 (Wandel et al. 1999); NGC 3783, NGC 4151, NGC 5548, Fairall 9 (Kaspi et al. 2000). For NGC 5506 the mass was estimated using the relation (section 2.3 of Papadakis 2004). For Mrk 766 and MCG–6-30-15 the mass estimates are very uncertain. Based on its bulge luminosity, Uttley et al. (2002) argued for in MCG–6-30-15. Due to the ambiguities in this method the error bars were taken to span an order of magnitude in each direction. For Mrk 766, Wandel (2002) estimated based on the optical luminosity and line widths, while Woo & Urry (2002) estimated using the same reasoning. For the purpose of comparison a value of (the mean of these two estimates) was used, again assuming an order of magnitude uncertainty in either direction. Also shown are the typical frequencies of the high frequency break in Cyg X-1 in both the low/hard and high/soft states.
For NGC 4395 the break frequency Hz was used together with a mass estimate of . This is the ‘best guess’ of Filippenko & Ho (2003) consistent with the available estimates: they measured a firm upper limit on the mass of from stellar velocity measurements. Based on photoionisation modelling of optical emission lines, Kraemer et al. (1999) derived an estimate of , while Filippenko & Ho (2003) estimated based on the relationship between optical luminosity and broad line region size. These are consistent with the mass estimated from the relation (Tremaine et al. 2002): . It is clear that, given the significant uncertainties in the mass estimates, there is no glaring inconsistency between the new NGC 4395 measurement and the hypothesised relation. However, the details (such as whether the index of the relation is and which, if any, state of Cyg X-1 provides the best comparison) remain to be investigated as more Seyfert power spectra are measured.

Hayashida et al. (1998) estimated the black hole masses for Seyferts by directly comparing their X-ray power spectra with that of Cyg X-1. They measured the frequency at which the power spectrum reaches the level and compared this to the corresponding frequency in Cyg X-1. The motivation for using this frequency, instead of the break frequency, is that the break is often harder to measure and (in certain states at least) is known to change frequency in Cyg X-1. There are a number of underlying assumptions to this method. The first is that both the slope and the (relative) normalisation of the high frequency power spectra are similar for Seyferts and Cyg X-1, but the frequencies scale inversely with the black hole mass. Implicit in this is the assumption that we are using comparable energy bands in the two types of source (the power spectrum is energy dependent). Furthermore, the original value of for Cyg X-1 used by Hayashida et al. (1998) was taken from an observation of the source in the low/hard state. This method therefore also assumes that Seyferts most closely resemble GBHs in the low/hard state, which may not be the case (Vaughan et al. 2003a; McHardy et al. 2004). In the case of NGC 4395 the frequency is not directly observed; the power spectrum lies well above at all measured frequencies. Extrapolating the best-fitting broken power law model to higher frequencies gives an estimate of Hz (after accounting for the factor of two difference in the normalisation used by Hayashida et al. 1998). Scaling from the corresponding frequency in Cyg X-1, as defined by equation 4 of Hayashida et al. (1998) gives an estimate for . This is comparable to the estimates made by the other methods although if, as discussed below, the normalisation of the power spectrum of NGC 4395 is unusually high, this method will not be reliable.
4.3 A universal power spectrum?
The early work on the high frequency power spectra of Seyfert galaxies found in favour of a universal power spectrum (Lawrence & Papadakis 1993; Green et al. 1993). More recent work (Uttley et al. 2002; Markowitz et al. 2003) suggests that while most Seyferts exhibit a similarly steep () power spectrum at high frequencies, the slope below the break may not be universal, and some objects may show a second break (NGC 3783; Markowitz et al. 2003) where others clearly do not (NGC 4051; McHardy et al. 2004).
The extraordinary amplitude of the variations in NGC 4395 suggest that the normalisation of the power spectrum may also vary quite substantially from object to object. A fractional rms in excess of has been noted in only two other Seyferts prior to NGC 4395 (these are NGC 4051, Green et al. 1999 and IRAS 13224–3809, Boller et al. 1997). NGC 4051 is also thought to contain a relatively low mass black hole (Shemmer et al. 2003). At first sight it remains possible that the high variability amplitudes in both NGC 4051 and NGC 4395 could be due to their power spectra being shifted to higher frequencies compared to Seyferts with more massive black holes (and, since the spectra are red, more variance is shifted into the observable frequency range) without the need for an intrinsically higher power spectrum normalisation. The power at the break multiplied by the break frequency, , is indicative of the total power in the spectrum. For NGC 4395 this is in units of . The six Seyferts studied by Markowitz et al. (2003) have values in the narrow range , all lower than NGC 4395. Papadakis (2004) estimated a ‘universal’ value of for Seyfert galaxies (called ). This means that, even after accounting for the different regions of the power spectrum observed in different objects, the normalisation of the power spectrum of NGC 4395 is intrinsically high.
What could increase the overall amplitude of the variability (at all frequencies)? A plausible suggestion is that an enhanced accretion rate (relative to Eddington) somehow provides a more unstable accretion flow and hence stronger fluctuations. The accretion rate, relative to the Eddington limit, can be estimated for NGC 4395 using the available black hole mass estimates, together with the bolometric luminosity. Moran et al. (1999) and Lira et al. (1999) estimate similar values of . Assuming a mass in the range this gives an Eddington fraction of per cent. However, the mean unabsorbed keV luminosity during the XMM-Newton observation was . Assuming would give and this, less conservative, luminosity estimate gives an Eddington fraction of per cent111 This assumes the Bolometric luminosity to be related to the mean X-ray luminosity by . If however the peak X-ray luminosity was more representative of the overall energy distribution then the luminosity could be revised upwards by a further factor of . . Thus NGC 4395 is most likely accreting at a ‘normal’ rate; super-Eddington accretion seems unlikely to be the origin of the unusually large variability amplitude. Other possibilities include the black hole spin parameter, , and the inclination of the putative accretion disc-black hole system, . Unfortunately, these are more difficult to test.
Acknowledgements
Based on observations obtained with XMM-Newton, an ESA science mission with instruments and contributions directly funded by ESA Member States and the USA (NASA). SV and KI thank the PPARC for financial support. ACF thanks the Royal Society for support. We thank an anonymous referee for a useful report.
References
- [1] Belloni T., Hasinger G., 1990, A&A, 227, L33
- [2] Boller Th., Brandt W. N., Fabian A. C., Fink H. H., 1997, MNRAS, 289, 393
- [3] Churazov E., Gilfanov M., Revnivtsev M., 2001, MNRAS, 321, 759
- [4] Collier S., et al. 2003, ApJ, 561, 146
- [5] Crenshaw D. M., Kraemer S. B., Gabel J. R., Schmitt H. R., Filippenko A. V., Ho L. C., Shields J. C., Turner T. J., 2004, ApJ, in press (astro-ph/0405354)
- [6] Edelson R. A., Krolik J. H., 1988, ApJ, 333, 646
- [7] Edelson R., Nandra K., 1999, ApJ, 514, 682
- [8] Filippenko A. V., Sargent W. L. W., 1989, ApJ, 342, L11
- [9] Filippenko A. V., Ho L. C., 2003, ApJ, 588, L13
- [10] Frank J., King A., Raine D., 1985, Accretion Power in Astrophysics, Cambridge Univ. Press (Cambridge)
- [11] Green A. R., McHardy I. M., Lehto H. J., 1993, MNRAS, 265, 664
- [12] Green A. R., McHardy I. M., Done C., 1999, MNRAS, 305, 309
- [13] Kaspi S., Smith P. S., Netzer H., Maoz D., Buell T. J., Giveon U., 2000, ApJ, 533, 631
- [14] Kraemer S. B., Ho L. C., Crenshaw D. M., Shields J. C., Filippenko A. V., 1999, ApJ, 520, 564
- [15] Hayashida K., Miyamoto S., Kitamoto S., Negoro H., Inoue H., 1998, ApJ, 500, 642
- [16] Herrero A., Kudritzki R. P., Gabler R., Vilchez J. M., Gabler A., 1995, A&A, 297, 556
- [17] Iwasawa K., Fabian A. C., Almaini O., Lira P., Lawrence A., Hayashida K., Inoue H., MNRAS, 2000, 318, 879
- [18] Jansen F. et al. 2001, A&A, 365, L1
- [19] Lawrence A., Watson M. G., Pounds K. A., Elvis M., 1987, Nature, 325, 694
- [20] Lawrence A., Papadakis I., 1993, ApJ, 414, L85
- [21] Lira P., Lawrence A., O’Brien P., Johnson R. A., Terlevich R., Bannister N., 1999, MNRAS, 305, 109
- [22] Markowitz A. et al. 2003, ApJ, 593, 96
- [23] McClintock J. E., Remillard R. A., 2004, in Lewin W. H. G., van der Klis M., eds., Compact Stellar X-ray Sources, Cambridge University Press (Cambridge), in press (astro-ph/0306213)
- [24] McHardy I. M., 1989, in J. Hunt, B. Battrick, eds, Two Topics in X Ray Astronomy, (ESA SP-296; Noordwijk: ESA), p1111
- [25] McHardy I. M., Papadakis I. E., Uttley P., Page M., Mason K., 2004, 348, 783
- [26] Moran E. C., Filippenko A. V., Ho L. C., Shields J. C., Belloni T., Comastri A., Snowden S. L., Sramek R. A., 1999, PASP, 761, 801
- [27] Nandra K., Papadakis I. E., 2001, ApJ, 554, 710
- [28] Nowak M. A., Vaughan B. A., Wilms J., Dove J. B., Begelman M. C., 1999a, ApJ, 510, 874
- [29] Papadakis I. E., Lawrence A., 1993, MNRAS, 261, 612
- [30] Papadakis I. E., Nandra K., Kazanas D., 2001, ApJ, 554, L133
- [31] Papadakis I. E., Brinkmann W., Negoro H., Gliozzi M., 2002, A&A, 382, L1
- [32] Papadakis I. E., 2004, MNRAS, 348, 207
- [33] Shemmer O., Uttley P., Netzer H., McHardy I. M., 2003, MNRAS, 343, 1341
- [34] Shih D. C., Iwasawa K., Fabian A. C., 2003, MNRAS, 341, 973
- [35] Thim F., Hoessel J. G., Saha A., Claver J., Dolphin A., Tammann G. A., 2004, AJ, 127, 2322
- [36] Tremaine S., et al. 2002, ApJ, 574, 740
- [37] Uttley P., McHardy I. M., 2001, MNRAS, 323, L26
- [38] Uttley P., McHardy I. M., Papadakis I., 2002, MNRAS, 332, 231
- [39] Uttley P., McHardy I. M., Vaughan S., 2004, MNRAS, submitted
- [40] van der Klis M., 1989, in H. Ogelman, E. P. J. van den Heuvel eds., Timing Neutron Stars, Kluwer (Dordrecht), NATO ASI Series C 262, p27
- [41] Vaughan B. A., Nowak M. A., 1997, ApJ, 474, L43
- [42] Vaughan S., Fabian A. C., Nandra K., 2003a, MNRAS, 339, 1237
- [43] Vaughan S., Fabian A. C., 2003, MNRAS, 341, 496
- [44] Vaughan S., Edelson R., Warwick R. W., Uttley P., 2003b, MNRAS, 345, 1271
- [45] Wandel A., 2002, ApJ, 565, 762
- [46] Wandel A., Peterson B. M., Malkan M. A., 1999, ApJ, 529, 579
- [47] Woo J.-H., Urry C. M., 2002, ApJ, 579, 530