HST-STIS Spatially Resolved Spectroscopy and Coronagraphic Imaging of the TW Hydrae Circumstellar Disk
Abstract
We present the first spatially resolved spectrum of scattered light from the TW Hydrae protoplanetary disk. This nearly face-on disk is optically thick, surrounding a classical T Tauri star in the nearby 10 Myr old TW Hya association. The spectrum was taken with the HST-STIS CCD, providing resolution over the wavelength range 5250 – 10300 Å. Spatially resolved spectroscopy of circumstellar disks is difficult due to the high contrast ratio between the bright star and faint disk. Our novel observations provide optical spectra of scattered light from the disk between 40 AU and 155 AU from the star. The scattered light has the same color as the star (gray scattering) at all radii, except the innermost region. This likely indicates that the scattering dust grains are larger than about 1 all the way out to large radii. From the spectroscopic data, we also obtained radial profiles of the integrated disk brightness at two position angles, over almost the same region as previously observed in HST-WFPC2 and NICMOS coronagraphic images (35 AU to 173 AU from the star). The profiles have the same shape as the earlier ones, but show a small azimuthal asymmetry in the disk not previously noted. Our STIS broad-band coronagraphic images of TW Hya confirm the reality of this asymmetry, and show that the disk surface brightness interior to 140 AU has a sinusoidal dependence on azimuthal angle. The maximum brightness occurs at a position angle of East of North. This might be caused by the combination of forward-scattering and an increase in inclination in the inner region of the disk, suggesting that the TW Hya disk has a warp like that seen in the Pictoris debris disk.
1 Introduction
TW Hydrae (catalog HIP 53911) is a classical T Tauri star, indicating that gas and dust from a circumstellar (CS) disk are accreting onto the young star (spectral type K7 Ve, distance pc). This disk has now been imaged at visible, near-IR, and millimeter wavelengths (Krist et al. (2000), Weinberger et al. (2002), Wilner et al. (2000)). The disk inclination is from face-on (Qi et al., 2004) and no azimuthal asymmetries have been previously reported. A large fraction of the stellar light is reprocessed by the CS dust to far-IR wavelengths (), indicating that the disk is optically thick (Adams et al., 1987). These characteristics suggest that the TW Hya disk is relatively unevolved for its age ( Myr; Webb et al. (1999)).
However, while 1 grains in the surface layers of the disk can produce the mid-IR spectrum of the disk, very large (mm to cm sized) grains are needed to explain the mm-wavelength spectral energy distribution (Weinberger et al., 2002). The relative lack of near-IR excess flux from the disk indicates that the inner 4 AU has been partially cleared of material, possibly by formation of a giant planet (Calvet et al., 2002). The presence of crystalline silicates in the disk, which are seen in Solar System meteorites and comets but not in the interstellar medium, also suggests that the growth of planetary material has begun (Weinberger et al., 2002; Uchida et al., 2004).
Previous broad-band photometry indicated that the disk scattering was wavelength-independent and that the grain albedo might be large (Weinberger et al., 2002). This suggests that the disk is composed mostly of icy grains larger than 1 . However, this conclusion is tentative, since it was based on broad-band photometry of the scattered light, rather than actual spectra. Also, this photometry provided no information about changes in the scattering with location in the disk.
As part of our efforts to understand how the planetary formation process depends on location in the disk, we obtained the first spatially resolved spectrum of scattered light from a protoplanetary disk. Our goals were to study the structure of the TW Hya dust disk, and the size and composition of dust grains as a function of radius from the central star. In addition, we present broad-band coronagraphic imaging of TW Hya (Section 7).
2 Observations
HST-STIS CCD spectra of TW Hya and a PSF star (CD-43 2742 = HIP 32939, spectral type M0 V) were obtained on 2002 July 17. All spectra were taken with the G750L grating and GAIN=1, covering the wavelength range 5250 – 10300 Å. The size of the pixels in the spatial direction (y-direction) is 0.051.
The sequence of exposures was 1) a point-source target acquisition, 2) a peak-up in a narrow slit () to accurately determine the position of the star in the dispersion direction (x-direction), 3) a point-source spectrum of TW Hya taken with the slit, 4) a lamp flat field image taken with the same slit, and 5) a series of spectra of TW Hya taken with the F2 slit. This slit is the same as the slit used for the point-source spectrum, but with a wide bar placed over the central star (a fiducial bar). The sequence of exposures was repeated for the PSF star. This observing strategy might be described as “coronagraphic spectroscopy”, which was necessary to reduce the amount of instrumental scattered light and allow detection of the relatively faint disk.
The resolution of the point-source spectra is at 7000 Å (corresponding to km s-1), while the resolution of the extended-source spectra is . The position angle of the slit was East of North. A log of observations appears in Table 1.
3 Data Reduction
Since the F2 slit is an unsupported observing mode, we had to calibrate the data ourselves. We started with the crj exposures produced by the STSDAS IRAF calstis pipeline version 2.14c. Basic data reduction had been performed on these exposures (overscan subtraction, bias subtraction, dark subtraction, simple flat-fielding, and cosmic-ray rejection).
3.1 Alignment of Exposures
Before adding together the crj fiducial exposures, we examined the position of the star in each and found that it did not vary significantly between exposures. Leaving out the first TW Hya fiducial exposure for the moment (o64w57030 crj.fits), the mean x and y shifts between exposures were 0.007 pixels and 0.003 pixels. The first TW Hya fiducial exposure was short (only about 14% of the exposure time of the others) and had much lower signal-to-noise, making determination of the star position less precise. Still, the maximum x and y shifts of the first exposure relative to any other were still very small (0.04 pixels in x and 0.09 pixels in y). Therefore, the five TW Hya crj fiducial exposures were added together with no realignment of the images and the exposure time in the file header changed to the sum of the individual exposure times. The shifts in position of the star between the two PSF fiducial exposures were very small (0.002 pixels in x and 0.005 pixels in y), so they were also combined with no realignment.
3.2 Defringing & Calibration
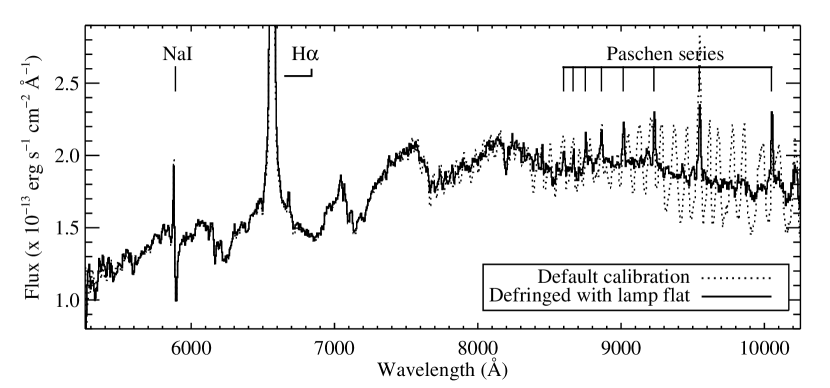
STIS CCD spectra suffer from fringing at long wavelengths, caused by interference between reflections from the front and back surfaces of the CCD (see Figure 1). Using our contemporaneous lamp flat images and IRAF tasks provided by STSDAS (prepspec, normspflat, mkfringeflat, and defringe), the fringing was removed from the point-source and fiducial data of both TW Hya and the PSF star. For the fiducial data, the defringing was performed on the combined images, since the higher signal-to-noise allows better defringing than is possible on the separate exposures.
After defringing, we were left with combined 2-D spectra in counts per pixel. These were wavelength calibrated using the STSDAS IRAF task wavecal. The point-source data were flux calibrated using the STSDAS task x1d, which extracts one-dimensional spectra from the images. The fiducial data were flux calibrated with the STSDAS task x2d, producing pixels with units of erg s-1 cm-2 Å-1 arcsec-2. This task also applies a geometrical distortion correction, producing 2-D spectra with wavelength running linearly along the x-axes of the images and distance along the slit running linearly along the y-axes.
3.3 Correction of Hot and Cold Pixels
We found that the best weekly average dark image used by the calstis pipeline still left a number of hot and cold pixels in the data. We therefore performed a sigma-clipping procedure tailored for 2-D spectra on our calibrated fiducial images. The procedure was tailored primarily by using a clip box that mimicked the shape of the data, i.e. 1201 pixels in x (full x-range of the image) by 5 pixels in y. This box worked best since the values along a row of a 2-D spectrum don’t vary as much as they do in the y-direction; a standard square clip box tended to miss hot and cold pixels in the portion of the image containing the spectrum.
If the brightest (and faintest) pixel in each clip box varied from the median value of its neighboring pixels by more than 3 times the local noise, it was replaced by the median value. The local noise was the standard deviation of the values in the clip box (spectrum noise) added in quadrature to the standard deviation of the column containing the brightest or faintest pixel (background noise). The background noise was determined in this way since it had a clear dependence on x-position (the background is worse on the long-wavelength end of the CCD). This process was applied to the data until the number of deviating pixels approached zero. This clipping procedure did not correct unreasonably large numbers of pixels (only ), remove background noise, or preferentially treat the portion of the image containing the spectrum.
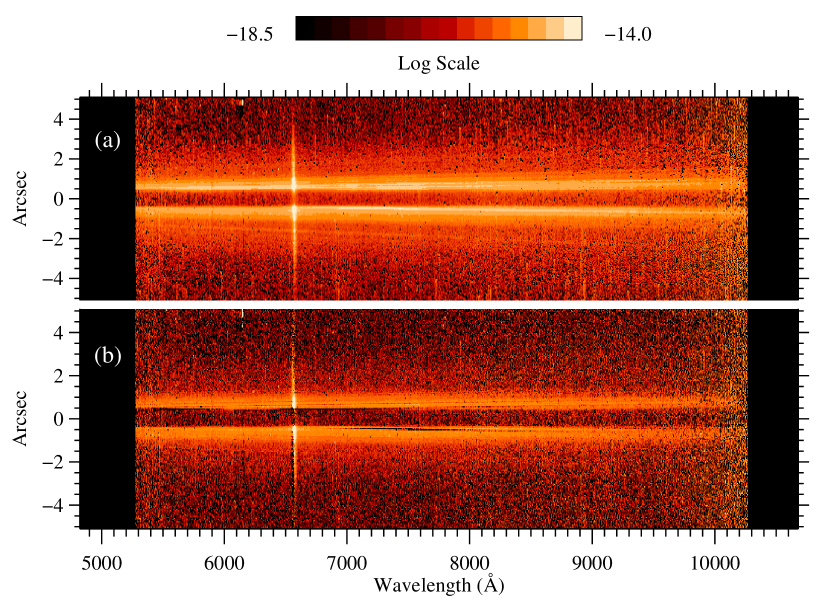
The final calibrated 2-D TW Hya fiducial spectrum appears in the top panel of Figure 2. The primary instrumental features of the 2-D spectrum are a smooth halo of scattered light and linear streaks caused by dispersing the Airy rings of the telescope PSF. These streaks angle away from the central star from left to right across the image, since the size of an Airy ring increases with wavelength (see STIS Instrument Handbook, version 6.0, Section 13.7.3 for an explanation).
3.4 PSF Subtraction
The next step in the reduction of the TW Hya data was subtraction of the stellar light from the fiducial image in order to isolate light reflected from the CS disk. The PSF star was chosen to match the spectral type of TW Hya as closely as possible, but it is not an exact match. To correct for the difference in overall brightness and spectral mismatch between TW Hya and the PSF star, we made use of the point-source spectra of both stars. Each column of the PSF fiducial image was scaled by the ratio of the TW Hya and PSF star point-source spectra at that wavelength, to produce a synthetic PSF image with the same brightness and color as TW Hya. The statistical errors of the point-source spectra were propagated into the error array of the synthetic PSF image.
The synthetic PSF image was then subtracted from the TW Hya fiducial image; the result is shown in the bottom panel of Figure 2. The remaining continuum flux seen is light reflected from the CS dust disk. At from the star, the surface brightness of the disk is slightly greater than the surface brightness of the light coming from the star (), demonstrating the excellent suppression of scattered stellar light by the fiducial bar.
The disk surface brightness at H- is somewhat greater than it should be, since the emission line in the TW Hya point-source spectrum was saturated, while the line in the fiducial exposures was not. This resulted in underestimated PSF scaling ratios at the saturated wavelengths. We were not able to correct the saturated pixels since the nonlinearity beyond saturation of the STIS CCD at GAIN=1 has not been characterized (Gilliland et al., 1999). The large scale factor at H- (caused by the fact that the PSF star doesn’t show the emission line) also produced a stripe of increased noise in the PSF-subtracted image. The H- wavelength region will be ignored in the disk spectra discussed in Section 6. A further discussion of this problem appears in Section 5.2.
4 Sources of Systematic Error
The three major factors limiting the quality of a PSF subtraction are 1) a change in the shape of the telescope point-spread function, 2) an offset in position between the target star and the PSF star, and 3) a color mismatch between the target star and the PSF star. The first factor is caused primarily by thermal flexure of the telescope; there is nothing that can be done post-observation to correct this. The only way to minimize the effect is to choose a PSF star that is near the target star on the sky, so that the telescope is oriented in the same way relative to the Sun, and to observe the target and PSF stars close together in time, which we did (observed in consecutive orbits). In Sections 5 and 6, we will discuss the artifacts introduced by this effect. Here we discuss our pre- and post-observation efforts to minimize the other two effects and characterize the systematic errors introduced.
4.1 Misalignment of TW Hya and the PSF
An offset between the positions of TW Hya and the PSF star in the fiducial images will obviously result in a degradation of the quality of the PSF subtraction. To ensure that any offset was as small as possible, a peak-up along the dispersion direction was performed after acquisition of each star. This procedure centers the star in the science slit with an accuracy of 5% of the peak-up slit width, which in our case corresponds to 0.049 x-pixels (Brown, 2002). Such a small offset does not significantly affect the quality of our PSF subtraction. However, we did not perform a peak-up along the spatial dimension to center the star in the y-direction. A STIS point-source target acquisition typically centers the star to within pixels (Brown, 2002). An offset between TW Hya and the PSF star of a few tenths of a pixel would introduce significant systematic error.
We attempted to measure the offset between the positions of TW Hya and the PSF star in the fiducial spectra several ways. Unfortunately, alignment of the two images appears to be dominated by small scale structure, and different techniques gave different offsets. As will be seen in Section 5, an offset of 0.0 y-pixels produces a PSF-subtracted 2-D spectrum with similar total disk fluxes above and below the fiducial. Since we do not expect the disk to be much brighter on one side than the other, we chose our best y-offset to be zero. In order to investigate the effect of a small misalignment in the y-direction, we produced PSF-subtracted images in which the PSF star image was shifted relative to the TW Hya fiducial image by y-pixels. The changes seen in the radial surface brightness profiles and the extracted disk spectra (discussed in Sections 5 and 6) were used to characterize the systematic error introduced by a misalignment of the TW Hya and PSF stars.
4.2 Incorrect Scaling of the PSF Star to TW Hya
Color mismatch between the target star and the PSF star can be a major source of systematic error during PSF subtraction, since the size of the telescope PSF is a function of wavelength. In the case of TW Hya, a mismatch in total brightness may also occur, since this star is variable in brightness and color on various timescales. The Cousins R and I band variability is shown below (Mekkaden, 1998).
We addressed the problems of variability and color mismatch by obtaining point-source spectra of both stars before the fiducial observations, so that we would be able do a near-time, wavelength-dependent scaling of the PSF star to TW Hya. The expected R band variability of TW Hya over the time between the point-source observation and the end of the fiducial observations (approximately 2 HST orbits 2 hours) is , corresponding to a % flux variability; the I band variability is smaller. The star should have been stable to within the uncertainty of the STIS flux calibration. We confirmed this by examining the brightness of TW Hya in the five fiducial exposures, and found that it was stable at all wavelengths at the 1% level.
Even if the brightness and color of TW Hya were stable over the course of our observations, there still might be an error in the absolute flux calibration of TW Hya or the PSF star. We examined this by adjusting the point-source fluxes by %, producing altered ratio arrays and mis-scaled synthetic images. This changes the overall brightness of the synthetic PSF images and introduces a small color mismatch as well, since the PSF star does not have a flat spectrum. Generally, this introduced a systematic error of to in the disk radial profiles and the extracted disk spectra. A few specific pixels in the outer regions of the disk where the signal is low showed larger percent errors. But as a whole, the error introduced by a reasonable estimate of the possible mismatch between the scaled PSF image and the TW Hya fiducial image is consistently smaller than the statistical uncertainty of the data.
5 Disk Radial Profiles
5.1 Total Profiles
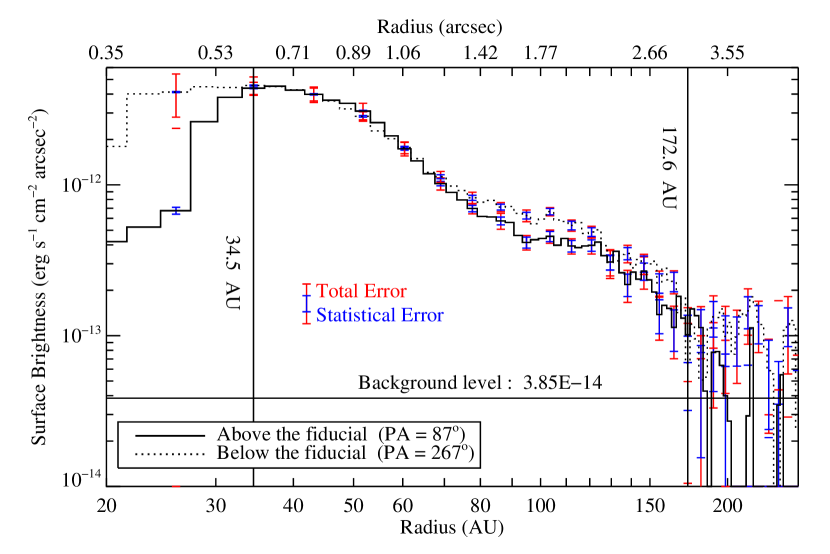
Total disk radial surface brightness profiles were produced by integrating every row of the 2-D PSF-subtracted disk spectrum over the whole G750L wavelength band (including the H- emission line). The profiles above and below the fiducial bar are shown in Figure 3. Note that “above the fiducial bar” corresponds to a disk position angle of east of north and “below the fiducial bar” corresponds to PA = . The blue error bars are the propagated statistical errors of the data, while the red error bars include the systematic error introduced by misalignment of TW Hya and the PSF image (as discussed in Section 4.1). The statistical errors exceed the systematic errors outside of AU. The inner radius at which we claim detection of the disk (34.5 AU) is the innermost radius at which the profile brightnesses above and below the fiducial are within one sigma of each other. The outermost radius (172.6 AU) is the point at which the profiles begin to be within one sigma of the background level (the median surface brightness outside of 200 AU).
The total disk fluxes are similar above and below the fiducial: erg s-1 cm-2 and erg s-1 cm-2. However, the disk is noticeably brighter below the fiducial between AU and AU. The difference in surface brightness between the two profiles, integrated over this range of radii, is significant at the level. The peak difference in surface brightness occurs at 95 AU. This azimuthal asymmetry, the first seen in the TW Hya disk, is 1 to 2 from the star, where the statistical uncertainties dominate over the systematic uncertainties and there are no visible PSF-subtraction artifacts. In Section 7, we will discuss our STIS broad-band coronagraphic imaging of the disk, which also shows azimuthal asymmetry in the disk brightness.
5.2 R and I Band Profiles
We also produced Cousins R and I band radial surface brightness profiles for comparison to previously published HST WFPC2 profiles. The conversion to surface brightness in magnitudes arcsec-2 was done by applying the following equation to every row of our 2-D disk spectrum:
| (1) |
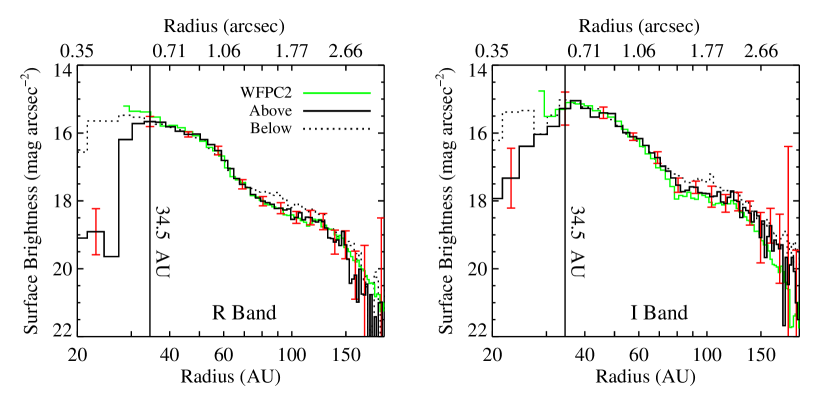
where is the disk surface brightness in magnitudes arcsec-2, is the magnitude of Vega (0.0), is the Cousins filter throughput curve from the IRAF SYNPHOT package input tables, is the disk surface brightness in units of erg s-1 cm-2 Å-1 arcsec-2 (the pixel values in our 2-D disk spectrum), and is the spectrum of Vega from SYNPHOT in units of erg s-1 cm-2 Å-1. The resulting R and I band radial profiles are shown in Figure 4. The asymmetry seen in the total profile in Figure 3 is seen in both the R and I band profiles.
The WFPC2 profiles overplotted in Figure 4 are the profiles shown in Figure 5 of Krist et al. (2000), converted from WFPC2 F606W and F814W band fluxes per arcsec2 to R and I band magnitudes per arcsec2. Our profiles show the same decrease in slope between 79 and 134 AU labeled Zone 3 by Krist et al. (2000) and also seen in HST NICMOS profiles of the disk (Weinberger et al., 2002). We note that the asymmetry between the profiles above and below the fiducial occurs over almost exactly the same region.
There is extraordinarily good agreement between the absolute brightnesses of our profiles and WFPC2 profiles, which may be somewhat surprising since the star is variable. We calculated the R and I band magnitudes of the star at the time of our observations by replacing in Equation 1 with the point-source TW Hya spectrum. The magnitudes of TW Hya were R = (including the H- emission line) and I = , slightly fainter than the mean long-term magnitudes shown in Section 4.2. The errors take into account the 5% absolute photometric accuracy of the STIS flux calibration (Brown, 2002).
Saturation of the H- emission line in the TW Hya point-source spectrum will cause our stellar R band magnitude to be somewhat underestimated. We examined this problem by comparing the observed equivalent width of the line to the H- widths seen during a 2 year-long TW Hya spectroscopic monitoring project (Alencar & Batalha, 2002). We measured an H- equivalent width of Å, which is a lower limit to the true equivalent width. This value is very close to the largest equivalent width seen (about Å; Alencar & Batalha (2002)). This shows that although the photosphere of TW Hya was fainter than usual during our observations, the H- line was quite bright; this is not strange, since there is no correlation between the H- line strength and the stellar photospheric flux (Mekkaden, 1998; Alencar & Batalha, 2002). The large equivalent width of our line also indicates that the H- point-source flux and stellar R band magnitude are probably not greatly underestimated.
The R and I band magnitudes of TW Hya during the WFPC2 observations in Krist et al. (2000) were R = and I = , which are 0.35 and 0.30 magnitudes brighter than the star at the time of our observations. The expected 0.35 and 0.30 magnitude arcsec-2 differences between our R and I band profiles and the WFPC2 profiles are not seen. We do not know the reason for the close agreement between the profiles.
6 Disk Spectra
One-dimensional spectra at increasing radii from the star were extracted from the PSF-subtracted 2-D TW Hya disk spectrum. The surface brightness values were integrated over the spatial dimension of the extraction box, then converted to flux units using the DIFF2PT header keyword produced by the STSDAS x2d tool. This keyword uses a wavelength-averaged aperture throughput value; the extracted spectra have the flux values that are correct in the center of the bandpass, but are too high and too low at the ends. This effect is removed when we divide our extracted disk spectra by the point-source stellar spectrum extracted in the same way.
The height of the extraction box was chosen to be 5 pixels (). Spectra extracted using shorter boxes showed peaks and dips due to PSF structure not completely removed by the PSF-subtraction technique. More severe PSF-subtraction residuals near the fiducial bar are the limiting factor on the radius of the innermost extraction box; we avoided the 4 pixels just above and below the fiducial. This centers the innermost spectrum at 40.3 AU, including radii from 34.5 AU () to 46.0 AU (). Avoiding the 4 pixels nearest the fiducial bar places the innermost pixel of the extraction box at the innermost radius of the disk profiles shown in Figure 3. The PSF-subtraction residuals and their effect on the extracted spectra will be discussed in more detail later in this section.
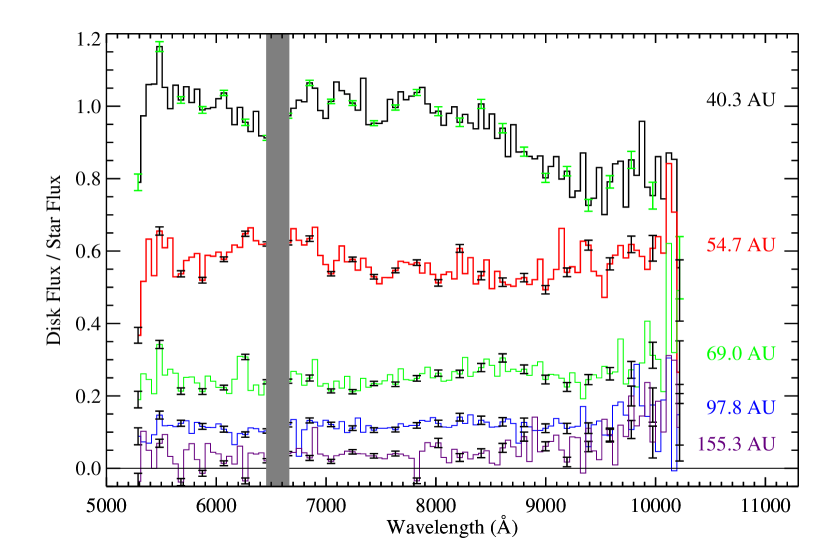
The disk spectra have the same shape at all radii above and below the fiducial bar, so they were averaged together to increase the signal-to-noise. The extracted disk spectra divided by arbitrarily scaled TW Hya point-source spectrum (the disk color spectra) are shown in Figure 5, rebinned by a factor of 10 to increase the . Misalignment of TW Hya and the PSF star (discussed in Section 4.1) does not significantly affect the disk color spectra. The error bars plotted in Figure 5 are the propagated statistical errors. The per resolution element (2 x-pixels) of the spectra are 15 at 40.3 AU, 13 at 54.7 AU, 7 at 69.0 AU, 4 at 97.8 AU, and 1 at 155.3 AU. The disk color spectra are flat between 55 AU and 155 AU, indicating that the scattering function is wavelength-independent over the bulk of the disk (neutral or gray scattering).
In the innermost spectrum, the disk-to-star ratio increases at shorter wavelengths; the disk scattering appears significantly bluer than it does at larger radii. Although we have avoided the worst residuals near the fiducial, we must carefully consider whether this feature is real or due to imperfect PSF subtraction. Unfortunately, the data do not exist to accurately quantify the effect of PSF subtraction residuals in STIS fiducial spectra, since very few observations were taken in this mode. We tried to quantify the effect of residuals in our data in several ways, including analysis of a set of G750L spectra taken with F2 under calibration program 8844. But these observations were not planned with PSF stability in mind; the best subtraction we could achieve, using the calibration observations closest in time, of the two stars most closely matched in spectral type, was obviously much worse than what we achieved for TW Hya.
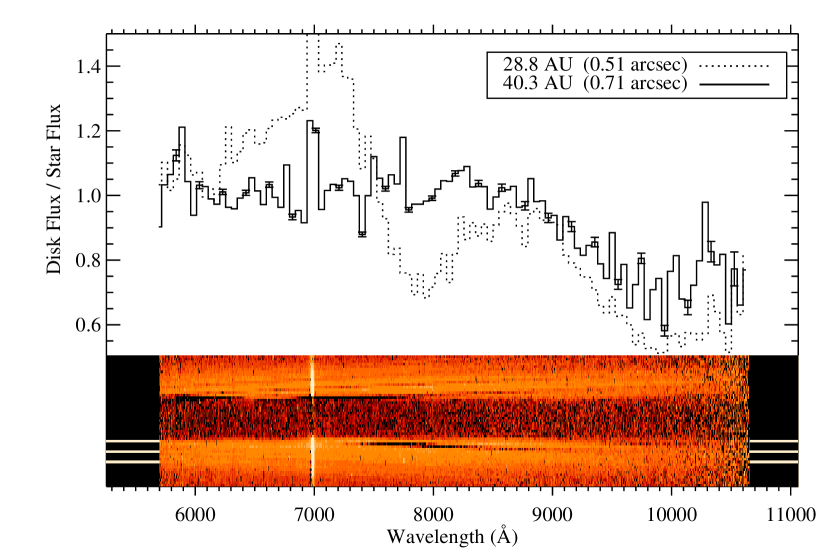
We are reduced to qualitative arguments about the reality of the blue scattering seen in the spectrum extracted at 40.3 AU. In Figure 6, the innermost region of the PSF-subtracted 2-D disk spectrum is shown at the bottom. The worst PSF-subtraction residual is visible as a dark stripe just below the fiducial bar. The spectra extracted at 28.8 AU and 40.3 AU are shown at the top of the figure; the white bars at the edge of the disk image show the limits of the extraction boxes in the y-direction. The spectrum at 28.8 AU is just at the edge of the fiducial bar, and includes the worst residual. It may be seen in the extracted spectrum as a roughly 30% dip between about 7000 Å and 8400 Å.
Since the PSF-subtraction residuals angle away from the fiducial bar from left to right, it might be possible that the worst residual moves into the 40.3 AU extraction box at longer wavelengths. However, the depth of the decrease in the disk color spectrum at long wavelengths is about 30%. A residual that could make such a deep dip in the extracted spectrum should be visible in the 2-D spectrum; there is no visible residual in the 40.3 AU extraction box. Also, the disk color spectrum extracted above the fiducial is the same as that extracted below, i.e. bluish. There is no obvious PSF-subtraction residual above the fiducial that could cause this. The blue scattering in the 40.3 AU spectrum is probably real, but we are not able to prove it conclusively.
7 STIS Coronagraphic Imaging of TW Hya
7.1 Observations
STIS CCD images of TW Hya and a different PSF star (HD 85512), were obtained on 2000 November 3 and 2000 December 27. After a standard point-source target acquisition, the stars were observed with the WEDGEA1.0 coronagraphic aperture. This is a 1″ wide location on the tapered wedge parallel to the CCD charge transfer direction. The STIS CCD is unfiltered, covering essentially the entire visible bandpass. The stars were observed with GAIN=4 to increase the dynamic range of the images. At this gain, the electronics read out the full well of the CCD. Individual frames of 226 s were acquired on TW Hya and 56 s on the PSF, chosen to be longer than the read-out time of the CCD for increased efficiency and short enough to avoid saturating the pixels just outside the wedge. The TW Hya field rotated 33∘ with respect to the STIS CCD between the two visits. The coronagraphic imaging observations are listed in Table 1.
7.2 Data Reduction
Calstis performs all of the necessary image reduction, including combination of the CR-SPLIT exposures. We then combined the repeated exposures, weighting by their integration times, to produce an image in counts per sec. Although bias is supposed to be subtracted in this process, we found that the CCD frames were distinctly non-zero in the portions well away from the disk. We took the median value of the pixels in the field and subtracted it from the frame to bring the bias to zero.
7.3 PSF Subtraction
As with the spectroscopy, to remove the stellar point spread function from the image of the disk, a PSF star must be subtracted. We used the diffraction spikes to align and scale the PSF star separately to the two visits of TW Hya, finding the best subtraction through minimization. This process reveals a (-0.53, 0.00) pixel shift between the PSF and TW Hya in the first visit and a (-0.08, -0.72) shift for the second visit. The error in the alignment is pixels in x and y. The best scale factors indicate that the PSF was 3.16 mag brighter than TW Hya in November and 3.08 mag brighter than TW Hya in December. The SIMBAD database gives the V magnitude difference between the two stars as 3.2 mag, so these scales are reasonable. Assuming that the PSF does not vary in brightness, these scalings show that TW Hya was 0.08 mag brighter in November than December. This is within the variability of TW Hya in the V and R-bands on month time-scales (Mekkaden, 1998).
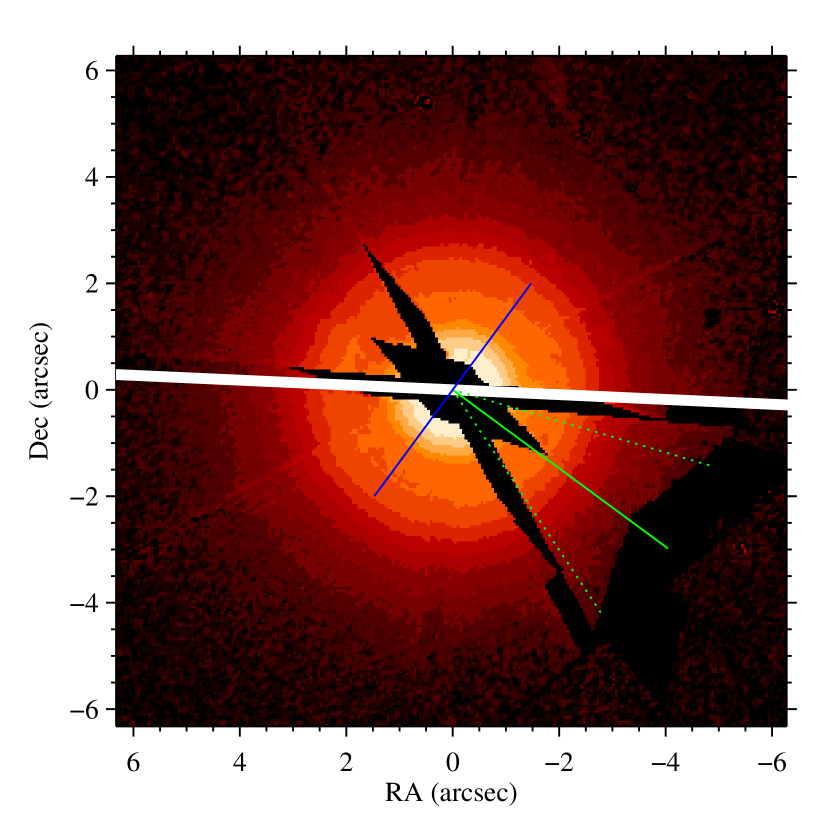
Next, the December PSF-subtracted image was scaled and registered to the November PSF-subtracted image using the offsets and scale factors measured above. Both images were rotated to put North up and East left. Then, the wedges and four pixel wide swaths across the diffraction spikes were masked. The two images were combined by averaging pixels that were unmasked in both images or using pixels that were unmasked in one or the other of the images. The final image is shown in Figure 7. Pixels that were masked in both orientations are blacked out in this image. The slit used in the spectroscopic observations is overlaid in white for illustration.
7.4 Results
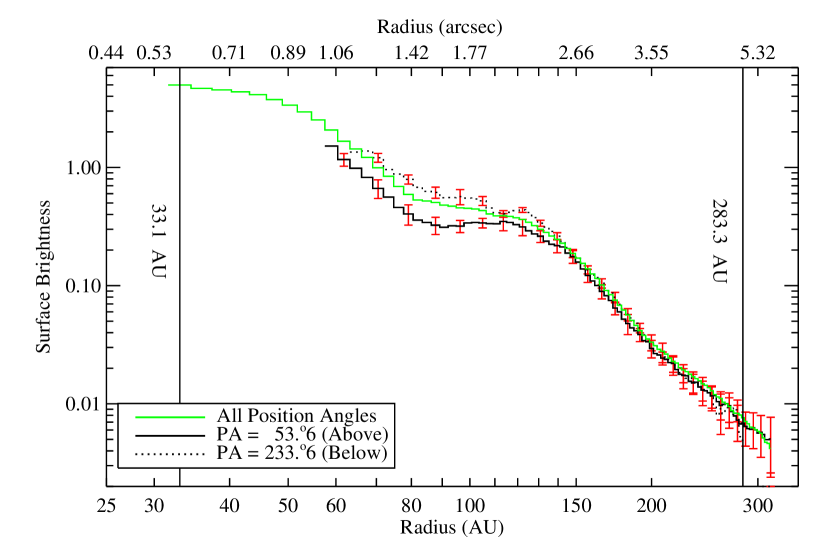
The radial surface brightness profiles from the coronagraphic image are shown in Figure 8. The azimuthally-averaged radial profile shows that the disk is detected from 33 AU () to 283 AU () in the final coronagraphic image. The inner radius is set by the size of the coronagraphic wedge and the outer radius is the point outside of which the surface brightness is less than 3 times its uncertainty.
Although the disk looks quite circular by visual inspection, a quantitative analysis demonstrates that it is asymmetric. Figure 9 shows the brightness of the disk between 70 and 88 AU as a function of position angle in intervals. The disk brightness peaks at PA = and is well fit by a sine function; this error bar is the statistical error. The direction of maximum brightness is indicated with a green line on the disk image in Figure 7. The ratio of the disk brightnesses in the directions of minimum and maximum brightness is (again, statistical error). The min/max brightness ratio is relevant to analysis in Section 8.1 below.
To estimate the systematic errors introduced by misalignment of the PSF and TW Hya, we offset the PSF image by pixels along the direction of maximum brightness. Offsets in this direction should produce the largest changes to the azimuthal brightness asymmetry. The offset PSF image was subtracted from TW Hya and the sine fit to the brightness vs. position angle recalculated. We find that the change to the min/max brightness ratio is only , which is smaller than the statistical uncertainty (). To estimate the total systematic error in our PSF subtraction, we compared the results from the sine fit to the combined data to the results from fits to the November and December data separately. The difference in the maximum brightness direction between the two visits was , the same as the statistical uncertainty of quoted above. Our conservative estimate of the systematic error in the min/max brightness ratio is . This shows that most of the systematic error is not due to misalignment, but more likely due to changes in the shape of the PSF
The profiles including only pixels with position angles within of the directions of maximum and minimum brightness are also shown in Figure 8. Unfortunately, the maximum brightness profile (PA ) only reaches in to 65 AU and the minimum brightness profile (PA ) only reaches in to 62 AU, due to the position of the coronagraphic wedge in both visits. But the profiles clearly show that the disk is significantly brighter on one side between 65 AU and 140 AU. The difference in surface brightness between the two profiles, summed over this range of radii, is significant at the level. Exterior to 140 AU, the disk is symmetric.
The position angle of the slit in the spectroscopic observations “below the fiducial” is only away from the direction of maximum brightness, and comparison of the profiles in Figures 3 and Figure 8 is instructive. The profiles are qualitatively similar, both showing that the disk is brighter in the “below the fiducial” direction over some range of radii around AU. However, the coronagraphic profiles show that the disk is significantly asymmetric over a larger range of radii than the spectroscopic profiles do. The reason for this may be the larger error bars of the spectroscopic profiles and/or the arbitrary alignment of the TW Hya and synthetic PSF fiducial images in the y-direction before subtraction, as discussed in Section 4.1.
8 Discussion
8.1 Azimuthal Asymmetry in the Disk Radial Profiles
Our spectroscopic and coronagraphic disk radial surface brightness profiles show the first azimuthal asymmetry seen in the TW Hya disk. The coronagraphic profiles show that the disk is brighter on one side than the other between 65 and 140 AU, with the maximum brightness occurring at PA = (including the systematic uncertainty). We are not sure exactly how far in toward the star this asymmetry extends, due to the limitation of the wedges in the coronagraphic images and the possible misalignment in the y-direction of the TW Hya and PSF spectroscopic fiducial images.
Forward-scattering can cause a sinusoidal brightness asymmetry between the near and far sides of an inclined, optically thick disk (e.g. GG Tau A; McCabe et al. (2002)). However, we must explain why the asymmetry is only seen interior to 140 AU. The first suggestion is that the grains in the inner disk are more strongly forward scattering. However, the disk color spectra show no change between 55 and 155 AU, above or below the fiducial (see Figure 5), which leads us to believe that the asymmetry is not due to a change in grain composition or size at 140 AU. The second suggestion is that the disk inclination is larger interior to this radius, i.e. that the disk is warped. In this scenario, the direction of maximum brightness is the minor axis of the inclined inner disk, and the PA of the major axis is . This PA roughly agrees with that deduced from sub-mm CO emission observations showing the Keplerian rotation of the disk (; Qi et al. (2004)).
If the asymmetry is due to forward-scattering, then its magnitude may be used to calculate a lower limit to the inner disk inclination. The minimum to maximum surface brightness ratio from the sine fitting discussed in Section 7.4 is , including the systematic error. Using a Henyey-Greenstein scattering phase function (Henyey & Greenstein, 1941), the ratio of the minimum to maximum surface brightness is
| (2) |
where is the dust asymmetry parameter ( indicates purely forward-scattering, indicates isotropic scattering) and is the disk inclination ( corresponds to face-on). Using the maximum possible value of , we find an inner disk inclination of . This is barely consistent with the inclination of found by Qi et al. (2004) from their sub-mm CO data. However, note that the sub-mm data probe a wide range of radii in the disk and give some sort of mean disk inclination.
Using a more plausible value of , we find an inclination of . Our lower limit () is significantly greater than the upper limit on the inclination found from isophotal-fitting to the TW Hya NICMOS imaging data (; Weinberger et al. (2002)). Our data have 50% better spatial resolution than the NICMOS coronagraphic images. Given that the region over which the disk appears asymmetric is small, i.e. 65–140 AU or only 13, the STIS images are uniquely suited for measuring the inclination.
A warped inner disk has been observed in the Pictoris debris disk (see Figure 8 in Heap et al. (2000)). Two possible explanations have been put forward for disk warps (Heap et al., 2000). In the first, warps form through radiation-induced instability in accretion disks surrounding luminous stars (Armitage & Pringle, 1997). The problem with this explanation is that the star must have a luminosity greater than about , while the TW Hya luminosity is only about 0.25 (Webb et al., 1999). In the other explanation, the warp is caused by the gravitational perturbation of a giant planet on an inclined orbit. The presence of a protoplanet in the TW Hya disk has already been suggested to explain the dearth of material within 4 AU of the star (Calvet et al., 2002). But it is not clear if a single protoplanet can explain both the central hole and the disk azimuthal brightness asymmetry.
8.2 Grey Scattering Over the Bulk of the Disk
The scattering over the bulk of the disk is clearly wavelength-independent in the optical, in contrast to the results of Krist et al. (2000), who found the disk to be bluer than the central star. To determine what this might mean for the properties of the TW Hya dust, we examine the McCabe et al. (2002) Monte Carlo scattering simulation of GG Tau A, a classical T Tauri star binary system surrounded by a massive disk.
The scattered surface brightness at any one angle, , is proportional to , where is the grain albedo and is the number of scattering events. An increase in produces a decrease in . The number of scattering events depends on the dust asymmetry parameter, , which is a function of wavelength. Note that in the case of TW Hya, the relatively low inclination of the disk indicates that the observed photons have all scattered through almost the same angle ().
The wavelength-dependence of the scattered light is determined by the combination of the wavelength-dependences of and . The wavelength-dependence of the albedo tends from blue (Rayleigh scattering; small particles) to neutral (large particles). The dust asymmetry parameter increases with the size parameter , reaching a roughly constant value at (Wolff et al., 1998). Since an increase in produces an increase in and a decrease in , the effect of the dust asymmetry parameter is red (small particles) to neutral (large particles) scattering. Therefore, an optically thick scattering situation may produce any color light. Which parameter dominates depends on the number of scattering events. For example, in a relatively low density case (low ), the wavelength-dependence of is dominated by . The scattered light will be blue to neutral, depending on the particle size. In a high density case (high ), will dominate, and the scattered light will be red to neutral.
So there are two ways to get neutral scattering from a disk. In the first, the number of scattering events is such that a blue albedo is exactly canceled by a red dust asymmetry parameter; this implies relatively small scattering particles. In the other, the scattering grains are so large that and are wavelength-independent. For the first scenario to produce neutral scattering from the TW Hya disk over such a large range of radii ( AU), the number of scattering events would have to be just right and not change much with radius. It seems more likely that the second scenario applies and relatively large grains are present between about 55 and 155 AU. Our disk spectra show that the bulk of the disk neutrally scatters wavelengths between about 5500 and 1 ; this indicates grains larger than . Since the disk appears to scatter neutrally all the way into the near-IR (1.6 ; Weinberger et al. (2002)), the particle size is likely greater than 1 . These arguments and conclusions will be quantitatively tested in a future paper by application of the McCabe et al. (2002) Monte Carlo scattering code to the TW Hya disk.
8.3 Scattering Change in Innermost Region of Disk
We now consider what the apparent change in the wavelength-dependence of the scattered light interior to 55 AU might mean. From the above arguments, blue scattering occurs when the number of scattering events and the grain sizes are both relatively small. If we imagine for a moment that the the scattering particles are small over the whole disk, the blue scattering at small radii could be caused solely by a decrease in the number of scattering events with decreasing radii. However, since we previously argued that the grains in the outer regions of the disk are large, the change in scattering at small radii must also indicate a decrease in particle size.
The idea that there are more small particles close to the star at first seems counterintuitive, since the coagulation of condensed grains occurs faster at smaller radii. However, the destruction of planetary material also occurs first at smaller radii, as evidenced by central holes in many debris disks. Sub-micron grains in debris disks, like the 12 Myr old Pictoris system (Zuckerman et al., 2001), must be produced by collisions among planetesimals (Artymowicz, 1988). We therefore suggest that blue scattering at small radii in the TW Hya disk may be evidence that the clearing out of solid planetary material has begun in the inner disk.
9 Concluding Remarks
These observations demonstrate the usefulness of high-contrast coronagraphic spectroscopy of scattered light from CS disks. We here summarize our principal observational results from this study of the TW Hya protoplanetary disk.
-
1.
Interior to 140 AU, the disk surface brightness shows a sinusoidal dependence on azimuthal angle. The maximum brightness is at PA = . The origin of this feature requires further study, but we suggest it is caused by an increase in inclination in the inner part of the disk, i.e. a warp.
-
2.
The disk spectra definitively show that the scattering is wavelength-independent in the optical between 55 AU to 155 AU from the star. We argue this indicates that the scattering grains are larger than about 1 out to large radii.
-
3.
The color of the scattered light from the innermost portion of the disk (34.5 – 46.0 AU) appears bluer than the outer disk. This result is tentative, due to possible systematic errors in PSF subtraction close to the fiducial bar. However, taken at face value, the change in color might indicate a decrease in grain size at small radii.
References
- Adams et al. (1987) Adams, F. C., Lada, C. J., & Shu, F. H. 1987, ApJ, 312, 788
- Alencar & Batalha (2002) Alencar, S. H. P., & Batalha, C. 2002, ApJ, 571, 378
- Armitage & Pringle (1997) Armitage, P. J., & Pringle, J. E. 1997, ApJ, 488, L47
- Artymowicz (1988) Artymowicz, P. 1988, ApJ, 335, L79
- Brown (2002) Brown, T. e. a. 2002, HST STIS Data Handbook, version 4.0 (ed. B. Mobasher, Baltimore, STScI)
- Calvet et al. (2002) Calvet, N., D’Alessio, P., Hartmann, L., Wilner, D., Walsh, A., & Sitko, M. 2002, ApJ, 568, 1008
- Gilliland et al. (1999) Gilliland, R. L., Goudfrooij, P., & Kimble, R. A. 1999, PASP, 111, 1009
- Heap et al. (2000) Heap, S. R., Lindler, D. J., Lanz, T. M., Cornett, R. H., Hubeny, I., Maran, S. P., & Woodgate, B. 2000, ApJ, 539, 435
- Henyey & Greenstein (1941) Henyey, L. C., & Greenstein, J. L. 1941, ApJ, 93, 70
- Krist et al. (2000) Krist, J. E., Stapelfeldt, K. R., Ménard, F., Padgett, D. L., & Burrows, C. J. 2000, ApJ, 538, 793
- McCabe et al. (2002) McCabe, C., Duchêne, G., & Ghez, A. M. 2002, ApJ, 575, 974
- Mekkaden (1998) Mekkaden, M. V. 1998, A&A, 340, 135
- Qi et al. (2004) Qi, C., Ho, P. T. P., Wilner, D. J., Takakuwa, S., Hirano, N., Ohashi, N., Bourke, T. L., Zhang, Q., Blake, G. A., Hogerheijde, M., Saito, M., Choi, M., & Yang, J. 2004, ApJ, in press (astro-ph0403412)
- Uchida et al. (2004) Uchida, K. I., Calvet, N., Hartmann, L., Kemper, F., Forrest, W. J., Watson, D. M., D’Alessio, P., Chen, C. H., Furlan, E., Sargent, B., Brandl, B. R., Herter, T. L., Morris, P., Myers, P. C., Najita, J., Sloan, G. C., Barry, D. J., Green, J., Keller, L. D., & Hall, P. 2004, ApJS, 154, 439
- Webb et al. (1999) Webb, R. A., Zuckerman, B., Platais, I., Patience, J., White, R. J., Schwartz, M. J., & McCarthy, C. 1999, ApJ, 512, L63
- Weinberger et al. (2002) Weinberger, A. J., Becklin, E. E., Schneider, G., Chiang, E. I., Lowrance, P. J., Silverstone, M., Zuckerman, B., Hines, D. C., & Smith, B. A. 2002, ApJ, 566, 409
- Wilner et al. (2000) Wilner, D. J., Ho, P. T. P., Kastner, J. H., & Rodríguez, L. F. 2000, ApJ, 534, L101
- Wolff et al. (1998) Wolff, M. J., Clayton, G. C., & Gibson, S. J. 1998, ApJ, 503, 815
- Zuckerman et al. (2001) Zuckerman, B., Song, I., Bessell, M. S., & Webb, R. A. 2001, ApJ, 562, L87
| ID | Target | Time | Exp. Time | Aperture | Comment |
|---|---|---|---|---|---|
| (UT) | (s) | ||||
| Spectroscopy | |||||
| 2002 July 17 | |||||
| o64w57010 | TW Hya | 02:48:46 | 72 | 52 0.2 | point source |
| o64w57020 | Lamp Flat | 02:52:08 | 25 | 52 0.2 | |
| o64w57030 | TW Hya | 04:03:32 | 198 | 52 0.2F2 | fiducial |
| o64w57040 | ” | 04:09:02 | 1380 | 52 0.2F2 | ” |
| o64w57050 | ” | 05:44:00 | 1380 | 52 0.2F2 | ” |
| o64w57060 | ” | 06:13:18 | 1221 | 52 0.2F2 | ” |
| o64w57070 | ” | 07:25:00 | 1380 | 52 0.2F2 | ” |
| o64w58010 | CD-43 2742 | 00:38:55 | 36 | 52 0.2 | PSF star, point source |
| o64w58020 | Lamp Flat | 00:41:41 | 25 | 52 0.2 | |
| o64w58030 | CD-43 2742 | 00:44:41 | 684 | 52 0.2F2 | PSF star, fiducial |
| o64w58040 | ” | 01:00:29 | 665 | 52 0.2F2 | ” |
| Imaging | |||||
| 2000 November 3 | |||||
| o64w04010 | TW Hya | 21:01:21 | 904 | WEDGEA1.0 | |
| o64w04020 | ” | 21:19:21 | 1260.2 | WEDGEA1.0 | |
| o64w05010 | HD 85512 | 22:29:20 | 416 | WEDGEA1.0 | PSF star |
| o64w05020 | ” | 22:42:08 | 416 | WEDGEA1.0 | ” |
| o64w05030 | ” | 22:54:56 | 416 | WEDGEA1.0 | ” |
| o64w05040 | ” | 23:07:44 | 156 | WEDGEA1.0 | ” |
| 2000 December 27 | |||||
| o64w06010 | TW Hya | 13:51:48 | 904 | WEDGEA1.0 | |
| o64w06010 | TW Hya | 14:09:48 | 1260.2 | WEDGEA1.0 | |
Note. — All spectroscopic data were taken with the STIS CCD at GAIN=1, using the G750L grating. All imaging data were taken with the unfiltered (clear) CCD at GAIN=4.