Truncation of stellar disks in galaxies at z 1 ††thanks: Observations carried out using the Very Large Telescope at the ESO Paranal Observatory, Program ID 170.A-0788
We report here the first evidence for stellar disk truncation at high redshift, based on surface photometry of a sample of 16 high redshift (0.6 z 1.0) disk galaxies from the GOODS HST/ACS data. The radial profiles are best fit by a double exponential profile. This result agrees with the profile of disks in local galaxies. The cosmological surface brightness dimming at this redshift range only allows us to detect galaxies with spatially “early” truncation, Rbr/h 3.5. Six galaxies show the radial double exponential structure, with an average value of Rbr/h 1.8. Such “early” truncated galaxies are missing in local samples so far. This result opens the ground for observing directly disk evolution through the study of the truncation radius as a function of redshift.
Key Words.:
Galaxies: spiral – Galaxies: evolution – Galaxies: high-redshift – Galaxies: structureemail: isa@astro.rug.nl
1 Introduction
The finite size of stellar disks was first reported by van der Kruit (1979) who showed that disks were sharply truncated at around 4 scale-lengths. Recently, evidence has arisen that this truncation does not occur sharply but instead radial profiles are best fit by a double exponential shape (de Grijs et al., 2001; Pohlen et al., 2002). For nearby objects, the profiles obtained from a sample of edge-on galaxies show a two-slope exponential with Rbr/hin in the range (Kregel et al., 2002), where Rbr, the break radius, is the radius where the slope changes and hin is the inner disk scale-length (see Pohlen et al., 2004; for a recent review on the truncation radius). This truncation might be related to a surface density threshold for star formation (Kennicutt, 1989) or might be related to the maximum specific angular momentum of the sphere from which the disk collapsed (van der Kruit, 1987). While galaxy formation models have been able to reproduce the observed double exponential profile (van den Bosch, 2001; Zhang & Wyse, 2000), none of these models have considered evolution of the truncation radius with redshift. At z 1, galaxies are half the age of local objects and one can probe into a period where evolutionary effects may be significant (Mao et al., 1998). A study of the evolution of the truncation radius can help to discern between truncation arising as a relic from galaxy formation or due to a star formation threshold. Such a project has been carried out as a pilot survey using HST archival data and is reported in this Letter.
2 Sample and profile fitting
The cosmological dimming ((1+)4) determined our choice of the maximum redshift to reach the outermost isophotes ( 25.5mag. arcsec-2 ). The lower redshift limit was chosen to ensure a reasonable number of objects in the final sample, at a redshift where evolutionary effects should still be significant Mao et al. (1998). A range of 0.6 z 1.0 was finally chosen. This range implies a dimming between magnitudes with an isophotal threshold range between mag. arcsec-2 . Our sample consists of 16 galaxies selected from the CDF-S and the HDF-N from the V1.0 GOODS HST/ACS Data Release (Giavalisco & et al., 2004). The HST/ACS -band images were used for the analysis to ensure that the rest frame of the above galaxies ( and -band) corresponds to the wavelength of widely observed local samples. The redshifts for the southern fields were obtained from the ESO/VLT GOODS (Vanzella et al., 2004) and the COMBO 17 projects (Wolf et al., 2004) and for the northern fields, from Keck DEIMOS spectra (Wirth et al., 2004). The galaxies were visually selected to be relatively symmetric and not strongly interacting. Hubble types range from Sa to Sc (our visual classification of the HST/ACS -band images) and galaxy inclination angles (derived from the ellipticity of the outermost isophote) are all less than 35∘. It should be emphasised that the sample was not created with the intention of being used as a complete statistical sample. It is, in fact, an initial sample to determine whether we can find stellar disk truncation at high-z and whether the derived values fall within the local range.
Ellipse fitting to the light distribution was performed using the ELLIPSE task within IRAF. All the galaxies showed point-like nuclear regions. So, the center was fixed using the coordinates obtained by fitting a Gaussian to the nucleus. The position angle (PA) and the ellipticity () were left as free parameters in the fitting. Profiles with fixed PA and were also obtained, no influence in the break radius was found. The free PA fitting profiles were chosen to determine whether there were any systematic relation between the position of morphological features with the truncation radius. No attempt was made to do a bulge-disk decomposition, and the disk was assumed to dominate the light profile beyond 1 scale-length, a good assumption for Sb and later types (de Jong, 1996); implications of this fitting procedure are discussed in Section 3. The zero point to convert the count rate into an AB magnitude for the GOODS -band was taken from the ACS web page (F850LP = 24.84). The sky background was subtracted by taking the mean value of boxes placed around the galaxies in regions far from the target galaxies. The standard deviation of the median of the distribution in the different boxes was adopted as the error in the background determination.
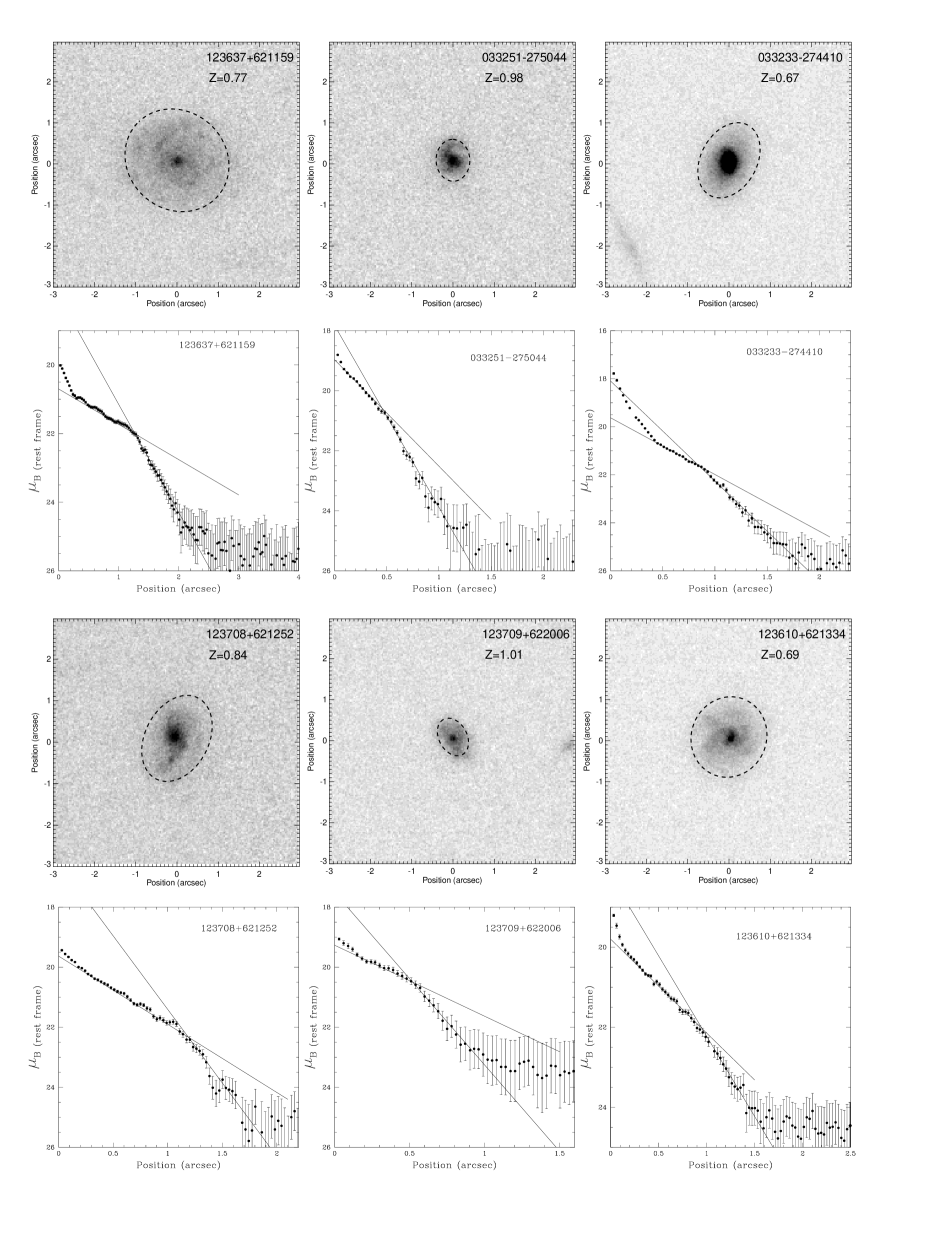
We then fit two exponential functions of the form exp to the 1-D azimuthally averaged profile ( refers to the inner disk and to the outer exponential disk). The criterion used for detection of truncation was that the outer exponential should extend to at least 2 hout before reaching the noise level. The break radius was first visually determined, with an error around 12%. This value was used to separate the fitting regions for the inner and the outer exponentials; excluding the bulge region. The final break radius is defined as the radius where the two fitted exponential profiles cross. Fig.1 shows the fitted functions plotted on top of the derived profiles. While the error in the inner scale-length is dominated by the effect of the bulge, the outer scale-length error is dominated by the determination of the break radius and the sky-subtraction. Table 1 shows the errors in the outer scale-length determination when doing the fitting to profiles 1 of the sky-level including the error in the break radius determination.
A correction for cosmological dimming was applied (H0 = 71 km s-1 Mpc-1, = 0.3 and = 0.7 throughout this work including converting the measured angular sizes to physical sizes using the given redshifts), with k-corrections estimated using the results of Fukugita et al. (1995). First, the k-correction for the HST/ACS -band was computed for galaxy morphological type Sbc for each of the redshift values, the error in the K-correction is 0.25 mag. Then, the -band was transformed to -band assuming the rest-frame ( ) = 2.140.15 (Fukugita et al., 1995) for the same morphological type.
3 Results and comparison to nearby objects
Of the 16 galaxies, six show a two-slope profile that we identify with a truncated disk. This result agrees with that found for nearby objects (Pohlen, 2001, and references therein). The list of galaxies and the 1-D exponential fitting parameters and errors are presented in Table 1. The azimuthally averaged (360∘) profiles are shown in Fig. 1. Averaged profiles of different image segments were also computed (90∘ and 180∘ sections) to check for systematic differences but no significant changes were found in the profiles. The Rbr/hin occurs at 1.8 0.5. Unsharp-masking was used to locate the position of the end of the spiral structure and to compare it to the Rbr radius. In two cases (123637+621159 and 03325127504) the truncation seems to be related to the end of the spiral arms. The surface brightness at which the break occurs happens at a mean value of 21.7 mag. arcsec-2 (rest-frame -band).
To compare the value obtained for the high-z galaxies (Rbr/hin ranging between 1.3-2.2) with the value for nearby objects we used two different local samples. The mean value of Rbr/hin obtained for a sample of three nearby face-on galaxies (Pohlen et al., 2002) is 3.9 0.7. Another result from the analysis is that the hin/hout ratio obtained for the high-z galaxies (2 0.9) is remarkably similar (2 0.2) to that obtained by Pohlen et al. (2002). Notice the small average Rbr/hin obtained for the high-z galaxies compared to the value for local galaxies; this will be referred as “early” truncation throughout the paper. It is interesting to compare to this small sample because of the similarities to our sample in the methodology used and the galaxy characteristics. A larger sample of nearby edge-on galaxies (20 galaxies) was studied by Kregel et al. (2002) with a mean value of Rbr/hin = 4.01.1. To make a fair comparison we have to convert these values, obtained in the -band, to the -band (de Grijs, 1998). The ratio hin,B/hin,I has been estimated to be 1.32 0.24 for all morphological types (de Grijs, 1998), taking into account this value we can re-calculate the local value for the -band, giving a average Rbr/hin = 2.90.9. In this way the highest values found for the high-z galaxies would fall in the low-value tail of the local galaxies; however, the lowest values still fall below the local distribution. One should also point out that the methodology used by Kregel et al. (2002) to extract the different parameters is different to the one adopted in this work. Another point to notice is that there is still no clear result about the dependence of the break radius with wavelength in local galaxies.
The remaining ten galaxies show no truncation down to Rbr = h (depending on the galaxy). The derived scale-lengths and central surface brightnesses from the one-exponential fitting are comparable to those of the “early” truncated galaxies. These galaxies either do not show truncation or might be the counterparts of local galaxies, with spatially “late” truncation.
The central disk surface brightness derived for all 16 galaxies of the sample is a few magnitudes brighter than the Freeman value 21.6 - = 2.0 1.0 mag (Freeman, 1970). No bulge-disk decomposition was carried out, this can lead us to overestimate the obtained central surface brightness. From a test performed on a sample of local galaxies ranging from Sa to Sc we estimated the maximum error from not taking into account the bulge to be mag. The errors in our central surface brightness estimates are high due to the k-correction and the bulge-disk decomposition errors. However, correcting for this still cannot account for the difference of around 2 magnitudes found for the central surface brightness.
As an internal check, we determined the same parameters for the three face-on galaxies of Pohlen et al. (2002) using their images and a comparable strategy to the one used for the high-z galaxies. We obtained similar parameters for the break radius and the scale-lengths as the ones derived by Pohlen et al. (2002), although there are some differences in the techniques used.
| ID | z | hin | hin | error | hout | error | Rbr | error | Rbr/hin | error | ||
|---|---|---|---|---|---|---|---|---|---|---|---|---|
| (kpc) | (arcsec) | (arcsec) | (arsec) | (arcsec) | (arcsec) | (arcsec) | ||||||
| 123610+621334 | 0.69 | 6.1 | 0.59 | 0.14 | 0.33 | 0.10 | 0.99 | 0.18 | 19.7 | 21.7 | 1.7 | 0.5 |
| 123637+621159 | 0.78 | 11.0 | 0.99 | 0.13 | 0.36 | 0.15 | 1.32 | 0.08 | 20.6 | 21.9 | 1.3 | 0.2 |
| 033251-275044 | 0.98 | 3.5 | 0.28 | 0.04 | 0.15 | 0.07 | 0.51 | 0.07 | 18.9 | 20.7 | 1.8 | 0.3 |
| 033233-274410 | 0.67 | 4.6 | 0.45 | 0.2 | 0.24 | 0.09 | 0.97 | 0.05 | 19.6 | 21.8 | 2.2 | 1.0 |
| 123709+622006 | 1.01 | 4.5 | 0.36 | 0.06 | 0.18 | 0.08 | 0.48 | 0.08 | 19.2 | 20.5 | 1.3 | 0.3 |
| 123708+621252 | 0.84 | 5.9 | 0.51 | 0.03 | 0.25 | 0.13 | 1.10 | 0.16 | 19.6 | 21.7 | 2.2 | 0.3 |
4 Discussion and summary
High-z galaxies are dustier than local galaxies. This will influence the hin making it appear larger. The true hin would need to be 50% smaller in order to raise the minimum Rbr/hin for the high-z galaxies to the lowest values seen locally, Rbr/h 2.6 (Kregel et al., 2002) ( 2 in the -band). In the nearby universe, the scale-lengths show a systematic increase at shorter wave-lengths but not steeply (Beckman et al., 1996). It is not clear what is the dust contribution and distribution in galaxies at high-z which prevent us at this point to predict which would be the expected Rbr/hin for the high-z galaxies. It is interesting to notice that the ratio between the inner and the outer scale-length seems to remain unchanged for the high-z sample which suggests that the dust does not make Rbr/hin appear smaller at higher redshifts.
In a recent paper, Pohlen et al. (2004) report a connection between “early” truncation and bars, where the truncation is associated with the outer Lindblad resonance (OLR). This implies that the break happens at Rbr/h , consistent with the values found here. However, there is no clear evidence for the presence of bars in the 6 galaxies of our sample. The isophotes for the bar region are characterised by a constant PA while the plot increases, reaching a maximum at the end of the bar (Wozniak et al., 1995). We do not observe this behaviour for the sample galaxies. However, dust might be obscuring the bar in the rest -band. We could then also estimate, using the relation between the OLR and the truncation and relating the position of the OLR to the galaxy morphology, whether the systems are fast or slow rotators. One should also point out that some clearly barred objects did not show sign of truncation. This fact is also observed in nearby objects (Pohlen et al., 2004) and should be further investigated.
In summary, a double exponential provides a good fit to the profiles, similar to nearby galaxies. Six of the sixteen high-z galaxies show truncation with an average Rbr/hin 1.8, while for nearby objects Rbr/hin 4, reflecting several biases; our Rbr/hin detection limit and the effect of dust. However, there are no local counterparts to the “earliest” truncated disks. The existence of these “early” truncated galaxies at high-z suggests a critical star formation density model for the origin of truncation, with disks forming inside-out. Longer wavelength observations are needed to minimise and characterise the effects of dust. A larger and deeper survey could probe disk profiles to R 4 hin (where the break radius is observed for nearby objects) to obtain proper statistics on the frequency and distribution of truncation at high-z and to probe whether the 10 remaining galaxies are untruncated or whether they show break radii similar to those of local galaxies.
Acknowledgements.
I am grateful for the useful discussions with M. Pohlen and M. Kregel and to Pohlen again for kindly making his data available. I am indebted to N. Kanekar M. Verheijen and R. Peletier for their support and the careful reading of the manuscript. I also thank the anonymous referee for constructive comments that helped to greatly improve this Letter.References
- Beckman et al. (1996) Beckman, J., Peletier, R., Knapen, J., Corradi, R., & Gentet, L. 1996, ApJ, 467, 175
- de Grijs (1998) de Grijs, R. 1998, MNRAS, 299, 595
- de Grijs et al. (2001) de Grijs, R., Kregel, M., & Wesson, H. 2001, MNRAS, 324, 1074
- de Jong (1996) de Jong, R. 1996, A&A, 313, 45
- Freeman (1970) Freeman, K. 1970, ApJ, 160, 811
- Fukugita et al. (1995) Fukugita, M., Shimasaku, K., & Ichikawa, T. 1995, PASP, 107, 945
- Giavalisco & et al. (2004) Giavalisco, M. & et al. 2004, ApJ, 600, 93
- Kennicutt (1989) Kennicutt, R. 1989, ApJ, 344, 685
- Kregel et al. (2002) Kregel, M., van der Kruit, P., & de Grijs, R. 2002, MNRAS, 334, 646
- Mao et al. (1998) Mao, S., Mo, H., & White, D. 1998, MNRAS, 297, 71
- Pohlen (2001) Pohlen, M. 2001, PhD thesis, Ruhr-University Bochum, Germany
- Pohlen et al. (2004) Pohlen, M., Beckman, J., Huettemeister, S., Knapen, J., & Erwin, P. 2004, astro-ph/0405541
- Pohlen et al. (2002) Pohlen, M., Dettmar, R., Lutticke, R., & Aronica, G. 2002, A&A, 392, 807
- van den Bosch (2001) van den Bosch, F. 2001, MNRAS, 327, 1334
- van der Kruit (1979) van der Kruit, P. 1979, A&A, 38, 15
- van der Kruit (1987) van der Kruit, P. 1987, A&A, 173, 59
- Vanzella et al. (2004) Vanzella, E., Christiani, S., Dickinson, M., et al. 2004, astro-ph/0406591, submitted to A&A
- Wirth et al. (2004) Wirth, G., Willmer, C., Amico, P., et al. 2004, astro-ph/0401353, submitted to AJ
- Wolf et al. (2004) Wolf, C., Meisenheimer, K., Kleinheinrich, M., et al. 2004, astro-ph/0403666, submitted to A&A
- Wozniak et al. (1995) Wozniak, H., Friedli, D., Martinet, L., Martin, P., & Bratschi, P. 1995, A&A, 111, 115
- Zhang & Wyse (2000) Zhang, B. & Wyse, R. 2000, MNRAS, 313, 310