HS 2331+3905: The cataclysmic variable that has it all††thanks: Based in part on observations made with the NASA/ESA Hubble Space Telescope, obtained at the Space Telescope Science Institute, which is operated by the Association of Universities for Research in Astronomy, Inc., under NASA contract NAS 5-26555, on observations made at the 1.2m telescope, located at Kryoneri Korinthias, and owned by the National Observatory of Athens, Greece, and with the Isaac Newton Telescope and William Herschel Telescope, which are operated on the island of La Palma by the Isaac Newton Group in the Spanish Observatorio del Roque de los Muchachos of the Instituto de Astrofisica de Canarias.
We report detailed follow-up observations of the cataclysmic variable HS 2331+3905, identified as an emission-line object in the Hamburg Quasar Survey. An orbital period of 81.08 min is unambiguously determined from the detection of eclipses in the light curves of HS 2331+3905. A second photometric period is consistently detected at min, longer than , which we tentatively relate to the presence of permanent superhumps. High time resolution photometry exhibits short-timescale variability on time scales of min which we interpret as non-radial white dwarf pulsations, as well as a coherent signal at 1.12 min, which is likely to be the white dwarf spin period. A large-amplitude quasi-sinusoidal radial velocity modulation of the Balmer and Helium lines with a period h is persistently detected throughout three seasons of time-resolved spectroscopy. However, this spectroscopic period, which is in no way related to the orbital period, is not strictly coherent but drifts in period and/or phase on time scales of a few days. Modeling the far-ultraviolet to infrared spectral energy distribution of HS 2331+3905, we determine a white dwarf temperature of K (assuming ), close to the ZZ Ceti instability strip of single white dwarfs. The spectral model implies a distance of pc, and a low value for the distance is supported by the large proper motion of the system, . The non-detection of molecular bands and the low , , and fluxes of HS 2331+3905 make this object a very likely candidate for a brown-dwarf donor.
Key Words.:
Stars: binaries: close – Stars: individual: HS 2331+3905 – Cataclysmic variables1 Introduction
In the current standard model of cataclysmic variable (CV) evolution (see King 1988) the systems evolve to shorter orbital periods, reach a minimum period at min and then begin to evolve back to longer orbital periods. As a CV approaches the minimum period, the mass of the donor star decreases until it can no longer sustain hydrogen burning. The low mass secondary star becomes increasingly degenerate, entering the brown dwarf regime. Kolb (1993) estimated that 70% of all CVs should have such “substellar” secondaries. Despite these large predicted numbers, only a handful of CVs are currently believed to harbour a brown dwarf donor, with WZ Sge, EG Cnc and EF Eri being among the best candidates (Littlefair et al. 2003; Patterson 1998; Beuermann et al. 2000). So far, for none of them does a compelling proof of the degenerate nature of the star exist. The discrepancy between the observed and predicted numbers of brown dwarf CVs could be due to selection effects: because of the low mass transfer rates predicted for these systems they may be substantially fainter than most CVs and may have very rare outbursts. Alternatively, it may also be that the standard theory is wrong , and that CVs have either not reached the period minimum where their donors become degenerate (King & Schenker 2002), or they may even die before reaching the period minimum (Patterson 1998).
In order to be able to test properly any of these hypotheses we need to reduce the observational biases that afflict the current CV population to a minimum. This is the main purpose of an undergoing large-scale search for CVs using the Hamburg Quasar Survey (HQS; Hagen et al. 1995; Gänsicke et al. 2000, 2002, 2004; Araujo-Betancor et al. 2003; Rodríguez-Gil et al. 2004). One of our most recent discoveries, HS 2331+3905 (HS 2331 thereafter), was selected as a CV candidate on the basis of its spectral characteristics in the HQS. Specifically, its HQS spectrum displays the strong Balmer emission lines that suggest ongoing accretion in CVs.
In this paper we present the results of follow-up spectroscopy and photometry of HS 2331 obtained over three years, which confirm the CV nature of this object and unveil a very unusual picture. In Sec. 2 we describe the photometric and spectroscopic (ground and space) observations and data reduction and calibration. The analysis of the photometry and ground-based spectroscopy is presented in Sec. 3 and 4. In Sec. 4 we also present a model for the spectral energy distribution of HS 2331, from which we derive a temperature for the white dwarf and distance to the system. Finally, in Sec. 5, we use our findings in trying to construct a preliminary picture of the nature of HS 2331.
2 Observations and Data Reduction
| Photometry | ||||
| Date | UT Time | Filter | Exp. [s] | # Frames |
| 40 cm Braeside Observatory | ||||
| 2000 Sep 25 | 04:35 - 12:29 | 50 | 510 | |
| 2000 Sep 28 | 05:26 - 10:54 | 85 | 211 | |
| 2000 Oct 03 | 02:21 - 12:01 | 95 | 338 | |
| 2001 Nov 21 | 04:13 - 08:44 | C | 85 | 152 |
| 2001 Nov 22 | 02:43 - 08:45 | C | 55 | 302 |
| 2003 Oct 12 | 02:19 - 11:44 | C | 55 | 552 |
| 2003 Oct 13 | 02:36 - 11:30 | C | 55 | 542 |
| 2003 Oct 15 | 03:56 - 11:23 | C | 55 | 446 |
| 1.2 m Kryoneri Observatory | ||||
| 2002 Oct 15 | 18:41 - 22:39 | C | 30 | 340 |
| 2002 Oct 16 | 17:29 - 22:13 | C | 25 | 429 |
| 2003 Aug 14 | 22:56 - 02:52 | C | 10 | 1029 |
| 2003 Aug 15 | 23:14 - 02:57 | C | 10 | 1012 |
| 2003 Aug 16 | 23:33 - 03:06 | C | 10 | 980 |
| 2003 Aug 17 | 23:32 - 03:04 | C | 10 | 948 |
| 2003 Aug 18 | 22:23 - 03:01 | C | 10 | 1249 |
| 2003 Aug 19 | 22:09 - 03:04 | C | 10 | 1311 |
| 2003 Aug 20 | 21:56 - 03:07 | C | 10 | 1432 |
| 4 m WHT/ULTRACAM | ||||
| 2003 Nov 10 | 19:23 - 22:00 | 1 | 10013 | |
| 2003 Nov 10 | 19:23 - 22:00 | 1 | 10013 | |
| 2003 Nov 10 | 19:23 - 22:00 | 1 | 10013 | |
| Spectroscopy | ||||
| Date | UT Time | Grating | Exp. [s] | # Spectra |
| 2.2 m Calar Alto/CAFOS | ||||
| 2000 Sep 20 | 00:50 | B-200 | 600 | 1 |
| 2000 Sep 20 | 01:05 | R-200 | 600 | 1 |
| 2000 Sep 23 | 21:20 - 02:30 | B-100 | 600 | 24 |
| 2000 Sep 24 | 00:22 - 03:37 | B-100 | 600 | 16 |
| 2000 Sep 24 | 03:47 - 04:27 | R-100 | 600 | 3 |
| 2003 Sep 11 | 22:16 - 04:20 | G-100 | 600 | 28 |
| 2003 Sep 15 | 02:28 - 04:35 | G-100 | 600 | 12 |
| 2003 Sep 16 | 23:48 - 04:04 | G-100 | 600 | 23 |
| 2.5 m Isaac Newton Telescope/IDS | ||||
| 2002 Aug 26 | 02:37 - 03:60 | R632V | 600 | 9 |
| 2002 Aug 28 | 00:33 - 01:56 | R632V | 600 | 9 |
| 2002 Sep 01 | 04:16 - 04:47 | R632V | 600 | 4 |
| 2002 Sep 02 | 03:09 - 03:41 | R632V | 600 | 4 |
| Hubble Space Telescope/STIS | ||||
| 2002 Oct 24 | 11:34 | G140L | 700 | 1 |
| 2.4 m MDM Hiltner | ||||
| 2003 Oct 12 | 07:28 - 08:15 | 600 | 420 | 7 |
| 2003 Oct 13 | 07:38 - 08:17 | 600 | 420 | 6 |
| 2003 Oct 14 | 08:03 - 08:59 | 600 | 420 | 8 |
| 2003 Oct 15 | 02:51 - 10:48 | 600 | 420 | 21 |
| 2003 Oct 16 | 03:45 - 04:40 | 600 | 420 | 8 |
2.1 Photometry
2.1.1 Braeside Observatory
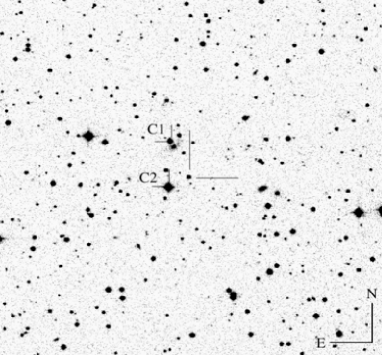
Differential -band CCD photometry of HS 2331 was obtained at the Braeside Observatory immediately following the identification of its CV nature in September-October 2000 (Sect. 2.2.1), using a 0.4 m reflector equipped with a SITe 512 CCD camera (Table 1). HS 2331 was again observed from Braeside in November 2001 and October 2003, on both occasions in white light. The data were bias-subtracted, dark current-subtracted and flat-fielded in a standard fashion, and instrumental aperture magnitudes of HS 2331 were derived relative to USNO–A2.0 1275–18486676 (, labelled ‘C1’ in Fig. 1). The mean magnitude of HS 2331 during the 2000 observations was .
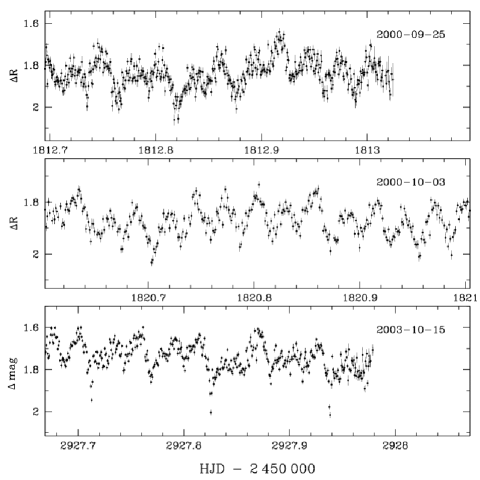
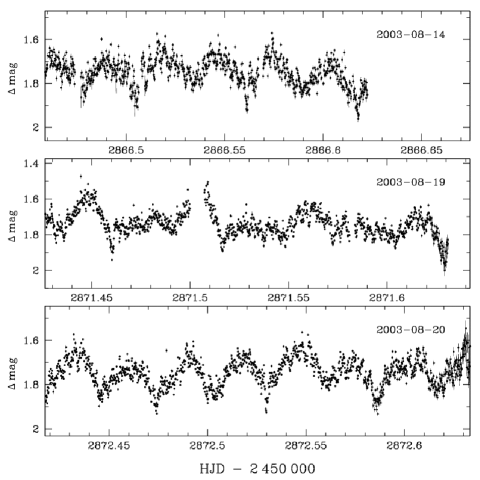
The Braeside CCD light curves of HS 2331 display periodic variability with an amplitude of mag (Fig. 3), which has consistently been detected in all three years covered by our observations. The morphology of the photometric modulation is best described by a double-humped pattern with a period of min. The relative strength of the two humps varies substantially between the individual nights. The 2003 data reveal narrow absorption dips centred on some of the observed minima between the humps.
2.1.2 Kryoneri Observatory
Filterless CCD photometry of HS 2331 was obtained during two nights in October 2002 and during 7 nights in August 2003 at the 1.2 m Kryoneri telescope using a SI-502 CCD camera (Table 1). The Kryoneri data were reduced following the procedure described in Gänsicke et al. (2004), and differential magnitudes were derived relative to C1 (Fig. 1).
The October 2002 light curves, obtained with a time resolution of 25 s – 30 s, were essentially similar to the Braeside observations (Fig. 3), displaying a double-humped structure with a period of min. The higher time resolution data obtained in August 2003 provide stronger evidence for the absorption dips detected in the Braeside observations, and clearly reveal additional short-term variability on a time scale of min (e.g. August 14; Fig. 3). In addition the changes of the shape of the double-humped structure are more pronounced than in the Braeside observations. On August 19, one of the humps is extremely weak, on August 20 both humps have nearly equal amplitude.
2.1.3 ULTRACAM on the William Herschel Telescope
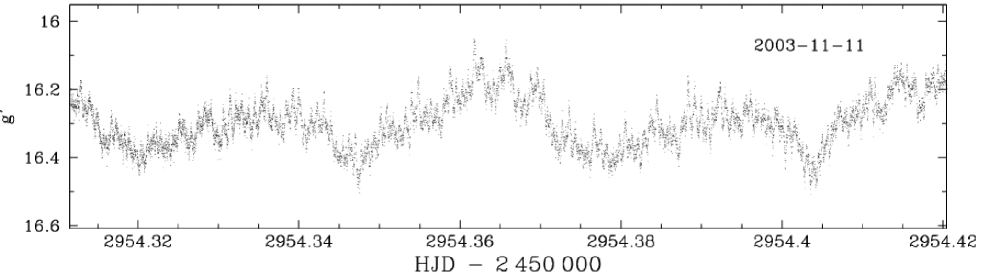
The highest time resolution and signal-to-noise ratio CCD photometry was obtained on November 10, 2003 using the 3-beam ULTRACAM CCD camera (which takes CCD data in three colour channels simultaneously, Dhillon et al. 2002) on the William Herschel Telescope. HS 2331 was observed with a 1 s time resolution, using Sloan , , and filters. The data were reduced with the ULTRACAM pipeline. Differential magnitudes of HS2331 were obtained relative to GSC 0323100595 (labelled ‘C2’ in Fig. 1), and converted to apparent magnitudes using observations of the Sloan standard SA100-280, which was observed at the end of the night. The mean magnitudes of HS2331 were , and . These values are subject to some small systematic uncertainty related to the yet uncalibrated colour terms accounting for the differences between the ULTRACAM and Sloan setups.
The ULTRACAM light curves impressively confirm the presence of variability on a time scale of min seen in the Kryoneri data, as well as additional variability on even shorter time scales (Fig. 3).
2.2 Optical Spectroscopy
2.2.1 Calar Alto
HS 2331 was identified as a CV from low-resolution spectroscopy obtained at the Calar Alto 2.2 m telescope on September 20 2000. The CAFOS focal reductor spectrograph was used in conjunction with the standard SITe CCD. A single pair of blue/red identification spectra was obtained with the B-200 and R-200 grating through a slit (see Table 1). The wavelength range of the combined spectra extends from 3500 to 10000 Å at a spectral resolution of approximately 10 Å. The online reduction of the identification spectra using the CAFOS quick look context within MIDAS immediately revealed the CV nature of HS 2331 by the presence of broad double peaked Balmer and He I emission lines in the spectra.
Time-resolved follow-up spectroscopy of HS 2331 was carried out during the same observing run, on September 23 and 24 2000. A total of 43 spectra of 600 s each were obtained during the two nights, which were mainly photometric except for very thin cirrus during the last hours of the second night (Table 1). The B-100 grism was used along with a slit to obtain 40 spectra with a useful wavelength range of 3500–6300 Å and a spectral resolution of Å. In addition, 3 red spectra were acquired during the second night, using the R-100 grism with a slit width. The red spectra cover a wavelength range of 6000 to 9200 Å at a spectral resolution of Å. Mercury-cadmium, helium-argon and rubidium arcs were taken regularly throughout both nights to provide for the wavelength calibration. Data from the flux standards G191B2B and Cas were also obtained to correct for the instrument response of the “blue” and “red” spectra respectively. The CAFOS acquisition image were taken with a Johnson filter in order to correct the spectra for slit losses.
All spectra were reduced in a standard manner using the Figaro package within the Starlink software collection. The bias level was subtracted from the calibration and object images using the median from a set of unexposed frames. Dome flat field images, taken with the same set up as the object frames, were used to remove pixel to pixel variations. The spectra were then optimally extracted (Horne 1986) and sky line subtracted. A fourth-order polynomial was fitted to obtain the dispersion relation for each of the arc spectra, giving an RMS smaller than 0.1 Å in all cases. Each target spectrum was then wavelength-calibrated by interpolating two neighboring arc spectra to account for the possible drift of the wavelength-to-pixel scale. The instrumental response function was computed as the ratio of a spline fit to the line-free continuum of the B-100/R-100 spectra of the flux standards to the flux-calibrated data from Filippenko & Greenstein (1984) and Oke (1990). All target spectra were flux-calibrated and corrected for atmospheric extinction using this response function.
We used the acquisition images obtained in conjunction with the CAFOS spectroscopy to estimate the brightness of HS 2331 during our Calar Alto observations. Aperture photometry relative to GSC 0323100595 () located south-east of HS 2331 (‘C2’ in Fig. 1) resulted in , which is consistent with the magnitude obtained from the HQS direct plate, and with the brightness level of all our photometry (Sect. 2.1). A grand average spectrum of HS 2331 was created by combining the mean of all “blue” and “red” spectra from the flux-calibrated (and corrected for atmospheric extinction) B-100/R-100 data set. This average spectrum was then scaled to , as determined from the CAFOS acquisition images to account for possible slit losses (Fig. 5). The applied correction of mag is comparable to the intrinsic variability of HS 2331, and indicates that the absolute error in our flux calibration is %.
A further set of observations were obtained in September 2003 at the 2.2 m Calar Alto telescope. This time the G-100 grism was used which together with a slit width of provided a wavelength range of 4240–8300 Å and a spectral resolution of Å (Table 1). These spectra were reduced in an analogous fashion as described above.
![[Uncaptioned image]](/html/astro-ph/0410223/assets/x5.png)
![[Uncaptioned image]](/html/astro-ph/0410223/assets/x6.png)
The spectrum of HS 2331 (Fig. 5) displays broad double-peaked Balmer and He I emission lines, suggesting an origin in the accretion disc. The higher series of the Balmer lines are flanked by extremely broad absorption troughs, which are reminiscent of the Stark-broadened absorption lines observed in the high-gravity atmospheres of cool white dwarfs (the width of the absorption lines are too wide to be of accretion disc origin). The red part of the spectrum does not contain any spectral features that could be ascribed to the emission of the secondary star.
Table 2 lists the equivalent widths (EW) and full width at half maximum (FWHM, corrected for the instrumental response), of –. The EW and the FWHM measurements were obtained by fitting a single Gaussian in all cases. Average spectra were used for the Balmer lines: Calar Alto 2000 for and Calar 2003 for –.
| Line | EW [Å] | FWHM [km/s] | FWHM[Å] |
|---|---|---|---|
| C IV | |||
| Si IV | |||
| C II | |||
| C III | |||
| N V |
2.2.2 2.5 m Isaac Newton Telescope
A total of 26 spectra of 600 s each, spread out over a week, were obtained in August-September 2002 (Table 1). We used the Intermediate Dispersion Spectrograph (IDS) on the 2.5 m Isaac Newton Telescope (INT), at the Roche de los Muchachos observatory in La Palma. The IDS was equipped with the R632V grating and the pixel EEV10 detector. Using a slit width of the setup provided an unvignetted wavelength range of and a spectral resolution of Å. Copper-Argon wavelength calibrations (arcs) were obtained at the beginning and end of each observation block of HS 2331. The reduction procedure applied to this data set is identical to the one applied to the Calar Alto/CAFOS data above.
2.2.3 2.4 m Hiltner telescope
Most recently, we observed HS 2331 from the 2.4 m Hiltner telescope at MDM observatory (Table 1). We obtained a total of 50 spectra of 420 s each in October 2003. The modular spectrograph combined with the 600 line grating and a SITe CCD detector, yielded a spectral dispersion of 2.0 Å from 4000 to 7500 Å. The reduction technique applied to this set of data is as explained in Thorstensen et al. (1998).
2.2.4 Hubble Space Telescope
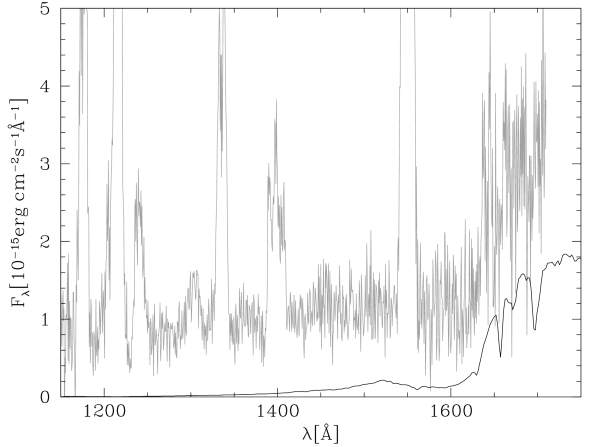
Far-ultraviolet () spectroscopy of HS 2331 was obtained with the Hubble Space Telescope/Space Telescope Imaging Spectrograph (HST/STIS) on October 24, 2002 as part of an ongoing snapshot survey of CVs. The observations were obtained using the G140L grating and the aperture, providing a spectral resolution of over the wavelength range Å. The data were pipeline-processed within IRAF using CALSTIS V2.13b. The F28x50LP magnitude of HS2331 measured from the STIS CCD acquistion image confirms that the system was at its usual brightness level during the FUV observations. The STIS spectrum (Fig. 5) contains the mixture of low and high-ionisation emission lines often observed in CVs: C III 1176, Si III 1206, N V 1239,43, C II 1335, a broad complex of Si III near 1300 Å, Si IV 1394,1403, C IV 1548,51 and probably He II 1640. The emission line flux ratios are within the normal range observed in CVs (Mauche et al. 1997; Gänsicke et al. 2003). Several of the lines contained in the STIS are double-peaked, again suggesting an origin in an accretion disc. The EW and FWHM of the strongest lines in the STIS spectrum were estimated by fitting a Gaussian to the observed line profiles, and the results are reported in Table 2. Correcting the FWHM for the separation of the C II, C IV and Si IV doublets results in line widths which are comparable to those of the Balmer lines, suggesting a common origin of the FUV and optical emission lines.
The continuum flux underlying the emission lines is slightly increasing towards the red, with a sudden upturn in flux at wavelengths Å.
3 Analysis: Photometry
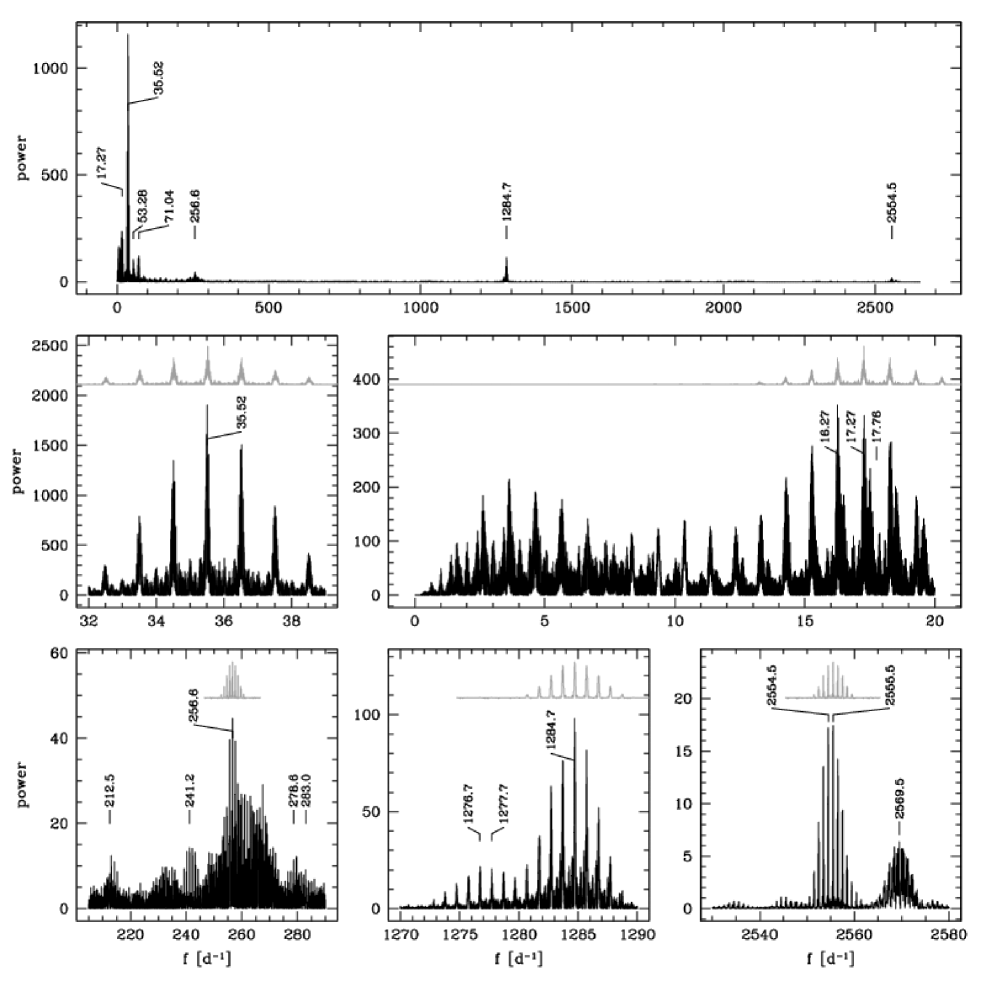
We have analysed the complex variability detected in the light curves of HS2331 (for a small sample see Fig. 3 and 3) by computing Scargle periodograms (Scargle 1982) for the entire CCD photometry of HS 2331, as well as for individual sub-sets of the data, using the MIDAS/TSA context. Prior to this period analysis, we have subtracted the nightly mean of each light curve to account for night-to-night variations in the overall brightness of the system and more importantly of the different detectors/filters used during the observations. The periodogram of HS 2331 calculated from the Kryonery 2003 data, the largest and best sampled photometric data set, (Fig. 6; top panel) contains a multitude of signals, as anticipated by our visual inspection of the light curves (Sect. 2.1).
The strongest peak is located at 35.52 (40.54 min), a weaker signal is centred on 17.27 (83.38 min), and some power is also found at 53.28 (27.03 min) and 71.04 (20.27 min). In the high-frequency range there is a strong peak at 1284.7 (1.12 min) and a weaker one at 256.6 (5.61 min).
3.1 The orbital period
Fig. 6 shows a close-up view of the Scargle periodogram of the 40 min signal (middle left panel). The strongest peak is located at min () with the one error obtained from a sine fit to the entire photometric data. The other peaks seen in the periodogram are aliases separated by multiples of 1 . The sharpness and power of the 40.54 min signal indicates a very high degree of coherence, suggesting that it is related to a stable “clock” within the binary system, such as the binary orbital period or the white dwarf spin period.
Folding the entire 4 years worth of photometry over exactly twice the 40.54 min signal, i.e. 81.08 min, results in an average light curve (Fig. 8) that unambiguously recreates the morphology observed in the individual light curves (Fig. 3 & 3): a double-humped modulation with a narrow dip. Dips of such shape are observed either in strongly magnetic CVs, when the magnetically funnelled accretion stream passes in front of the white dwarf, or as grazing eclipses of the hot spot in the accretion disc in non-magnetic CVs. Stream eclipses in magnetic CVs are relatively unstable features as the location of the stream within the binary frame changes as a function of the mass transfer rate and therefore we favour the latter scenario as the cause of the narrow dips.
The light curve of HS2331 (Fig. 3 & 8) bears a striking resemblance to that of one of the most (in)famous and thoroughly studied short period CVs: WZ Sge (see e.g. Fig. 1 of Patterson et al. 1998). Both objects exhibit double humps in their light curves, in both cases one of the humps appear to suffer from sporadic absorption events, and both systems show a sharp and relatively shallow eclipse. From the strict coherence of the 40.54 min, the detection of periodically recurrent eclipses, and the close analogy to WZ Sge, we conclude that the orbital period of HS2331 is 81.08 min, and we define the following eclipse ephemeris
| (1) |
where phase zero corresponds to the time of mid eclipse. Higher harmonics of the orbital period are clearly visible in the periodogram (Fig. 6) at 27.03 min (53.28 ) and 20.27 min (71.04 ).
![[Uncaptioned image]](/html/astro-ph/0410223/assets/x8.png)
![[Uncaptioned image]](/html/astro-ph/0410223/assets/x9.png)
3.2 Quiescent superhumps?
Only a weak signal is detected at the orbital period of 81.08 min (Fig 6 middle right). This is not too much of a surprise because of the double-humped structure of the orbital modulation, which shifts most power to half the orbital period. Surprising is, however, the detection of a relatively strong signal close to , with a period of either min () or min ( ). Both these 1-day aliases are of similar strength, and their relative power varies between different observing runs. In contrast to the orbital signal (Fig. 6 middle left), the periodogram around the 83.38 min/88.51 min signals is extremely complex, displaying significant substructure in excess to the window function, suggesting either the presence of more than one periodicity and/or a lower degree of coherence. Figure 8 shows the light curve folded over the 83.38 min signal detected in the periodogram of Fig. 6 (middle-left panel). The absence of eclipses in this folded light curve clearly rules out the 83.38 min signal (and its aliases) being the orbital period.
The separation of the 83.38 min signal and the orbital period of 81.08 min is conspicuously close to those observed for the superhump period in a large number of short period dwarf nova (e.g. Patterson 2001). In fact, the period excess found in HS2331, , is similar to that observed in LL And, which has an orbital period close to that of HS2331. Based on the observational analogies between HS2331 and a number of well-observed short-period dwarf novae, it is tempting to ascribe the observed 83.38 min signal to a permanent superhump. If this hypothesis were true, HS2331 would be unique, as it displays a permanent quiescent superhump. If 88.51 min were the true period its interpretation in terms of a permanent superhump would result in , much larger than any period excess observed in short period CVs, and we might as well have discovered a hitherto unknown phenomenon.
3.3 Higher frequencies: White dwarf pulsations & spin?
As mentioned above, the periodogram of HS2331 contains a number of distinct signals at high frequencies (Fig. 6), most pronounced at 5.61 min (256.6 ) and 1.12 min (1284.7 ). We have inspected in more detail the periodogram computed from the 2003 Kryoneri data, which provides the longest coverage at a high time resolution, as well as from the ULTRACAM observations, which has the highest time resolution but covers only h. Table 3 lists the frequencies and amplitudes of all signals that are unambiguously detected in the two data sets. The fact that most signals are detected over long periods of time rules out the CV-typical flickering to explain their origin.
The extremely complex power spectrum in the range around min is indicative of a combination of many frequencies. Such a structure is reminiscent of the patterns detected in the power spectra of ZZ Ceti stars, non-radially pulsating white dwarfs with a hydrogen-rich atmosphere. They are found in a narrow range of effective temperatures, K, and show multiperiodic variations with amplitudes reaching up to 0.3 mag and periods ranging from 100 to 1200 s (Clemens 1993). Resolving the rich frequency spectrum of ZZ Ceti stars related to the various pulsation modes, their harmonics, and various linear combinations of modes requires alias-free uninterrupted multi-longitude observing campaigns (e.g. Kepler et al. 2003). In the case of HS2331, the sampling of our 2003 Kryoneri run introduces too much of an alias structure (Fig. 6) to allow a secure identification of all the various frequencies.
Whereas our short ULTRACAM run is not very useful in identifying the frequencies present in HS2331, these data show that the power of the min variability increases towards the blue, which is what would be expected for ZZ Ceti pulsations. Untypical for ZZ Ceti pulsations are the additional large-amplitude signals detected at extremely high frequencies (Fig. 6). The shortest period observed in any ZZ Ceti star is 70.9 s in G 185–32 (Castanheira et al. 2004). Our detection of power at the first harmonic of the 1.12 min signal seems to rule out a conventional ZZ Cet pulsation as the origin of the high-frequency signals. Yet another stable clock available in a CV is the spin of the white dwarf, and we tentatively suggest that the 1.12 min and 0.56 min signals are related to the white dwarf spin period and its first harmonic, respectively. Intriguing is the doublet-like structure of the 1.12 min and 0.56 min signals (Fig. 6). Fast rotation of the white dwarf will result in extremely non-linear perturbations of the pulsation frequencies, and may be responsible for this structure. Alternatively, the doublet-structure may reflect a sideband frequency, as typically observed in intermediate polars. The choice of the lower frequency alias in the doublets is somewhat ambiguous: assuming that 1277.7 and 2555.5 are the true frequencies of the doublet and its first harmonic, the implied beat frequency is 7 , which is nearly identical to the spectroscopic period found from the radial velocity variations of the Balmer emission line wings (Sect. 4).
| Kryoneri | WHT | ||||
|---|---|---|---|---|---|
| clear | |||||
| [mmag] | [mmag] | [mmag] | [mmag] | ||
| 205.7 | 3.6 | 206 | 9.6 | 6.7 | 7.4 |
| 212.5 | 4.5 | 216 | 15.0 | 10.1 | 11.2 |
| 213.2 | 4.8 | ||||
| 226 | 14.2 | 11.9 | 12.1 | ||
| 241.2 | 6.4 | ||||
| 256.6 | 10.0 | 266 | 36.3 | 20.2 | 22.1 |
| 278.6 | 4.9 | ||||
| 283.0 | 3.6 | 288 | 11.7 | 7.7 | 8.6 |
| 474 | 6.6 | 5.3 | 4.8 | ||
| 535 | 7.2 | 6.6 | 6.5 | ||
| 1029.1 | 2.6 | 1021 | 8.5 | 6.8 | 6.9 |
| 1276.7 | 7.0 | ||||
| 1284.7 | 15.8 | 1283 | 35.1 | 20.7 | 20.6 |
| 2554.5(†) | 6.2 | 2554 | 7.6 | 9.4 | 6.2 |
| 2569.5 | 3.7 | 2570 | 11.0 | 4.4 | 6.2 |
(†) The 1-day aliases at 2555.5 has nearly equal power.
4 Analysis: Spectroscopy
4.1 Radial velocities
Radial velocities were measured using the convolution technique first outlined by Schneider & Young (1980) and developed by Shafter (1983).
The emission line profile is convolved with two Gaussians of equal FWHM (of the order of the wavelength resolution) but with opposite signs. The peaks of the Gaussians are separated by a distance chosen in order to measure as far out as possible into the wings, while still retaining an adequate signal-to-noise level. By doing this we ensure that the measured radial velocities trace the inner part of the accretion disc, where one may hope to find an azimuthally symmetric structure that traces the orbital motion of the white dwarf. Prior to the actual radial velocity measurement the spectra were transformed into the heliocentric rest frame.
4.1.1 The end of a myth…
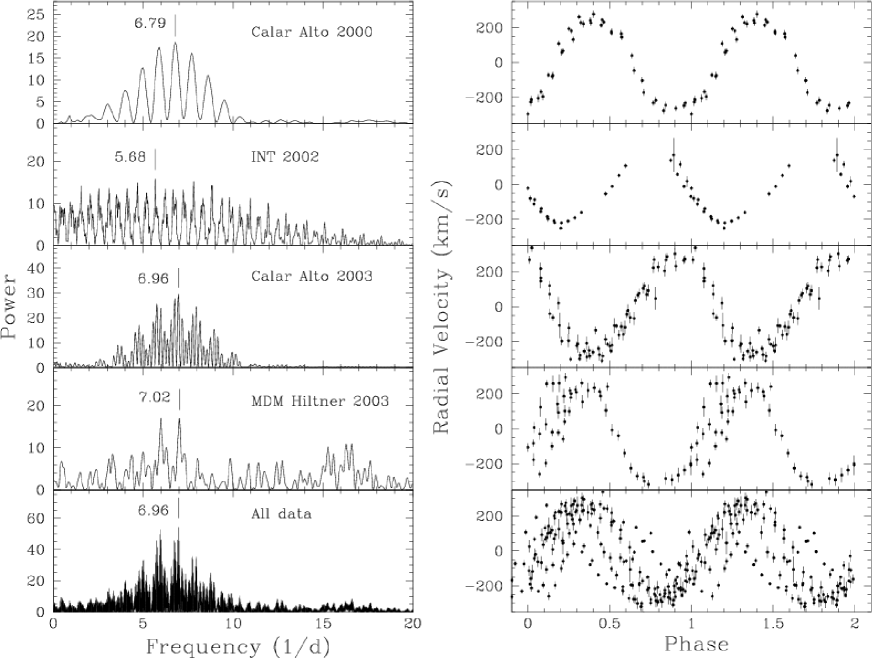
Radial velocity variations were measured for each individual observing run (Table 1) using the strongest Balmer lines as well as He I and He I . In all cases the Gaussians separation was set to values between 2600 and 3000 . The radial velocity measurements were then subjected to the Scargle period analysis in the MIDAS/TSA context. The results for each individual run did not depend on the emission line used for the analysis, and we will discuss in the following the radial velocity variations measured in (Calar Alto 2000; we opted against because of the potential contamination from the nearby He lines) and for all the other runs.
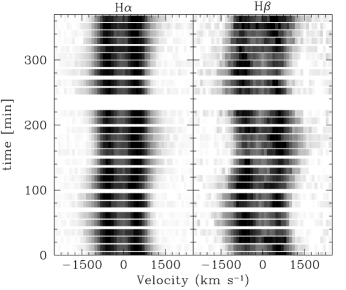
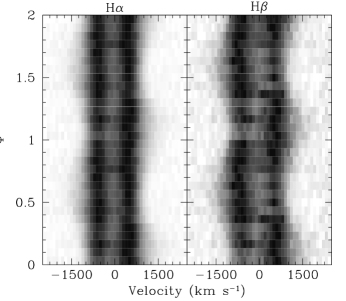
Figure 9 shows the periodograms and the corresponding radial velocity curves folded over the highest peaks detected in each of the data sets. The bottom panel shows the periodogram and folded radial velocity curve obtained when combining all data. The Calar Alto 2000 data show a smooth sinusoidal radial velocity variation with an amplitude of and a period of 3.53 h, which is not anywhere close to the orbital period determined from the eclipses! This makes HS2331, to our knowledge, the first CV in which the dominant radial velocity variation is not modulated on the orbital period. With HS 2331, there are now four CVs in which the photometric modulation and the spectroscopic modulation are significantly different; the other three being FS Aur, GW Lib and Aqr1 (see Table 2 of Woudt et al. 2004). The origin of the second period in these systems is much of a mystery as the h periodicity in HS 2331, but contrary to HS 2331, in FS Aur, GW Lib and Aqr1 the spectroscopic variation is believed to be orbital. Fig. 10 shows the trailed spectra of and obtained from the observing night with the largest data set (i.e. Calar Alto 2003, Sep 11; Table 1) in minutes and phase folded with the orbital period respectively. The 3.45 h period is clearly seen in the wings of the Balmer emission lines.
The analysis of the other runs reveals that the radial velocity variation changes on time scales of several days. The structure of the periodograms becomes increasingly complicated with the length of the run, and folding the radial velocity measurements over the strongest peak (or any other peak) will not provide a smooth radial velocity variation (Fig. 9). The strongest signals in the periodograms are found at 4.22 h (INT 2002), 3.45 h (Calar Alto 2003), 3.42 h (MDM Hiltner 2003) and 3.45 h (all data). All runs, with the exception of the INT data, give very close period values which appear consistent with each other. Close inspection of the bottom panel of Fig. 9 shows that, when folded over the h signal, (the highest peak detected in the periodogram calculated from combining all the spectroscopic data together) a shift between the individual nights appears (Calar Alto 2000/2003 and MDM 2003 data). In the case of the INT observing run, the poor sampling of the data (Table 1) may prevent us from detecting the true underlying periodicity at this epoch and the relatively smooth appearance of the radial velocity curve folded over 4.22 h (the highest peak in the periodogram) may be coincidental. Statistically, there is no strong preference for any of the aliases found in the range .
We conclude that a persistent large-amplitude radial velocity variation with a period of 3.5 h is present in HS 2331, however, this variation is not coherent and its period and/or phase drifts on time scales of days.
4.1.2 …sanity refound
The fact that the dominant radial velocity variation in HS2331 does not occur on the orbital period is most surprising, and alarming, as radial velocity variations measured from the emission lines are routinely used not only to determine the orbital periods of CVs, but also to estimate the radial velocity of the white dwarf. In order to probe for lower amplitude radial velocity variations, we have detrended the Calar Alto 2000 and 2003 radial velocity measurements with a sine wave adopting the frequency of the strongest peak in the corresponding periodogram, 3.53 h and 3.45 h, respectively. The Scargle periodograms of the detrended data (Fig. 11; left panel) contain significant power at frequencies which are consistent with the orbital period derived from the photometry (Sect. 3): min (Calar Alto 2000), min (Calar Alto 2003), and min (combining both sets). Whereas the signal of the orbital period completely dominates the periodogram of the 2000 data, significant residual power is left near 3.45 h in the case of the 2003 data. The main difference between the two data sets is the extent of the observations. While the 2000 data were obtained during two consecutive nights, the 2003 data was obtained during three nights spanning a total of six nights. As the dominant radial velocity variation drifts on times scales of a few days, detrending with a sine with a fixed period will become increasingly imperfect with increasing length of the observing run. Hence, the residual low-frequency power in the case of the 2003 data reflects the imperfection of the applied detrending.
Folding the detrended radial velocities over the orbital period (i.e. 81.08 min) results in a sinusoidal radial velocity curve (Fig. 11; right panel), which is smoother for the 2000 data than for the 2003 data, probably again a result of the cleaner detrending possible for these observations. The consistent detection of the 81.08 min period both, in the photometry and in the spectral radial velocity variations lends further support for our conclusion that this is indeed the orbital period of HS 2331.
A sine fit to the folded detrended radial velocities of the Calar Alto 2000 data (top right panel of Fig. 11) results in an amplitude of , a systemic velocity of , and a phase offset with respect to mid eclipse of . The amplitude, interpreted as radial velocity of the white dwarf as it is commonly done, is entirely consistent with what is observed in short-period CVs (e.g. Thorstensen & Fenton 2003). The phase offset with respect to the expected motion of the white dwarf is most likely related to the fact that the eclipse is caused by an obscuration of the hot spot in the accretion disc, and not of the white dwarf itself. In addition, even in “well-behaved” CVs the broad wings of the emission lines do not necessarily exactly trace orbit of the white dwarf, most likely because of slight asymmetries in the disc.

4.2 A model for the spectral energy distribution
We have combined our optical data with the 2MASS , , and magnitudes of HS2331 (Fig. 12), and modeled the optical/IR spectral energy distribution (SED) with a three-component model comprising: (1) a synthetic white dwarf spectrum to account for the observed broad Balmer absorption lines. A grid of model spectra covering K was calculated with TLUSTY and SYNSPEC (Hubeny 1988; Hubeny & Lanz 1995). We fixed the surface gravity to , corresponding to , and the photospheric abundances to 0.1 of their solar values. (2) The emission of an isothermal and isobaric slab with a finite depth to account for the observed Balmer emission lines and any associated continuum. This model is described in detail in Gänsicke et al. (1997) and Gänsicke et al. (1999). In brief, the free parameters for the generation of this component were the temperature of slab and the column density of the slab along the line of sight. The temperature accounts for the ionisation/excitation of the lines and the optically thick blackbody envelope, and the column density determines the ratio in optical depth between continuum and lines, i.e. the equivalent width of the lines. (3) A late-type spectral template to account for the emission of the secondary star in HS2331. The library of templates covered spectral types M0.5 to M9 from Beuermann et al. (1998) and L0 to L8 from Kirkpatrick et al. (1999) and Kirkpatrick et al. (2000). The L-dwarf type stars were normalized to surface fluxes using the radii and distances given by Dahn et al. (2002), the M-dwarf templates provided by Beuermann were already normalized in this way.
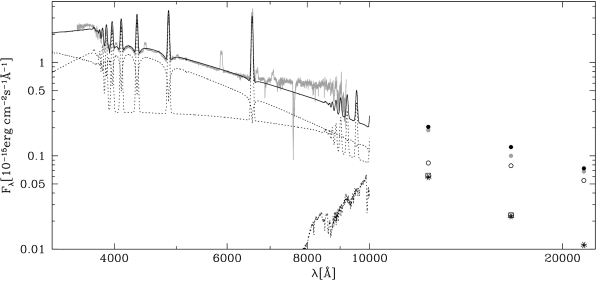
We started by approximately modeling the observed broad Balmer absorption lines with a white dwarf model, which suggested K and a white dwarf flux contribution of % at 5000 Å (Fig. 12). The next step was to extrapolate the white dwarf model established in this way into the FUV wavelength range covered by STIS (Fig. 13). Interpreting the sudden flux up-turn at wavelengths Å as photospheric emission from the white dwarf we refine the white dwarf temperature to K. The red end of the STIS range is very sensitive to the white dwarf temperature because of the strong temperature dependence of the quasimolecular absorption at 1600 Å. The flux scaling factor of our white dwarf model implies a distance of pc. The systematic error in this distance estimate depends primarily on the assumed white dwarf mass, assuming a mass in the range results in pc. A low distance to HS2331 is supported by the large proper motion of the star, , which has been derived from the comparison of the DSS1 and DSS2 images of the system. An isothermal/isobaric slab with a temperature of K and a surface density of accounts well for the observed Balmer emission and the Balmer jump, and contributes % of the flux at 5000 Å. Assuming pc the area of this simple “disc” component is comparable to the size of the white dwarf Roche lobe. The red end of our optical spectrum shows no evidence for the TiO absorption bands that are observed in CVs where the late-type donor star significantly contributes to the red/near-IR spectrum. In the last step of our SED modeling we add the spectral contribution of the secondary, assuming cm (corresponding to min and ; see Sect. 5.1). The flux limit imposed by the 2MASS , , and measurements constrain the spectral type of the secondary to be L2 or later (Fig. 12).
Whereas our three-component model of the FUV-to-IR SED of HS2331 is overall rather satisfying, two regions of excess flux are observed: the FUV continuum below Å significantly exceeds the predicted white dwarf flux (the simple “disc” model and the secondary contribute no flux in the FUV), and the optical continuum in the range Å exceeds the flux of the sum of all three components. We believe that the most likely explanation for this excess flux is that our model for the disc emission is too naive – we just assume a single temperature/density pure hydrogen slab. The FUV emission lines clearly indicate that the disc contains hotter regions, which will contribute to some extent to the FUV continuum. The excess flux observed at the red end of our optical spectrum may be related to the Paschen continuum of a somewhat colder part of the disc. It is likely that a multi-temperature/density model of the quiescent disc could account for the observed excess flux, however, we feel that the number of additional free parameters does not warrant this exercise.
5 Discussion
Before discussing the nature of the system, we briefly summarise the results of our analysis.
-
1.
HS2331 has been identified as a CV because of its emission lines detected in the HQS.
-
2.
Coherent low-amplitude eclipses detected over four years unequivocally determine the orbital period to be min. The mean light curve of HS2331 bears extreme similarity to that of WZ Sge.
-
3.
The optical and FUV spectrum of HS2331 is dominated by the photospheric emission of a white dwarf with K.
-
4.
The power spectrum of our optical photometry contains a number of significant signals in the range min, which we interpret as non-radial ZZ Ceti pulsations.
-
5.
Additional signals are found at periods of 1.12 min and 0.56 min, which we tentatively identify as the spin period of the white dwarf and its first harmonic.
-
6.
The distance of the system is pc, derived from modelling the emission of the white dwarf. This low distance is consistent with the high proper motion of the system, .
-
7.
Combining our optical spectroscopy of HS2331 with the 2MASS , , and magnitudes of the system, and adopting pc and a mass ratio of (see below, Sect. 5.1), we find that the donor star must be of extreme late spectral type, L2 or later.
-
8.
Our extensive optical photometry consistently contains a strong signal at a period somewhat longer than . Selecting the alias of that pattern which is closest to gives 83.38 min, which is 2.8 % longer than the orbital period.
-
9.
Our spectroscopic data set reveals consistently the presence of large-amplitude radial velocity variation with a period of h. However, this radial velocity modulation is not strictly coherent, but appears to drift in either period or phase on a time scale of days.
-
10.
After detrending the radial velocity measurements with a 3.5 h sinusoid, a radial velocity variation with a period of , i.e. , is detected with an amplitude of .
5.1 The evolutionary state of HS 2331+3905
A number of arguments suggest that HS2331 is a CV in a late stage of its evolution. Its orbital period is close to the observed period minimum of CVs. A very low mass transfer rate is indicated by the low temperature of the white dwarf, which is a measure of the secular mean accretion rate (Townsley & Bildsten 2003). This is consistent with the absence of observed outbursts. All our detailed photometric and spectroscopic campaigns carried out since September 2000 have found HS2331 near . The CCD-equipped 0.37 m Rigel Telescope of the University of Iowa has been used to monitor HS2331 on 16 nights in October to December 2003 and on 15 nights in May/June 2004, finding the system at an instrumental magnitude of . Additional visual monitoring of HS2331 has been carried out during nights since March 2003 using a 8” Schmidt-Cassegrain telescope, with no gaps in the coverage being longer than one week. On no occasion has the star been detected, with a limiting magnitude of . In many aspects, HS2331 resembles the well-studied short-period dwarf nova WZ Sge, which shows extremely bright superoutbursts every 2–3 decades. If this analogy were correct, we would predict an outburst magnitude for HS2331 of .
Yet another indication of HS2331 being an old evolved CV is the very late spectral type of the secondary star. Assuming a white dwarf mass of 0.6 and a secondary mass of (as it may be realistic for near the minimum period), i.e. , and a distance of 90 pc, our model for the SED of HS2331 suggests a spectral type later than L2 (Sect. 4.2), which makes this system one of the best candidates for a brown dwarf donor. Detailed infrared spectroscopy will be required to test this hypothesis.
Using the same stellar mass assumption and an inclination of , based on the detection of grazing eclipses in the optical light curve, the radial velocity variation of the white dwarf is expected to be , which is consistent with the amplitude of the 81.08 min radial velocity variation detected in the spectroscopy, after detrending the data for the dominant 3.5 h modulation (Sect. 4.1.2).
5.2 A permanent superhumper?
From our four years of photometric data, HS 2331 appears to be a permanent superhumper with a likely superhump period of min, i.e. a period excess . This finding is exceptional, as superhumps are normally detected during superoutbursts of SU UMa type dwarf novae or in some nova-like variables during their high states, i.e. always during phases of high mass transfer in the accretion disc. Superhumps are thought to be related to the precession of tidally unstable eccentric accretion discs in close binaries with extreme mass ratios (e.g. Osaki 1985; Murray 1998).
If our interpretation of the photometric signal is correct, and indeed min, the implied period excess of 2.8% is not particularly small (Patterson 2001), somewhat arguing against an extreme mass ratio in HS2331. However, considering the unique nature of HS2331, it is not clear if Patterson’s relation can be directly adopted for this system.
The strangest and most disconcerting observational fact about HS2331 is without doubt the detection of a dominant radial velocity variability with a period of 3.5 h, which does not correspond to the orbital motion of the system. This periodicity resulted from measuring changes in the wings of the Balmer emission lines and therefore reflects variability in the inner disc region of the systems, however we have at present no explanation for the physical origin/significance of its 3.5 h period. Again, in a very speculative approach, we suggest that the period (or phase) drift of this radial velocity variation may be related to the presence of permanent superhumps. The precession period of the accretion disc implied by the orbital period and the superhump period is d, which is comparable to the time scale on which the 3.5 h radial velocity variation varies. An intensive spectroscopic campaign covering several of the putative precession cycles could test this hypothesis.
Another important conclusion from the radial velocity analysis is that care should be taken when implicitely assuming that the dominant radial velocity variation detected in cataclysmic variables (and related objects) reflects the orbital period. Whereas this is contrary to the customary approach for the past decades, the results obtained for HS 2331 are a clear warning that this custom could occasionally lead to wrong interpretations.
5.3 The brightest CV white dwarf pulsator
Until recently, only a single CV containing a white dwarf pulsator has been discovered: GW Lib (van Zyl et al. 2000, 2004). GW Lib is only partially understood, due to the lack of a proper mode identification of the observed pulsation frequencies, and more severely, due to the circumstance that the temperature of its white dwarf, K, is actually significantly above the blue end of the ZZ Ceti instability strip (Szkody et al. 2002). Three additional CVs containing pulsating accreting white dwarfs have been discovered in the SDSS: SDSS J013132.39–090122.3, SDSS J161033.64–010223.3, and SDSS J220553.98+115553.7 (Warner & Woudt 2003; Woudt & Warner 2004).
We have shown that HS2331 exhibits the photometric behaviour typical of ZZ Ceti pulsators, showing a multiperiodic and complex power spectrum in the range s to s. With , HS2331 is by far the brightest CV white dwarf pulsator, making it the prime target for detailed follow-up studies. The white dwarf temperature implied by the SED of HS2331 ( K, assuming , Sect. 4.2) is just slightly below the red end of the ZZ Ceti instability strip for single white dwarfs (e.g. Bergeron et al. 2004). The ultra-short periods detected in HS2331, with periods of 1.12 min and 0.56 min which are too small for conventional -mode pulsations, remains a puzzle. One possible solution is to assume that 1.12 min is the white dwarf spin period, and 0.56 min its first harmonic. Polarimetry and X-ray detection of the 1.12 min period would be the ultimately proof of this hypothesis.
A more detailed understanding of the white dwarf pulsations in CVs is just at its beginning, as the first models for the driving mechanism are being developed (Townsley et al. 2004), and a larger sample of these objects is discovered. Future potential asteroseismological applications in CV white dwarfs include measuring the white dwarf masses, as well as studying the accreted envelope.
6 Conclusion
We have discovered a new short orbital period CV, HS 2331, which displays an overwhelming wealth of observable phenomena, and we encourage detailed follow-up studies over all wavelength ranges and time scales to exploit the opportunities that this system offers for an improved understanding of CV evolution and accretion onto white dwarfs.
Acknowledgements.
We thank the referee, Patrick Woudt, for a prompt and helpful report. SAB acknowledges support from NASA through grants GO-9357 and GO-9724 from the Space Telescope Science Institute, which is operated by AURA, Inc., under NASA contract NAS5-26555. BTG was supported by a PPARC Advanced Fellowship, The HQS was supported by the Deutsche Forschungsgemeinschaft through grants Re 353/11 and Re 353/22. We are very grateful to Klaus Beuermann and Davy Kirkpatrick for giving us access to their spectral templates for M- and L-dwarfs. We would also like to thank Pablo Rodriguez-Gil, Matthias Schreiber, Klaus Beuermann, Luisa Morales, Dean Townsley, Lars Bildsten and Phil Arras for helpful discussions and to Spiridon Kitsionas for a careful reading of the manuscript. P. Schmeer is very grateful to Robert Mutel and his students for scheduling some of the CCD monitoring of HS 2331. We thank the director of the Calar Alto observatory for the generous allocation of discretionary time for this project.References
- Araujo-Betancor et al. (2003) Araujo-Betancor, S., Gänsicke, B. T., Hagen, H.-J., Rodriguez-Gil, P., & Engels, D. 2003, A&A, 406, 213
- Bergeron et al. (2004) Bergeron, P., Fontaine, G., Billères, M., Boudreault, S., & Green, E. M. 2004, ApJ, 600, 404
- Beuermann et al. (1998) Beuermann, K., Baraffe, I., Kolb, U., & Weichhold, M. 1998, A&A, 339, 518
- Beuermann et al. (2000) Beuermann, K., Wheatley, P., Ramsay, G., Euchner, F., & Gänsicke, B. T. 2000, A&A, 354, L49
- Castanheira et al. (2004) Castanheira, B. G., Kepler, S. O., Moskalik, P., et al. 2004, A&A, 413, 623
- Clemens (1993) Clemens, J. C. 1993, Baltic Astronomy, 2, 407
- Dahn et al. (2002) Dahn, C. C., Harris, H. C., Vrba, F. J., et al. 2002, AJ, 124, 1170
- Dhillon et al. (2002) Dhillon, V., Marsh, T. R., Kelly, J., et al. 2002, in The Physics of Cataclysmic Variables and Related Objects, ed. B. T. Gänsicke, K. Beuermann, & K. Reinsch (ASP Conf. Ser. 261), 672
- Filippenko & Greenstein (1984) Filippenko, A. & Greenstein, J. L. 1984, PASP, 96, 530
- Gänsicke et al. (2004) Gänsicke, B. T., Araujo-Betancor, S., Hagen, H.-J., et al. 2004, A&A, 418, 265
- Gänsicke et al. (2003) Gänsicke, B. T., Szkody, P., de Martino, D., et al. 2003, ApJ, 594, 443
- Gänsicke et al. (2000) Gänsicke, B. T., Beuermann, K., de Martino, D., & Thomas, H.-C. 2000, A&A, 354, 605
- Gänsicke et al. (1997) Gänsicke, B. T., Beuermann, K., & Thomas, H. C. 1997, MNRAS, 289, 388
- Gänsicke et al. (2002) Gänsicke, B. T., Hagen, H. J., & Engels, D. 2002, in The Physics of Cataclysmic Variables and Related Objects, ed. B. T. Gänsicke, K. Beuermann, & K. Reinsch (ASP Conf. Ser. 261), 190–199
- Gänsicke et al. (1999) Gänsicke, B. T., Sion, E. M., Beuermann, K., et al. 1999, A&A, 347, 178
- Hagen et al. (1995) Hagen, H. J., Groote, D., Engels, D., & Reimers, D. 1995, A&AS, 111, 195
- Horne (1986) Horne, K. 1986, PASP, 98, 609
- Hubeny (1988) Hubeny, I. 1988, Comput.,Phys.,Comm., 52, 103
- Hubeny & Lanz (1995) Hubeny, I. & Lanz, T. 1995, ApJ, 439, 875
- Kepler et al. (2003) Kepler, S. O., Nather, R. E., Winget, D. E., et al. 2003, A&A, 401, 639
- King (1988) King, A. R. 1988, QJRAS, 29, 1
- King & Schenker (2002) King, A. R. & Schenker, K. 2002, in The Physics of Cataclysmic Variables and Related Objects, ed. B. T. Gänsicke, K. Beuermann, & K. Reinsch (ASP Conf. Ser. 261), 233–241
- Kirkpatrick et al. (1999) Kirkpatrick, J. D., Reid, I. N., Liebert, J., et al. 1999, ApJ, 519, 802
- Kirkpatrick et al. (2000) —. 2000, AJ, 120, 447
- Kolb (1993) Kolb, U. 1993, A&A, 271, 149
- Littlefair et al. (2003) Littlefair, S. P., Dhillon, V. S., & Martín, E. L. 2003, MNRAS, 340, 264
- Mauche et al. (1997) Mauche, C. W., Lee, Y. P., & Kallman, T. R. 1997, ApJ, 477, 832
- Murray (1998) Murray, J. R. 1998, MNRAS, 297, 323
- Oke (1990) Oke, J. B. 1990, AJ, 99, 1621
- Osaki (1985) Osaki, Y. 1985, A&A, 144, 369
- Patterson (1998) Patterson, J. 1998, PASP, 110, 1132
- Patterson (2001) —. 2001, PASP, 113, 736
- Patterson et al. (1998) Patterson, J., Richman, H., Kemp, J., & Mukai, K. 1998, PASP, 110, 403
- Rodríguez-Gil et al. (2004) Rodríguez-Gil, P., Gänsicke, B. T., Araujo-Betancor, S., & Casares, J. 2004, MNRAS, 349, 367
- Scargle (1982) Scargle, J. D. 1982, ApJ, 263, 835
- Schneider & Young (1980) Schneider, D. P. & Young, P. 1980, ApJ, 238, 946
- Shafter (1983) Shafter, A. W. 1983, ApJ, 267, 222
- Szkody et al. (2002) Szkody, P., Gänsicke, B. T., Howell, S. B., & Sion, E. M. 2002, ApJ Lett., 575, L79
- Thorstensen & Fenton (2003) Thorstensen, J. R. & Fenton, W. H. 2003, PASP, 115, 37
- Thorstensen et al. (1998) Thorstensen, J. R., Taylor, C. J., & Kemp, J. 1998, PASP, 110, 1405
- Townsley et al. (2004) Townsley, D. M., Arras, P., & Bildsten, L. 2004, ApJ Lett., 608, L105
- Townsley & Bildsten (2003) Townsley, D. M. & Bildsten, L. 2003, ApJ Lett., 596, L227
- van Zyl et al. (2004) van Zyl, L., Warner, B., O’Donoghue, D., et al. 2004, MNRAS, 350, 307
- van Zyl et al. (2000) —. 2000, Baltic Astronomy, 9, 231
- Warner & Woudt (2003) Warner, B. & Woudt, P. 2003, in Variable Stars in the Local Group, ed. D. Kurtz & K. Pollar, in press (astro-ph/0310072)
- Woudt & Warner (2004) Woudt, P. A. & Warner, B. 2004, MNRAS, 348, 599
- Woudt et al. (2004) Woudt, P. A., Warner, B., & Pretorius, M. L. 2004, MNRAS, 351, 1015