G287.84–0.82: An Infrared Star Cluster in the Carina Nebula
Abstract
We have studied the properties of an infrared cluster embedded in the gas and dust of the southern part of the Carina Nebula (NGC 3372), where the probable existence of current star formation has already been predicted. We used mid-infrared (A & C bands) and near-infrared (J H Ks) images from the MSX and the 2MASS surveys respectively, combined with an optical Hα narrow-band filter image obtained at the CTIO. The infrared star cluster has at least 17 members, and its parameters, radius and stellar density are in very good agreement with high- to intermediate-mass star formation scenarios. The detected IR sources have roughly the same intrinsic infrared excess determined from their position in colour-colour and colour-magnitude diagrams, suggesting that these objects could be related to pre-main sequence stars of high to intermediate mass. Furthermore, we present a low-dispersion spectrum of LS 1883 (O9.5 V) star located near the centre of the IR cluster. The position of this object in the colour-colour and colour-magnitude IR diagrams lies close to the reddening vector of an ZAMS O9 V spectral type star, and it seems to be the first star of this cluster to emerge. All these facts are consistent with the current star-forming scenarios associated with highly embedded star clusters.
keywords:
stars: formation - stars: pre-main-sequence open clusters and associations: individual: Carina Nebula - open clusters and associations: individual: G287.84–0.82 - open clusters and associations: individual: NGC 3372 - infrared: stars -1 Introduction
The Carina Nebula (NGC 3372) is one of the most interesting massive star-forming regions in the Galaxy which can be observed from the Southern hemisphere, containing a large population of hot stars (Walborn, 1971, 1973). This extraordinary region is available to observations using medium-sized telescopes and it hosts several well-known young open clusters, such as Trumpler 14, 15 and 16, Collinder 228 and 232, and Bochum 10 and 11, (Massey & Johnson, 1993; Walborn, 1995).
NGC 3372 is an evolved Hii region, with dust and neutral gas evacuated from its core by the action of strong winds from its hot massive stars. However, embedded star-forming cores suggest that star formation has not ceased (Smith et al., 2000). These cores allow us to study the very initial phases of star formation which, in general, are deeply embedded in dust and/or are located in heavily reddened lines of sight. The near-infrared (near-IR) and mid-IR domains are therefore necessary to study them (Lada & Lada, 1991). Recently, Rathborne et al. (2002) discovered several groups of diffuse IR sources and studied the interaction between the young stars and the molecular material that surrounds them. Rathborne et al. (2004) found 12 candidate embedded clusters using mid-IR Midcourse Space Experiment (MSX) data; some of these sources are also proposed as candidates by Smith et al. (2000).
Among all these candidates, G287.84–0.82 is a bright nebulosity near LS 1883 (CPD-59∘ 2661; =10h 45m 53.6s, =-59∘ 57′ 02.2″), which seems to be a prime candidate of current star formation. Dutra & Bica (2001) and Dutra et al. (2003) searched for candidates to star clusters and groups between 10∘ and 230∘ l 350∘ using the Two-Micron All-Sky Survey (2MASS)111http://www.ipac.caltec.edu/2mass/. They have suggested that this region could be a partially resolved cluster in a reflection nebula in agreement with the previous classification vdBH-RN43 (van den Bergh & Herbst, 1975). They have also given an estimate for the angular diameter of D=1.5 arcmin at a distance of 2.5 kpc (equivalent to a linear diameter of 1.1 pc), and a possible multiplicity of about 10 members. Magakian (2003), who merged several catalogues of reflection nebula in order to create a uniform catalogue containing 913 objects, also classified it as an object of this type.
The aim of this paper is to determine the properties of this deeply embedded IR star cluster, by using mid-IR 8 - 21 m images obtained with the MSX and the 2MASS IR atlas (Skrutskie et al., 1997) in the J, H and Ks image bands. Also, we have included new spectroscopic data of LS 1883 and SS73 24, two bright stars which appear projected towards the nebulosity, in order to determine the actual association of these sources with the embedded cluster.
2 Observations and data reduction
The Carina Nebula was observed in 1996 in the mid-IR by the MSX satellite. The characteristics of its instruments are given by Egan et al. (1998). We retrieved MSX A-band (8.28 m), C-band (12.13 m), D-band (14.65 m) and E-band (21.3 m) images from the IPAC database222http://irsa.ipac.caltech.edu/msx.html.
We also obtained narrow-band [Oiii] 5007 Å, H and [Sii] 6730 Å emission-line images of a large field in Carina, centered at Car, observed in 1999 May using a SITe 20482048 CCD (24 m pixels) mounted on the Curtis-Schmidt telescope at Cerro Tololo Inter-American Observatory (CTIO) with a scale of 2.32 arsec pixel-1.
The near-IR data retrieved from the 2MASS consist of a set of J (1.25 m), H (1.65 m) and Ks (2.17 m) images centred on =10h 45m 53.6s, =-59∘ 57′ 02 arcsec, each about 300 arcsec wide. These images have a spatial resolution of about 2 arcsec. We also retrieved photometric measurements of the same area from the 2MASS All-Sky Point Source Catalog (Cutri, et al., 2000) using the GATOR interface at the IPAC web site. However, we have limited our analysis to those sources whose errors are measurable (see table 1) and whose quality parameters guarantee that the reliability of the photometry is at least within the 95 per cent confidence level (see the “User’s Guide to the 2MASS All-Sky Data Release”, also available from the IPAC site, for an explanation of the different types of 2MASS photometric errors). These selection criteria removed roughly one-third of the 2MASS point sources available in the region. The completeness limits for our data set are about 15.5, 15.0 and 14.0 mag for J, H and Ks bands, respectively. We have only kept stars that are flagged for not having crowding effects when determining their background, as this effect only slightly degrades the quality of the photometry, but does not introduce systematic effects on the magnitude determination. Note that source 4 has only been considered in order to determine the density, and it has not been used to estimate the global properties of the IR cluster (see discussion in Section 3).
Low resolution spectra of LS 1883 and SS73 24 were obtained at Complejo Astronómico El Leoncito (CASLEO)333Casleo is operated under agreement between CONICET and the National Universities of La Plata, Córdoba and San Juan on 2001 June 30 with the REOSC 444Spectrograph Echelle Liège (jointly built by REOSC and Liège Observatory, and on long term loan from the latter) spectrograph attached to the Jorge Sahade 2.15-m telescope. We used the single dispersion mode which yields a spectral resolution of Å pixel-1. The background subtraction in both spectra was performed in a very narrow window close to the star to minimize the nebular contribution in H and Hei stellar line absorptions. Moreover, in the case of LS 1883, it was almost impossible to neatly subtract the nebular emission due to the clumpy aspect of the nebula around the star.
The optical images were processed and analysed with IRAF555Image Reduction and Analysis Facility, distributed by NOAO, operated by AURA, Inc., under agreement with NSF. routines in the usual manner.
3 Analysis
3.1 Imaging
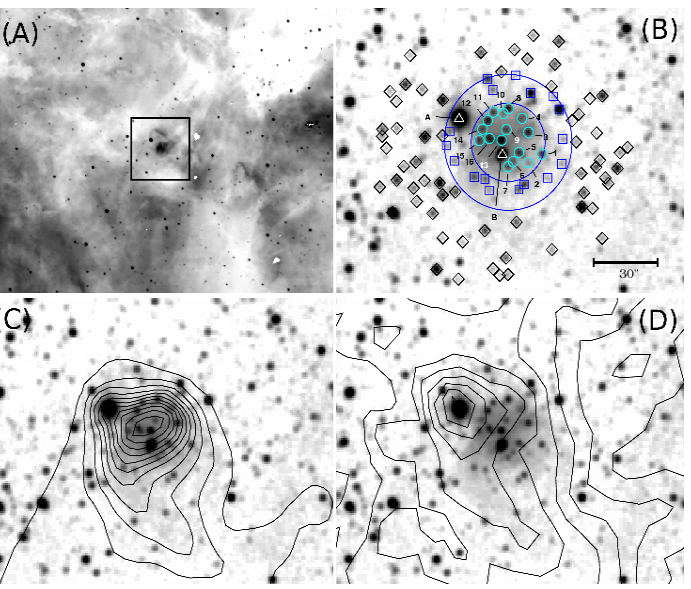
Previous studies have discussed the relationship between the optical and MSX images of the dust pillar surrounding the source G28784–0.82. It is the brightest point source in the mid-IR and 843 MHZ radio continuum images in the southern part of the Carina nebula (Rathborne et al., 2004). Also, these authors proposed that the region is a compact Hii region containing at least a massive star surrounded by a cluster of lower-mass embedded stars. The inspection of the optical emission images shows that the bright nebular clump around LS 1883 has dusty lanes crossing it, showing that the dust is intimately associated with the compact Hii region. LS 1883 was classified as an O9.5 V star by Walsh (1984), and we confirm this classification (see below). This star is placed slightly off centre to the south-east of the nebular clump, as seen in the emission line optical images, but in the IR images (see Figure 1) the star is away from the centre of the cluster to the south. The optical images show a clear gradient in brightness and ionization, peaking in nebulosity just around LS 1883 and decreasing outwards, with radii of about 8 arcsec ( pc) for [Oiii], 15 arcsec ( pc) for H, and 20 arcsec ( pc) for [Sii], respectively. The ionization gradient centred in LS 1883 suggests that this star is the main ionizing source. The offset of this source, both in the optical and the IR can be explained as follows. LS 1883 is producing a blister-like Hii region opening the cavity to the south-west, and is carving its natal molecular cloud to the north-east where most of the IR sources of the cluster are located. Walsh (1984) detected a splitting in the H nebular profile centred in this O9.5 V star of about 25 km s-1, suggesting an expanding shell with a velocity of about 12 km s-1.
Figures 1C and 1D show an enlargement of the H band image overlapped with the contours of the MSX band A, and the ratio between MSX bands A and C, respectively. We must note that the maximum emission detected on band A (which traces PAH dust emission) lies roughly at the apparent projected centre of the IR star cluster. The ratio between MSX A and C bands shows that the warmest dust is located at the position of the very intriguing emission-line star SS73 24 (labeled with letter A in Figure 1B). Rathborne et al. (2004) show similar contour maps for G287.84–0.82 but their MSX contours are shifted 11 arcsec in declination, and they misplace the peak, matching it with LS 1883. The astrometric solution used for our images is supported by the perfect match between the MSX A/C image and the coordinates of SS73 24 in figure 1D. The link between SS73 24 and the IR cluster will be further discussed below.
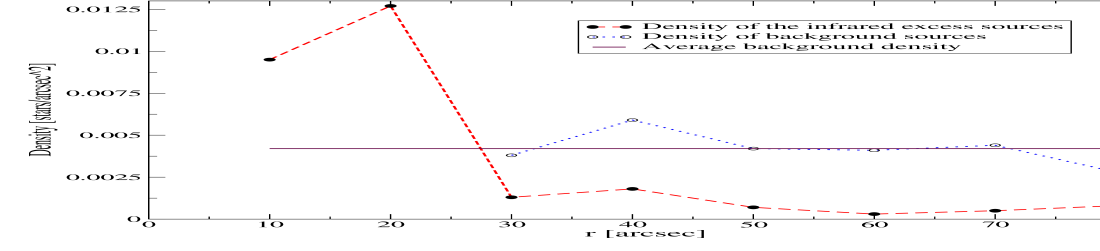
As was noted earlier, Dutra et al. (2003) detected a concentration of IR sources around LS 1883 in the 2MASS images. The analysis of IR images are advantageous because they reduce the effect of the high extinction present in the zone, and also because the controversial variation of in the Carina nebula does not affect IR extinction. This means that, in the IR, we need to consider only one extinction law (see Mathis 1990) and we can safely neglect the dependence of the IR absorption coefficients with . Bearing in mind possible projection effects, we analysed the spatial distribution of stars near LS 1883. To quantify this, we have studied the surface density of the IR excess sources with respect to the background (Figure 2), which was calculated between 30 arcsec and 80 arcsec from the centre of the IR cluster with a bin size of 10 arcsec. The plot also includes the density of background sources, which shows a very flat profile, with an average value of 0.0042 stars arcsec-2. This value is about one order of magnitude lower than the estimated density for the IR excess sources inside the circle of 22.5 arcsec radius. Another fact that supports the presence of a concentration of IR sources is that the density of these objects outside the 30 arcsec radius drops roughly five times below the average background density.
| J | H | Ks | (H-Ks) | (J-H) | Id. | |||||||
|---|---|---|---|---|---|---|---|---|---|---|---|---|
| 161.460265 | -59.951054 | 14.22 | 0.02 | 13.18 | 0.06 | 12.55 | 0.05 | 0.63 | 0.07 | 1.40 | 0.06 | 1 |
| 161.464906 | -59.952431 | 16.24 | 0.24 | 14.71 | 0.18 | 13.81 | 0.16 | 0.90 | 0.24 | 1.53 | 0.30 | 2 |
| 161.464823 | -59.947571 | 13.42 | null | 12.76 | 0.07 | 11.77 | 0.07 | 1.00 | 0.10 | 0.66 | null | 3 |
| 161.466978 | -59.945354 | 15.19 | 0.16 | 12.57 | null | 11.40 | null | 1.17 | null | 2.62 | null | 4 |
| 161.468003 | -59.950760 | 14.04 | 0.11 | 13.10 | 0.09 | 12.41 | 0.08 | 0.69 | 0.12 | 0.95 | 0.15 | 5 |
| 161.470004 | -59.952248 | 14.56 | 0.16 | 13.83 | 0.15 | 12.72 | 0.13 | 1.11 | 0.20 | 0.73 | 0.22 | 6 |
| 161.471684 | -59.953056 | 14.34 | 0.13 | 13.67 | 0.11 | 13.02 | 0.10 | 0.65 | 0.15 | 0.66 | 0.18 | 7 |
| 161.471572 | -59.943806 | 15.17 | 0.08 | 12.62 | 0.06 | 11.23 | 0.05 | 1.39 | 0.07 | 2.55 | 0.10 | 8 |
| 161.472295 | -59.947170 | 14.67 | 0.10 | 13.42 | 0.12 | 12.41 | 0.10 | 1.01 | 0.16 | 1.28 | 0.16 | 9 |
| 161.473307 | -59.944599 | 15.92 | 0.15 | 14.29 | 0.12 | 12.96 | 0.10 | 1.33 | 0.16 | 1.62 | 0.20 | 10 |
| 161.476696 | -59.944351 | 15.00 | 0.07 | 13.36 | 0.06 | 12.16 | 0.05 | 1.20 | 0.08 | 1.64 | 0.09 | 11 |
| 161.478586 | -59.945732 | 14.59 | 0.06 | 12.76 | 0.07 | 11.55 | 0.06 | 1.21 | 0.09 | 1.83 | 0.09 | 12 |
| 161.473868 | -59.948837 | 13.33 | 0.08 | 12.07 | 0.07 | 10.99 | 0.05 | 1.15 | 0.08 | 1.25 | 0.11 | 13 |
| 161.480326 | -59.947094 | 15.78 | 0.15 | 13.60 | 0.11 | 12.12 | 0.09 | 1.48 | 0.14 | 2.18 | 0.18 | 14 |
| 161.481440 | -59.948910 | 13.90 | 0.04 | 13.41 | 0.06 | 12.71 | 0.09 | 0.71 | 0.11 | 0.49 | 0.07 | 15 |
| 161.478012 | -59.948570 | 14.04 | 0.10 | 12.73 | 0.10 | 11.70 | 0.08 | 1.03 | 0.12 | 1.32 | 0.14 | 16 |
| 161.473788 | -59.951069 | 9.93 | 0.02 | 9.66 | 0.03 | 9.44 | 0.03 | 0.22 | 0.04 | 0.27 | 0.04 | B |
3.2 2MASS Stellar photometry
To investigate the IR properties of stars in the observed field, we have plotted J H Ks colour-colour (C-C) and colour-magnitude (C-M) diagrams, and compared them with the absolute IR magnitudes and colours from ZAMS stars (see Figures 3 and 4). The main-sequence and the cool giant branch loci in the C-C diagram were adopted from Hanson et al. (1997), whereas the ZAMS IR magnitudes and colours for the C-M diagram were calculated again by us following the same procedure as Hanson et al. (1997), but including stars with later spectral types, reaching G8 V. We have used the calibration between effective temperatures and spectral types presented in Massey et al. (1989) for O3 to B0.5, and in Kenyon & Hartmann (1995) from B1 to G8, which show consistency where they overlap. Luminosities were obtained from the Geneva models (Schaller et al., 1992) as a function of these effective temperatures. Bolometric corrections were derived from the stellar effective temperatures using either Massey et al. (1989) or Kenyon & Hartmann (1995), accordingly. ZAMS absolute V magnitudes were therefore determined, and using the colours given by Koornneef (1983), we calculated the ZAMS absolute K magnitudes as a function of spectral type.
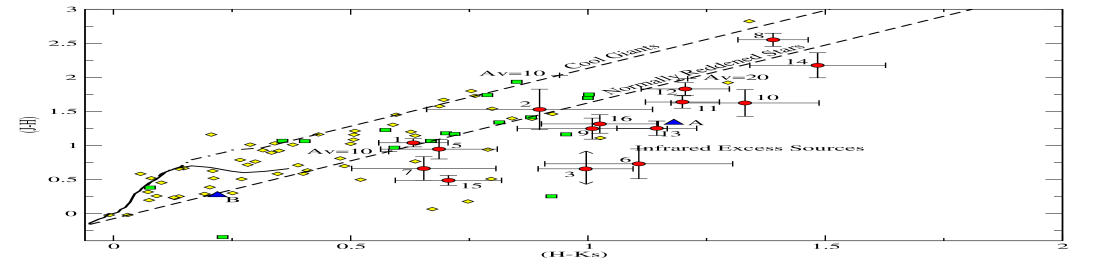
Under normal circumstances, stars that appear only in the reddening band (between the dashed lines) in the C-C diagram (see Figure 3), should be main-sequence or cool giant stars affected by different degrees of interstellar extinction. Young stellar objects (YSOs), such as Herbig Ae/Be and T Tauri type stars are frequently found to the right of the normal reddening vector of a dwarf early-type star because of near-IR excess emission (Lada & Adams, 1992). As we can see in the C-C diagram, most of the suspected IR cluster’s stars lie to the right of the reddening band, with roughly the same intrinsic IR excess. We have included in this C-C diagram the error bars estimated from error propagation of the individual magnitude errors as listed by the 2MASS. From these, it can be seen that the location of the IR cluster’s sources cannot be blamed on photometric uncertainties.
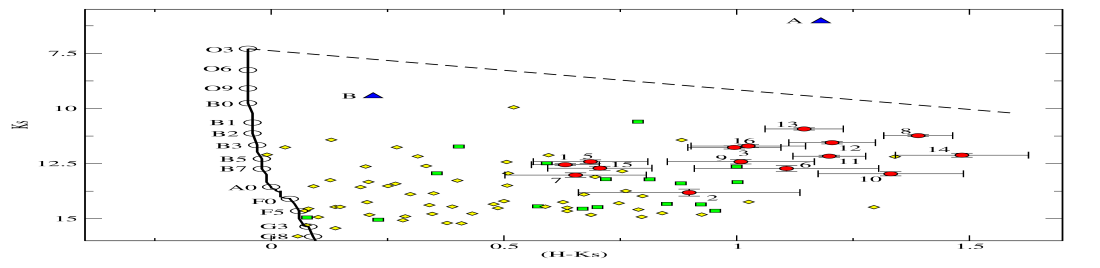
Important information about the IR properties of the stars can be deduced from the location in the near-IR C-M diagram. We have assumed that the IR cluster is placed at the same distance as Carinae, about 2300 pc (Davidson et al., 1997), so that at such a distance, stars with a large (H-Ks) colour are distant cool giant and supergiant stars, embedded luminous O B stars, or very luminous YSOs. In the latter case, this excess is an intrinsic signature of the source. With these, we built the C-M diagram (Figure 4) which shows that stars with IR excess form a distinct group in the plane, lying in the region where pre-main sequence stars are expected to be observed. Source 4 has not been included in both diagrams due to the great uncertainty in the magnitude values (see Table 1). However, we have taken into account this object in the estimation of the projected stellar density because it is a clear IR source. In the case of source 3 the error bar is plotted with arrows, indicating the uncertainty in the magnitude error. However, as the magnitudes in the other two bands are acceptable, and so its position in the C-M diagram is not affected, we have included it in this diagram.

On the other hand, we can appreciate that most of the observed field stars in Figure 1B (out to 22.5 arcsec from the centre of the cluster) delineate in both diagrams a typical distribution of main-sequence and cool giant field stars affected by a low and moderate IR extinction.
Dutra et al. (2003) estimated for this cluster 10 members and a radius of 45 arcsec (0.55 pc) at a distance of 2500 pc, which means a density of about 15 stars pc-3. This result is much lower than the densities of 102 to 103 expected for IR clusters with current star formation - values which were obtained from a study of 28 young stellar clusters surrounding Herbig Ae/Be stars (Testi et al., 1999). As we have shown above, if we assume that the IR cluster has at least 17 resolved members and a radius of 22.5 arcsec ( 0.25 pc at a distance of 2300 pc), we can derive a lower limit for the stellar density of about 260 stars pc-3, in better agreement with Testi et al. (1999). This lower limit is established by the resolution and sensitivity of the 2MASS images.
3.3 LS 1883 & SS73 24
The early spectral type of the optically brightest star (LS 1883), which lies inside the estimated IR cluster radius (see Figure 1B), constrains the scenarios described by Testi et al. (1999), where it is expected that clusters with such high densities have associated massive stars. Alternatively, this star could be a field star projected on the IR cluster sky position. From our low dispersion spectra of LS 1883, we have classified it as an O9.5 V star using the relative intensities of Hei 4471Å and Heii 4542Å and Heii 4686Å absorption lines, according to the Conti (1973) criteria (Figure 5). Furthermore, the comparison with the Walborn & Fitzpatrick (1990) OB Stars Spectral Atlas shows that the spectrum of LS 1883 resembles that of O9.5 V star HD 93027, including the presence of C iii absorption lines. Our spectral classification of LS 1883 is in agreement with the previous one by Walsh (1984). We note that even though Walsh’s sky-subtracted stellar spectrum was contaminated with emission lines originating from the nebula, he arrived at the same result as us.
The positions of LS 1883 (labelled B in Figure 1B) in both the C-C and C-M diagrams (Figures 3 and 4) agree very well ( 0.38) with a moderately reddened O9 V star, which suggests that, within the observational errors, the star could belong to the cluster. In this case, it can be interpreted as a ZAMS massive star at the beginning of the destruction of its natal cocoon, perhaps in one of the earliest stages of evolution compared with the Trapezium O stars in the Orion Nebula. The ultraviolet radiation and incipient stellar winds from the O9.5 V star LS 1883 seem to produce a small blister-like nebular structure, carving its parental cloud and revealing the embedded cluster whose members probably have lower masses, in a similar scenario found in Knots 1 and 2 in the 30 Doradus nebula (Walborn et al., 1999).
The second conspicuous optical star (labelled A in Figure 1B) is SS73 24 (WRAY 15-642), a Be! pec star (Sanduleak & Stephenson, 1973). The spectrum was briefly described by Pereira et al. (2003), who have shown the presence of Balmer lines, Hei 5876 Å and some iron lines in emission (e.g. Feii, [Feii]). Moreover, García-Lario et al. (1999) have found that the spectrum resembles that of Hen 401, a protoplanetary nebula. Our spectra of SS73 24 look very similar to those presented by Pereira et al. (2003). The very careful background subtraction shows that no forbidden emission lines of [Oi] 6300-6363 Å and [Sii] 6716-6731 Å are seen, but Sii 6347-6350 Å , Hei 6678 Å , and some additional Feii emission lines are present. Furthermore, the position of the star in the C-C diagram (Figure 3), shows that the IR excess for this star is consistent with most of the IR cluster stars, suggesting that this star could be linked with the IR cluster. However, the position of this star in the C-M diagram (Figure 4) clearly shows that it is brighter than the rest of the IR cluster’s stars. It also lies above the O3 V reddening vector, which could be interpreted as due to a shorter distance to this object (and thus unrelated to the IR cluster) or due to the presence of strong intrinsic IR continuum emission. In this way, as we note above, SS73 24 is detected in the MSX band A image as an extension of the emission to the east of G287.84–0.82 (Figure 1C). Also, this star presents an MSX band A to C ratio, which indicates warm dust emission directly associated with it. The inspection of our optical narrow band images does not reveal any nebular structure associated with SS73 24. The absence of forbidden emission lines of [Sii] 6716-6731Å suggests that the star is surrounded by a very dense and unresolved compact dusty envelope. Peculiar spectra like SS73 24 are also found in active interacting binaries of moderately long periods which exhibit strong mass loss, such as W Serpentis (Barbá, 1993), or AS 78 and MWC 657 (Miroshnichenko et al., 2000). SS73 24 deserves more special attention (both spectroscopically and photometrically), in order to understand its nature, and whether or not it is related to the cluster.
4 Summary
We have derived some of the optical and near-IR properties of G287.84–0.82 confirming that it is an IR star cluster, embedded in the head of a dusty pillar in the southern part of the Carina nebula (NGC 3372). Also, we have established some important properties of the brightest optical sources in the field of the cluster. These can be summarized as follows.
-
1.
The surface density of IR excess sources located in the IR cluster is one order of magnitude greater than the background density.
-
2.
The density of IR excess sources outside the 30 arcsec radius is roughly five times lower than the background density.
-
3.
The cluster has at least 17 members, and its parameters, radius and stellar density, are in good agreement with high to intermediate mass star formation scenarios.
-
4.
C-C and C-M diagrams show roughly the same IR excess as most of the IR cluster member candidates.
-
5.
These IR excesses suggest that these objects could be intermediate-mass pre-main sequence stars.
-
6.
LS 1883 is located near to the IR cluster core. We confirm the O9.5 V spectral type for this star based on the presence of He ii absorption lines. This spectral classification agrees with the position in the C-C and C-M diagrams for a moderately reddened O9 V star. LS 1883 seems to be the first ZAMS star emerging from the cluster, and it could be producing a blister-like Hii region. Optical narrow band images reveal an ionizing gradient in the nebula surrounding the star.
-
7.
The positions of SS73 24 in the C-C and C-M diagrams suggest that this star has a strong intrinsic near-IR continuum emission, although we cannot establish any relationship between SS73 24 and the IR cluster.
-
8.
The spectral characteristics of SS73 24 suggest that this star could be related to a strong mass-loss stage in an interacting binary.
-
9.
The mid-IR MSX images show emission from the IR cluster and from warm dust associated with SS73 24.
Some of these facts are consistent with the current star formation scenarios associated with highly embedded IR star clusters, where the most massive component is an O-type star. In order to be able to reveal the true nature of each individual IR cluster member, spectroscopic observations and images with higher spatial resolution in the near-IR and mid-IR wavelength range are needed.
Acknowledgments We are very grateful to Michael Taylor and Silvia Giovagnoli for their aid in the clarification of some passages of the text. We specially want to thank Elena Terlevich, who read this paper and suggested to us a better way to present different aspects of this work. Substantial improvements to the paper resulted from a careful revision and suggestion from an anonymous referee. This research made use of data products from the Midcourse Space Experiment. Processing of the data was funded by the Ballistic Missile Defense Organization with additional support from NASA Office of Space Science. This research has also made use of data products from the Two Micron All Sky Survey, which is a joint project of the University of Massachusetts and the IR Processing and Analysis Centre, funded by the NASA and the NSF. We want to thank the director and staff of CTIO for the use of their facilities and kind hospitality during the observing run. We acknowledge the use at CASLEO of the CCD and data acquisition system supported under US NSF grant AST-90-15827 to R.M. Rich. Also, we thank Julia Arias for providing us with the low resolution spectra of LS 1883 and SS73 24.
References
- Barbá (1993) Barbá R., 1993, Astron. Astrophys., 269, 390
- Conti (1973) Conti P. S., 1973, Astrophys. J., 179, 181
- Cutri, et al. (2000) Cutri, et al. 2000, Explanatory Supplement to the 2MASS Second Incremental Data Release (Pasadena:IPAC)
- Davidson et al. (1997) Davidson K., Zethson T., Johansson S., Ishibashi K., Ebbets D., 1997, Bulletin of the American Astronomical Society, 29, 1261
- Dutra & Bica (2001) Dutra C. M., Bica E., 2001, Astron. Astrophys., 376, 434
- Dutra et al. (2003) Dutra C. M., Bica E., Soares J., Barbuy B., 2003, Astron. Astrophys., 400, 533
- Egan et al. (1998) Egan M. P., Shipman R. F., Price S. D., Carey S. J., Clark F. O., Cohen M., 1998, Astrophys. J. Letters, 494, L199
- García-Lario et al. (1999) García-Lario P., Riera A., Manchado A., 1999, Astrophys. J., 526, 854
- Hanson et al. (1997) Hanson M. M., Howarth I. D., Conti P. S., 1997, Astrophys. J., 489, 698
- Kenyon & Hartmann (1995) Kenyon S. J., Hartmann L., 1995, Astrophys. J., Suppl. Ser., 101, 117
- Koornneef (1983) Koornneef J., 1983, Astron. Astrophys., 128, 84
- Lada & Adams (1992) Lada C. J., Adams F. C., 1992, Astrophys. J., 393, 278
- Lada & Lada (1991) Lada C. J., Lada E. A., 1991, in ASP Conf. Ser. 13: The Formation and Evolution of Star Clusters The nature, origin and evolution of embedded star clusters. p. 3
- Magakian (2003) Magakian T. Y., 2003, Astron. Astrophys., 399, 141
- Massey & Johnson (1993) Massey P., Johnson J., 1993, Astron. J., 105, 980
- Massey et al. (1989) Massey P., Parker J. W., Garmany C. D., 1989, Astron. J., 98, 1305
- Mathis (1990) Mathis J. S., 1990, Ann. Rev. Astron. Astrophys., 28, 37
- Miroshnichenko et al. (2000) Miroshnichenko A. S., Chentsov E. L., Klochkova V. G., Kuratov K. S., Sheikina T. A., Mukanov D. B., Bjorkman K. S., Gray R. O., Rudy R. J., Lynch D. K., Mazuk S., Puetter R., García-Lario P., Perea J. V., Bergner Y. K., 2000, Astron. Astrophys. Suppl. Ser., 147, 5
- Pereira et al. (2003) Pereira C. B., Franco C. S., de Araújo F. X., 2003, Astron. Astrophys., 397, 927
- Rathborne et al. (2004) Rathborne J. M., Brooks K. J., Burton M. G., Cohen M., Bontemps S., 2004, Astron. Astrophys., 418, 563
- Rathborne et al. (2002) Rathborne J. M., Burton M. G., Brooks K. J., Cohen M., Ashley M. C. B., Storey J. W. V., 2002, Mon. Not. R. Astron. Soc., 331, 85
- Sanduleak & Stephenson (1973) Sanduleak N., Stephenson C. B., 1973, Astrophys. J., 185, 899
- Schaller et al. (1992) Schaller G., Schaerer D., Meynet G., Maeder A., 1992, Astron. Astrophys. Suppl. Ser., 96, 269
- Skrutskie et al. (1997) Skrutskie M. F., Schneider S. E., Stiening R., Strom S. E., Weinberg M. D., Beichman C., Chester T., Cutri R., Lonsdale C., Elias J., Elston R., Capps R., Carpenter J., Huchra J., Liebert J., Monet D., Price S., Seitzer P., 1997, in ASSL Vol. 210: The Impact of Large Scale Near-IR Sky Surveys The Two Micron All Sky Survey (2MASS): Overview and Status.. p. 25
- Smith et al. (2000) Smith N., Egan M. P., Carey S., Price S. D., Morse J. A., Price P. A., 2000, Astrophys. J. Letters, 532, L145
- Testi et al. (1999) Testi L., Palla F., Natta A., 1999, Astron. Astrophys., 342, 515
- van den Bergh & Herbst (1975) van den Bergh S., Herbst W., 1975, Astron. J., 80, 208
- Walborn (1971) Walborn N. R., 1971, Astrophys. J. Letters, 167, L31
- Walborn (1973) Walborn N. R., 1973, Astrophys. J., 179, 517
- Walborn (1995) Walborn N. R., 1995, in Revista Mexicana de Astronomia y Astrofisica Conference Series The Stellar Content of the Carina Nebula (Invited Paper). p. 51
- Walborn et al. (1999) Walborn N. R., Barbá R. H., Brandner W., Rubio M., Grebel E. K., Probst R. G., 1999, Astron. J., 117, 225
- Walborn & Fitzpatrick (1990) Walborn N. R., Fitzpatrick E. L., 1990, Publ. Astron. Soc. Pac., 102, 379
- Walsh (1984) Walsh J. R., 1984, Astron. Astrophys., 138, 380