(1) INFN, section of Napoli, Napoli, Italy
(2) Dept. of Physical Sciences, Univ. of Napoli Federico II, Napoli, Italy
(3) Dept. of Physics and Astronomy, Univ. of Catania and INFN, Section of Catania,
Catania, Italy
(4) P.N.Lebedev Physical Institute, Moscow, Russia
A new Multiparametric Topological method for determining the primary cosmic ray mass composition in the knee energy region
Abstract
The determination of the primary cosmic ray mass composition from the characteristics of extensive air showers (EAS), obtained at an observation level in the lower half of the atmosphere, is still an open problem. In this work we propose a new method of Multiparametric Topological Analysis and show its applicability for the determination of the mass composition of the primary cosmic rays at the PeV energy region.
1 Introduction
It is clear that due to large fluctuations in the longitudinal development of extensive air showers (EAS) and relatively weak sensitivity of EAS characteristics to the mass of the parent particle, the observed parameters of showers initiated by particles with different primary masses largely overlap. In order to estimate the primary mass in the case of the individual shower or to estimate the mean mass composition at a certain energy we have to use as many observables as possible. To process the big amount of information various multiparametric and non-parametric methods are employed. Among them are multivariate fitting, KNN-method, Bayesian approach, neural net analysis and others. In [1] we proposed a new method of the multiparametric topological analysis (MTA) for the study of the mean mass composition on the basis of the EAS longitudinal development data. We tested this method using the data simulated in the EeV energy region for the Pierre Auger experiment and were encouraged by its accuracy and the easy applicability. In this contribution we test this method at the lower, PeV energy region close to the well known ’knee’ in the primary cosmic ray energy spectrum (3 PeV). Experimental arrays for the EAS study in this energy region are usually more compact and are able to measure the total size of electron , muon , hadron and Cherenkov light components of the shower. The typical example of such a complex EAS array is KASCADE [2]. Here we use only two parameters: and , although the method is easily generalized for the larger number of observables.
2 The simulated data
In what follows, we assume that the primary energy estimate for the observed events is accurate at a few percent level. In fact, the primary energy estimator for KASCADE is - the total number of low energy ( GeV) muons collected in the interval of distances between 40 and 200 m from the shower core. It has been shown that this number depends just on the primary energy and not on the primary mass. The accuracy of the primary energy estimate in the knee region made with this parameter is determined mainly by the reconstruction error and is about 5% [3]
The data set used to implement and test the new method consists of 20000 vertical cascades produced by particles with the fixed energy of 0.5 PeV, 8000 cascades for 1 PeV and 2000 cascades for 5 PeV, simulated using the CORSIKA program (version 6.023, [4]) with the QGSJET interaction model. Simulations were performed using Naples PCs . The primary nuclei were , , and , each of them initiating 5000, 2000 and 500 cascades for 0.5, 1 and 5 PeV primary energy respectively. The CORSIKA output provides various characteristics of the shower: the total number of different particles, their lateral distribution and arrival times at different observation levels.
3 Multiparametric Topological Analysis (MTA)
The MTA method, when applied to the simulated data, relies on a topological analysis of correlations between the most significant parameters of the shower development in the atmosphere. In principle this method could be used also with a greater number of parameters, however, in this paper we restrict ourself to the simple case of two parameters only: and - the total number of electrons and muons at the sea level. A scatter plot of these two parameters has been built using the showers for 0.5 PeV, for 1 PeV and for 5 PeV primary energy. Figure 1 shows the scatter plot for only proton and iron induced showers of 1 PeV primary energy as well as their projected distributions.

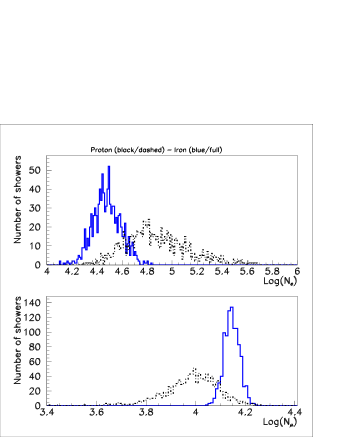
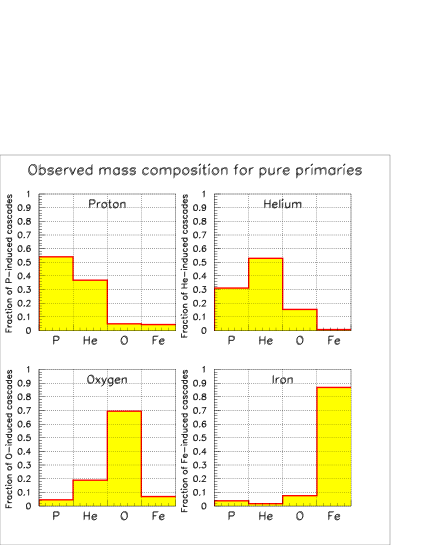
It can be seen that the populations arising from two nuclei are quite well separated in the plane, but not in the projected one-dimensional plots. The scatter plot of four primary nuclei: and shows much less separation even in the two-dimensional plot. The idea of the MTA method is to divide the entire area of the scatter plot into cells whose dimensions are defined by the accuracy with which the parameters can be measured. For this work, we adopted the accuracy and the size of the cell equal to and , which corresponds to the experimental errors of KASCADE array [2]. In each cell we can find the total number of showers N, as the sum of N, N, N and N showers induced by P, He, O and Fe respectively, and then derive the associated frequencies: p=N/N, p=N/N, p=N/N and p=N/N which can be interpreted as the probability for a real shower falling into the cell to be initiated by proton, helium, oxygen or iron primary nuclei. In other words, in the case of an experimental data set of showers, it may be seen as composed of a mixture of N pP proton showers, N pHe helium showers, N pO oxygen showers and N pFe iron induced showers, where pp. As a probe set of ’experimental’ showers 4 subsets of showers, different from those used for the determination of probabilities pA, have been used. Each subset consists of 500 showers for 0.5 PeV, 200 showers for 1 PeV and 50 showers for 5 PeV primary energy. For each individual shower in a given subset the partial probabilities p , p , p and p have been read from the relevant cell i. The sum of such probabilities over the entire subset permits to estimate the probability for a shower of a given nature to be identified as a shower generated by the , , or primary particle. This probability is shown in Figure 2 at E = 1 PeV. One can see that the method works quite well being able to attribute the highest probability to the correct nuclei.
4 Determination of the primary mass composition
The obtained mean probabilities for cascades induced by type nuclei to be identified as those induced by nuclei for the pure primary mass composition can be used for the reconstruction of the mixed primary mass composition as the coefficients in the system of linear equations:
where , , and are the true numbers, which determine the primary mass composition in the sample of cascades, which are observed as , , and , due to a misclassification.
In order to invert the problem and to reconstruct the abundances in the primary mass composition from the observed abundances and the known probabilities , we can apply any method capable to solve the inverse problem taking into account possible errors of the observed distribution and the constraint:
| (1) |
The observed abundances were simulated using a set of 4800 cascades different from those used for the determination of . At the moment the result of the solution for the uniform primary mass composition at E = 1 PeV, with all abundances = 0.25, reconstructed by MTA method is , , and .
As an example of the non-uniform mass composition we have taken the case with = 0.1, = 0.4, which resembles the mass composition of cosmic rays at the knee energy of 3 PeV [5]. The total amount of cascades used for the simulation of this distribution is 2000 (200 + 800 + 800 +200 ). The result of the solution for this case is , , and at E = 1 PeV .
It is seen that absolute values of the abundance are reconstructed satisfactorily.
For the time being the values of the probabilities are assumed to be known precisely. A more accurate solution of the system, taking propely into account the errors of the probability, is under study.
5 Application for experimental cascades
It has to be stressed that all the results outlined above are biased by the fact that we are dealing with simulated ’noiseless’ data and more realistic testing has to be performed using data which take into account the varying primary energy and inclination angle, the instrumental signature (noise) and the various sources of errors (uneven and incomplete sampling, etc.). Application of MTA is straightforward - the relevant simulations should be made with the largest possible statistics.
The preliminary study of the effect of the experimental errors shows rather strong dependence of the probabilities on the adopted errors. In Figure 3 we show the probabilities for the correct identification of nuclei as a function of the primary energy. The experimental accuracies of the shower size determination have been taken as = 0.02 and = 0.05. It is seen that while the energy dependence is week the reduction of probability is substantial.

6 Conclusions
We proposed and tested the Multiparametric Topological Analysis method for the determination of the mean primary cosmic ray mass composition on the basis of measurements of just two parameters of the observed EAS - the total number of electrons and muons. Definitely the method needs further development before being used for the processing of real experimental cascades, but the first results are very encouraging. The next efforts should include the increase of simulation statistics, the study of the effect of the shower energy spectrum and angular distribution, the accurate estimate of the reconstruction errors. The great advantage of the proposed MTA method is that it is extremely easy to use and generalize for the larger number of observables.
Acknowledgements
Authors thank K.H.Kampert and L.Perrone for useful discussions.
References
- [1] Ambrosio M. et al., 2004, Talk at CRIS2004, to be published in Nucl.Phys.B (Proc.Suppl.), 2004
- [2] Antoni T. et al., 2003, Nucl. Instr. Meth.,A513, 490
- [3] Weber J. et al., 1997, 25th ICRC, Durban, 6, 153
- [4] Heck D. et al. 1998, FZKA Report Forschungszentrum Karlsruhe 6019
- [5] Kampert K.-H. et al., 2004, astro-ph/0405608