MULTI-WAVELENGTH OBSERVATIONS OF AN UNUSUAL IMPULSIVE FLARE ASSOCIATED WITH CME
Abstract
We present the results of a detailed analysis of multi-wavelength observations of a very impulsive solar flare 1B/M6.7, which occurred on 10 March, 2001 in NOAA AR 9368 (N27 W42). The observations show that the flare is very impulsive with very hard spectrum in HXR that reveal non-thermal emission was most dominant. On the other hand this flare also produced type II radio burst and coronal mass ejections (CME), which are not general characteristics for impulsive flares. In H we observed the bright mass ejecta (BME) followed by drak mass ejecta (DME). Based on the consistence of the onset times and direction of BME and CME, we conclude that these two phenomena are closely associated. It is inferred that the energy build-up took place due to photospheric reconnection between emerging positive parasitic polarity and predominant negative polarity, which resulted as a consequence of flux cancellation. The shear increased to 80o due to further emergence of positive parasitic polarity causing strongly enhanced cancellation of flux. It appears that such enhanced magnetic flux cancellation in a strongly sheared region triggered the impulsive flare.
Appl. Opt.
Dr. Wahab Uddin
Aryabhatt Research Institute of Observational Sciences
(Formerly State Observatory)
Manora Peak, Naini Tal263 129,
INDIA.
Phone: +91-05942-235583, 235136
Fax: +91-05942-235136
email: wahab@upso.ernet.in
1 INTRODUCTION
Impulsive flares produce a wide range of emission from -rays, X-ray, EUV, visible, microwave (MW) and longwave radio emission (Miller et al., 1997). The X-ray emission is comprised of thermal, superhot and non-thermal components. Based on the classical nonthermal thick-target model it is proposed that the electrons accelerated to 100 keV in the corona spiral downwards, and creating MW (Brown, 1971; Lin and Hudson, 1976; Kundu and White, 2001). When they reach the footpoints of a coronal loop, they produce hard X-ray (HXR) and drive evaporation, which fills the loop with hot plasma emitting in soft X-rays (SXR).
For better understanding of the various aspect of flare phenomena at different height of solar atmosphere, it is important to resolve the different structures involved and temporal evolution during the flare. Therefore simultaneous observations of chromospheric (optical) coronal (X-ray and MW) with high temporal and spatial resolutions can provide wealth of information for flare diagnostic.
In this paper we present analysis of 10 March 2001 impulsive flare at different wavelengths, viz., H, HXR, SXR and radio wave to understand the various physical processes taking place at different height in the above flare.
2 OBSERVATIONS
In the peak of solar cycle 23 on March 10, 2001 we observed a very impulsive solar flare 1B/M6.7 in H from NOAA 9368 at the location N27 W42. The flare observations were carried out at State Observatory, Manora Peak, Nainital, India with 15 cm, f/15 Coudé Solar Tower Telescope equipped with Bernhard Halle H filter and Wright Instrument CCD camera system ( 16 bit, 385576 pixel, pixel size = 22 micron square). With the help of barlow lens the image has been magnified twice, so we get resolution of 1 per pixel. The observed filtergrams were corrected using dark current and flat field images taken through CCD during the observations. All images were re-registered. The flare has been simultaneously observed by Yohkoh/HXT (Kosugi et al. 1991) and SXT (Tsuneta et al. 1991). To study the flare in MW we have used Nobeyama, Japan observations. SOHO/LASCO (Brueckner et al. 1995) and SOHO/EIT (Delaboudiniere et al. 1995) observed the CME associated with the present flare under study. This flare also produced several strong radio bursts and it was well observed by the HiRAS observatory, Japan and WAVES/WIND (Bougeret et al. 1995) spectrometers in a broad range of radio frequencies. To understand the energy build-up process we used SOHO/MDI (Scherrer et al, 1995) and NAOJ, Mitaka, Japan magnetograms.
3 ANALYSIS AND RESULTS
3.1 Temporal Evolution
On 10 March 2001 a very impulsive flare occurred in the following sunspot region of NOAA AR 9368 located at N27 W42 in heliocentric coordinates. GOES SXR observations marked it as a M6.7 class while in H it was recorded as 1B class. Shown in Figure 1 are light curves of the HXR emission from the flare as observed by HXT. The light curves are in the four energy windows: L (1423 keV), M1 (2333 keV), M2 (3353 keV), and H (5393 keV). In all the four energy channels the flare show that impulsive component is very strong having maximum

counts 528, 570, 550 and 463 in L, M1, M2 and H bands respectively. The HXT data show that the flare had a quite hard spectrum. In order to summerizing the HXR observations according to the time profiles , we divide the flare into three phases: (a) precursor phase (04:03:00 - 04:03:15 UT), (b) impulsive phase (04:03:15 - 04:03:50 UT) and (c) gradual phase ( after 04:03:50 UT). In this event precursor phase is very short about 15 sec. However, the impulsive phase has three separate spikes, which are clearly seen in all four energy bands. The impulsive component refers to non-thermal emission. The superhot and the thermal components are visible after 04:03:50 UT, however only in L and M1 energy bands.
The bottom panel of Figure 1 presents evolution of the flare at 17 GHz. observed with NoRP Nobeyama. The MW time profile shows very impulsive nature similar to HXR at higher energy bands viz., M1, M2 and H bands respectively.
We derived emission measure and temperature from M1/L ratio of HXT data that is 1049 cm-3 and 32 MK respectively. In Figure 2 (top) we show the emission measure and temperature variation as a function of time, while in Figure 2 (bottom) photon index as it varies as a function of time. The emission measure as well as photon index indicate that the flare component before 04:04 UT is purely nonthermal and after 04:05 UT it was thermal. It falls exponentially till 04:08 UT by almost three orders. This indicates that thermal plasma was radiating its heat very fast in the flare. It appears that during the impulsive phase of the current flare high energy electrons were accelerated in a very short time.
The H observations of the flare show two main kernels K1 and K2 (cf., Figure 7) appeared around 04:02 UT, which release most of the flare energy. The H light curves of K1 and K2 are shown in Figure 3 (left), while in soft X-ray emission in Figure 3 (right). This Figure reveals a gross correlationship between the chromospheric emission ( low temp 104 K) and the coronal emission (high temp 106 K). The time profiles of K1 and K2 show sharp rise similar to HXR emission indicating impulsive nature of the flare. The intensity of kernel K1 and K2 reached to maximum at 04:04:45 and 04:04:05 UT respectively. It may be noted from Figure 3 (right) that preflare thermal heating as seen by Yohkoh/SXR emission started around 04:00:51 UT, which suddenly and impulsively enhanced around 04:03:30 UT, almost in simultaneous to H and about 1520 sec. later to HXR impulsive onset time. The SXR emission of kernel A reach to maximum at 04:06:00 UT with ma-


ximum count (DN/sec) 1.35108 and kernel B reached maximum at 04:04:25 UT with maximum count 5.8107. In kernel B there are small fluctuations during the maximum phase. From time profiles of H and SXR we also found that the preflare heating started in H at about 04:01:11 UT and in SXR at about 04:00:51 UT as measured with observing cadence limitations. This indicates that in prior to impulsive phase chromosphere and corona are already intermittently connected. However, the maximum intensity reached in H and SXR at 04:04:45 and 04:06:00 UT respectively. The impulsive phase transports the accelerated electrons very impulsively, which in turn deposit their energy by collision with ambient material in lower corona and chromosphere as seen in the present case as K1 and K2 in H and corresponding A and B bright SXR sources. However, on the other hand, it is clear from the light curves of H, SXR, HXR that the current flare was of very short duration, almost of 12 min.
3.2 Dynamic Radio Spectra
Type II burst always follow flares, and hence the associated shock must be flare related; there remains a controversy as to weather they are driven primarily by CME or occur with the flare. During this flare several type II (slow drift), type III (fast drift) and type V radio bursts have been observed.
The dynamic radio spectra observed from Hiraso spectrograph shows group of metric type III burst with maximum intensity 3 at 04:01 UT. The metric type II burst began at 04:04 UT with starting frequency 400 MHz, which is equivalent to heliocentric distance 1.05 R. The burst ended at 04:16 UT at 40 MHz frequency. We estimated the shock speed from this type II burst spectrum of the order of 800 km sec-1.
On the other hand, WAVES/WIND observed interplanetary type II radio burst during 04:1804:32 UT in the frequency range 4000-14000 kHz, however with a weak fundamental and harmonic emissions. A strong type III radio burst was also recorded around 04:03 UT by WIND.
3.3 SOHO/LASCO and EIT Observations
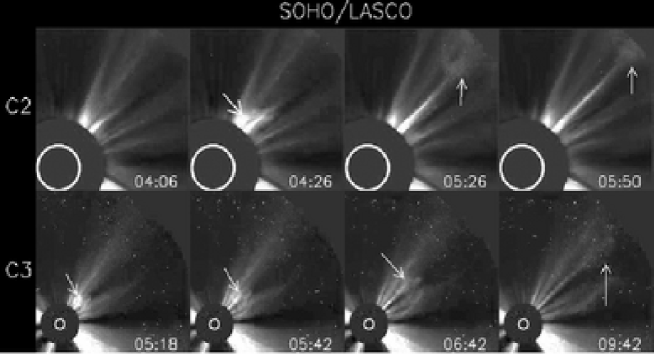
SOHO observed a coronal mass ejection and the coronal dimming associated with the current flare under study. Figure 4 illustrate a series of SOHO/LASCO C2 and C3 images of CME. At first, the CME appeared in C2 as a bright patch at 04:26 UT, marked by arrow. In C3 it appeared at a radial distance 9.19 R at 05:18 UT. In Figure 8 (right) we plot the height of the leading edge of CME as a function of time. The average velocity of the CME derived from this height-time plot is of the order of 800 km sec-1, almost same to the shock speed derived from type II radio burst. The CME was moving ahead with deceleration of about 23.2 m sec-2. The angular width and position angle of the CME were 81o and 310o respectively.
SOHO/EIT at 195 Å observed coronal dimming at the flare location associated with the CME. The dimming occurred in the north of the flare after 04:02 UT, i.e., after the onset of the flare. The evolution timescale of coronal dimming is faster than typical radiative cooling timescales in the corona, indicating that density depletion via expansion or ejection is most likely responsible for the dimming process (Hudsonet al., 1996), which is in agreement to present CME event.
3.4 Morphology of the active region
NOAA AR 9368 emerged on 2 March 2001 at N27 E48 location as a small spot of type magnetic class. The active region slowly developed as type along with an emerging magnetic flux of opposite polarity near main leading and following spots on 6 March. On 7 and 8 March 2001 the region expanded as noted from Figure 5. In Figure 5, we present a sequence of H filtergrams taken in line center and off bands, as well as the magnetograms taken by SOHO/MDI, from 710 March 2001. The H filtergrams on 78 March shows bright plages and dark arches in the central part of the region (cf., Figure 5).

The significant changes in active region occurred between 8 and 10 March 2001. On 8th March the following spot began to fragment and continued on 9th and 10th March. This activity was further accompanied by flux emergence of positive polarity. On the other hand, the leading spots did not show any considerable changes. However, on 9 March 2001 a 1N/M1.5 class impulsive flare occurred near the leading spots (cf., Figure 5). It was noted by us that the active region had developed into class on 9 March, which continued on 10 March 2001.
The SOHO/MDI magnetograms and intensitygrams from 2 to 10 March 2001 of the active region show that the following spot was growing faster than leading spot, however it decayed also faster. The magnetograms of the active region (cf., Figure 5) show that positive parasitic polarity emerged near the following spot. This positive flux (MMF) moved towards negative polarity dominated following spot resulting in flux cancellation. The flux cancellation rate between 8 and 10 March 2001 at the flare site was of the order of 1019 Mx hr-1. It seems that this MMF and the process of flux cancellation by it was a major source for energy build-up through photospheric reconnection. In fact at the location of such flux cancellation a filament is formed in chromosphere suggesting the set up of reconnection process at low lying levels (subphotospheric to photospheric level).
The high flux cancellation and thereby increasing shear in the following part of the active region from 8 to 10 March 2001 showed development of dark arches and twisted sigmoid type filament in H. This indicates the storage of magnetic energy at the slow rate. A small and almost straight H filament appeared on 9 March, which changed into the sigmoid structure (length about 26000 km, width 3500 km) on 10 March before flare onset (cf., Figure 7 ).
Vector magnetogram taken at NAOJ, Mitaka, Japan on 10 March 2001 before flare (cf., Figure 6) shows the magnetic field topology at the flare location. The flare occurred at the positive flux emergence site where the magnetic shear was high 80o (cf., Figure 6).
3.5 H Morphology of the flare
The current impulsive flare (1B/M6.7) under study that occurred on 10 March 2001 began in H at around 04:01 UT. A total 130 H filtergrams have been analysed for our present study. In Figure 7 we present a sequence of a few selected H filtergrams, which show significant


changes during flare evolution. As briefly described in section 3.1, the H flare began as a two small bright kernels, defined as K1 and K2, which rapidly expanded in a bright oval shape during the flare peak phase. Our H observations showed remarkable bright and dark mass ejection activity during the flare. The BME started along with DME from kernel K1 and K2 around maximum phase at 04:04:16 UT, which

continue until 04:05:05 UT (cf., Figure 7). The average sky plane speed of the BME is estimated to 600 km sec-1. However, later on around 04:06:58 UT only DME was seen as a bunch of surges and jets from kernel K1 and K2 . The average sky plane speed of DME was about 400 km s-1. The DME also triggered mass ejection from nearby but opposite side of the sigmoid filament. We noted formation of dark loop/arch filaments system in the active region onwards 04:24:50 UT. We infer from the H filtergrams that it is due to connection between both sides of dark mass ejection, perhaps as a consequence of condensation and hence downwards motion of the material in the pre-existing loops. The loop like arch filament system is clearly visible at 04:33:02 and 04:37:54 UT (cf. Figure 7). However, it faded out rapidly after 04:41:06 UT.
On the other hand, the flare showed fast changes during its evolution. The bright kernels K1 and K2 were the main centers of energy release. The H filtergrams showed that kernel K1 consisted of large number of twisted flux tubes/loops in contrast to kernel K2. Detailed analysis of our H filtergrams/movie of BME and DME showed that the solar material (plasma) ejected through the helically twisted flux ropes, which get detwisted during mass ejection. This indicate the relaxation of sheared magnetic field. From the above scenario it is unambiguously clear that the current impulsive but compact flare was associated with a blast wave of which the BME/DME were part and remnants.
4 DISCUSSION
The NOAA AR 9368 began as a very simple magnetic class region, and became magnetically complex in preview to emerging magnetic fluxes of opposite polarities that causing cancellation of magnetic fields and also increased the shear as seen on 10 March 2001. The 1B/M6.7 class impulsive flare occurred in this highly complex evolving magnetic field with magnetic class, and at the location where fields were highly sheared. From 8-10 March 2001 it considerably decayed and fragmented into many small spots. This kind of variation in following spot group appears to be a result of significant flux cancellation that was going on since 8 March due to appearance of MMF in the vicinity of following spot. We propose that such enhanced flux cancellation was the basic physical process for energy build-up and storage through photospheric reconnection, which, however, was inferred from the thin filament formation. Our these observations are in agreement to Litvinenko, and Martin (1999). However, on the other hand, the leading spot still maintained its large size. The energy build up through cancellation of magnetic flux by MMF is also earlier suggested by many investigators (Uddin, et al., 1986, Kurokawa, 1987, Kosovichev and Zharkova, 2001).
Mass motion play an important role in solar flares (Martin, 1989). Figure 8 shows the height-time plots of the BME, DME (Left) and CME (right). The BME observed around 04:04:16 UT from kernel K1, which found associated with CME and type II radio bursts in time and velocity scales. On the other hand our observations reveal that the DME during their motion in the various flux tubes were getting detwisted indicating relaxation of magnetic field in the flaring region. The estimated speed of the DME was about 400 km sec-1, which was lower than the escape velocity in the chromosphere and thereby they were appearing moving in the flux tubes controlled under the magnetic force /8.
The flare studied here is unusual in the sense though it is compact and impulsive in all wavelengths but was associated with a fast CME and Type II radio bursts, which otherwise found in association to large eruptive or long duration event (LDE) type flares. Such flares ”confined but eruptive” (Moore, 1991) are of specific importance as they provide unique opportunity to understand the physical processes that operate for energy build-up and release impulsively following to a fast mass ejection. It appears that in the present flare a large scale restructuring was going on though the flare appeared as compact in size. We estimated the loop length between the EFR of opposite parasitic positive polarity and south following spot of about 104 km. It appears that as soon as the reconnection started the accelerated electrons reached to the foot points in a fraction of a second even if we consider the speed between 0.50.8c. On the other hand, as mentioned earlier, the reconnection rate was very high in view of fast speed of CME (Shibata, 1995, 1998, 2001), which made the flare most impulsive, and hence the electrons were moved fast in the loops directing towards the foot points where they produced bright kernels K1 and K2 through thermalization of their energy. The fast moving electrons produced non-thermal HXR emission during their passage in the loops by collision with the ambient material inside the lower corona and chromosphere. The strong MW emission observed in simultaneous with HXR and H strongly suggest that the same population of electrons might have produced them through gyrosynchrotron process. We estimated electron density above 1013 cm-3 that produced impulsive HXR, MW and H kernel K1. We interpret strong MW emission (Chandra et al., 2004) seen at K1 location because of significantly high magnetic field of the order of 500 gauss at EFR of north polarity at parasitic site as recently reported by Asai et al. (2002). This flare is a electron rich event showing narrow ejecta (St.Cyr et al., 2001) and classified as white light flare of class I (Liu et al., 2001)
The current impulsive flare event associated with CME appears to be explained better by unified model (Plasmoid-induced reconnection model) of solar flares by Shibata et al., (1995, 1998, 2001), breakout model of Antiochos (1998), Sterling (2001) and also by Tether-cutting model (Sturrock, 1989; Moore et al, 2001; Sterling and Moore, 2003).
5 CONCLUSION
NOAA AR 9368 appeared on 02 March 2001 as most simple type magnetic class region, which slowly became magnetically complex as a function of time. Several MMF of positive polarity were observed near following spots group of south dominating polarity and causing cancellation of magnetic field. It appears that magnetic field cancellation at following spot side as well as increasing shear was the basic physical process for energy build-up. The high shear, and hence the enhanced magnetic stress erupted the flare, which was associated with the CME through a shock produced by it. The fast passage of CME induced the reconnection, which in turn was responsible for the impulsive energy release as observed in the flare and associated HXR and MW emission. It seems that compact and confined impulsive flare associated with CME require continual appearance of opposite polarity emerging fluxes (MMF) and increasing shear for impulsive energy release.
Acknowledgements.
This work has been carried out under India Japan Cooperative Science Program (IJCSP), which is supported by Department of Science and Technology (DST), Govt. of India and Japan Society for Promotion of Science (JSPS). We express our sincere thanks to Prof. Satoshi Masuda, Prof. B. V. Somov and Prof. T. Sakurai for very useful discussions, which helped in the interpretations of our results. We are also thankful to the referee for constructive comments and suggestions.References
- Antiochos et al. (1998) Antiochos, S.K.: 1998, Astrophys. J. 502, L181.
- Asai et al. (2002) Asai, A., et al.: 2002, Astrophys. J. 578, L91.
- Brown et al. (1971) Brown, J. C.: 1971, Solar Phys. 18, 489.
- Bougeret et al. (1995) Bougeret, J.- L., et al.: 1995, Space Sci. Rev. 71, 231.
- Brueckner et al. (1995) Brueckner, G., et al.: 1995, Solar Phys. 162, 357.
- Chandra et al. (2004) Chandra et al.:2004, Under Preparation.
- Delaboudiniere et al. (1995) Delaboudiniere, J. - P., et al.: 1995, Solar Phys. 162, 291.
- Hudson et al. (1996) Hudson, H. S., Acton, L. W., and Freeland, S. L.: 1996, Astrophys. J. 470, 629.
- Kosovichew et al. (2001) Kosovichev, A. G. and Zharkova, V. V.: 2001, Astrophys. J. 550, L108.
- Kosugi et al. (1991) Kosugi, T. et al.: 1991, Solar Phys. 136, 17.
- Kundu et al. (2001) Kundu, M. R. and White, S. M.: 2001, Astrophys. J. 547, 1090.
- Kurokawa et al. (1987) Kurokawa, H.: 1987, Solar Phys. 113, 259.
- Lin et al. (1976) Lin, R. P. and Hudson, H. S.: 1976, Solar Phys. 113, 259.
- Litvinenko et al. (1999) Litvinenko, Y.E and Martin, S.: 1999, Solar Phys. 190, 45.
- Liu et al. (2001) Liu, Y., Ding, M. D. and Fang, C.: 2001, Astrophys. J. 563, L169.
- Martin et al. (1989) Martin, S.F.: 1989, Solar Phys. 121, 215.
- Miller et al. (1997) Miller, J. A. et al.: 1997, J. Geophys. Res. 102, 14631.
- Moore et al. (1991) Moore, R. L.: 1991, Flare Physics in Solar Activity Maximum 22, (Lecture Notes in Physics), Springer-Verlag, Berlin, p. 67.
- Moore et al. (2001) Moore, R. L. , Sterling, A. C., Hudson, H. S. and Lemen, J. R.:2001, Astrophys. J. 552, 833.
- Scherrer et al. (1995) Scherrer, P. H. et al.: 1995, Solar Phys. 162, 129.
- Shibata et al. (1995) Shibata, K.: 1995, Adv. Space Res. 17, (4/5)9.
- Shibata et al. (1998) Shibata, K.: 1998, in T.Watanabe, T.Kosugi, and A.C.Sterling (ed.), Observational Plasma Astrophysics: Five Years of Yohkoh and Beyond , Kluwer Academic Publ., p. 187.
- Shibata et al. (2001) Shibata, K. and Tanuma, S. 2001, Earth, Planets and Space 53, 473.
- St.Cyr et al. (2001) St.Cyr, O. C. et al.: 2001, American Geophy. Union, SH42A-0768.
- Sterling et al. (2003) Sterling, A. C. and Moore, R. L.: 2003, Astrophys. J. 599, 1418.
- Sterling et al. (2001) Sterling, A. C.: 2001, Astrophys. J. 561, 1116.
- Sturrock et al. (1989) Sturrock, P.A.: 1989, Solar Phys. 121, 387.
- Tsuneta et al. (1991) Tsuneta, S. et al.: 1991, Solar Phys. 136, 37.
- Uddin et al. (1986) Uddin, W., Pande, M. C. and Shelke, R. N.: 1986, Bull. Astron. Soc. India 14, 91.