Deep VLBI Imaging of Faint Radio Sources
in the NOAO Boötes Field
Abstract
We have conducted a deep, very long baseline interferometry (VLBI) observation at 1.4 GHz of an area of sky located within the NOAO Boötes field, using the NRAO Very Long Baseline Array and 100-m Green Bank Telescope. Applying wide-field VLBI techniques, a total of 61 sources, selected from a Westerbork Synthesis Radio Telescope (WSRT) image, were surveyed simultaneously with a range of different sensitivities and resolutions. The survey covered a total of 1017 arcmin2 0.28 deg2 divided into annular fields centered on 14h 29m 27.0s and 35°28′30.00″ (J2000). The inner 0-2′ of the field reached an unprecedented 1 rms noise level of Jy beam-1 and yielded two detections. VLBI J142923.6466 and VLBI J142934.7033 have brightness temperatures in excess K and locate the active nucleus of their host galaxies (NDWFS J142923.6352851 and NDWFS J142934.7352859 with and respectively). Further deep surveys of the inner 2-4′ and 4-6′ of the field, with 1 rms noise levels of 11-19 Jy beam-1, detected a previously known source, VLBI J142910.2224, a quasar with a brightness temperature in excess of K that was also used during these observations as an in-beam phase calibrator. The deep VLBI survey between 0′ and 6′ thus detected 3 radio sources, drawn from a total of 24 targets. A shallower VLBI survey, conducted between 6′ and 18′ of the field center, and with 1 rms noise levels of 37-55 Jy beam-1, detected a further 6 radio sources, drawn from 37 additional targets. Each of those 6 VLBI detections has a brightness temperature in excess of K; this hints that those 6 are accretion-powered, a suggestion reinforced by the double structure of 3 of them. Combining both the deep and shallow VLBI surveys, optical identifications are available for 8 of the 9 VLBI detections. Only VLBI J142906.6095 remains unidentified (), quite unusual as its integrated WSRT flux density is 20 mJy. Two other sources are not detected in K-band () suggesting that some significant fraction of these compact radio sources may be located at . The VLBI detection rate for sub-mJy WSRT radio sources is 8%. The VLBI detection rate for mJy WSRT sources is higher, 29%. This observational trend is expected from a rapidly evolving radio source population. Moreover, this trend supports deep radio surveys, at lower resolution, that infer the radio emission associated with fainter sub-mJy and microJy sources arises via processes associated with extended regions of star formation. The 9 VLBI detections reported here pin-point the precise location of active nuclei or candidate active nuclei, and their VLBI positions can help to anchor the NOAO Boötes field to the International Celestial Reference Frame. The simultaneous detection of several sub-mJy and mJy radio sources, in a single observation, suggest that their combined response may be used to self-calibrate wide-field VLBI data. There is every prospect that future deep VLBI observations can take advantage of this wide-field technique, in any random direction on the sky, thereby generating large-area, unbiased surveys of the faint radio source population.
1 Motivation
Evolutionary models of extragalactic radio sources (e.g., Condon, 1984) indicate that the overwhelming majority of sources with integrated flux densities in excess of mJy are typically identified with active galaxies, energised by accretion onto massive black holes. These bright sources have a median angular size of 5-10″ (e.g., Bondi et al., 2003; Condon et al., 2003) and are usually resolved by the VLA on arcsecond and sub-arcsecond scales. Often a significant fraction of the total radio emission resides within a compact and unresolved radio “core”, with a size measured on milliarcsecond (mas) and sub-mas scales using the techniques of very long baseline interferometry (VLBI).
Fainter sub-mJy and microJy radio sources have a higher probability of being energised by, and coextensive with, star formation in galaxies located at moderate redshifts (Richards, 2000; Smail et al., 2002). Garrett (2002) has shown that the bulk of these distant systems obey the locally derived (e.g., Condon, 1992) FIR-radio correlation. Indeed, only about 20% of the sub-mJy radio source population appears to be optically identified with active galaxies; a further 10% are optically faint sources with and are difficult to classify from their weak radio emission alone (Muxlow et al., 2004). MERLIN-VLA observations of faint radio sources in the HDF show that the microJy radio sources are resolved and typically sub-galactic in their overall extent, with typical measured sizes of 0.2-3 arcseconds (Muxlow et al., 2004). This is consistent with the analysis of Condon (1992), limiting the maximum brightness temperature of star forming galaxies to K at frequencies above 1 GHz.
A recent study conducted by Haiman et al. (2004) suggests that a significant fraction of the faint radio source population may be located at high redshift. At the level of 10 Jy they predict, in their simplest models, source surface densities of 10 deg-2 at . However, at these faint sensitivity levels it is increasingly difficult to identify radio-loud active galaxies from the dominant star forming radio source population, especially in the case of optically faint systems. High-resolution VLBI observations resolve out these extended star forming galaxies and, currently, any compact radio sources in these galaxies, such as luminous Type IIn SNe (e.g., Williams et al., 2002; Smith et al., 1998), would be too faint to detect at cosmological distances. On the other hand, VLBI is very well matched to detect the very compact radio emission associated with the relativistic outflows generated by accretion onto massive black holes in active galaxies.
High sensitivity VLBI observations, covering a large fraction of sky, thus provide a simple and direct method of identifying these faint, and possibly distant, radio-loud active galaxies. Free from the effects of dust obscuration, deep and wide-field VLBI studies can therefore contribute to the cosmic census of active galaxies (and their energising massive black holes), and together with redshift information, can potentially probe the accretion history of the early Universe. In addition, the positions of the compact VLBI detections can be measured very accurately, via the use of standard phase-referencing techniques. Astrometric precision at the mas level can be achieved routinely, and cross identification with sources detected at other wave-bands can anchor these non-radio observations to the International Celestial Reference Frame (ICRF). In crowded and deep fields, such precision astrometry may be useful in identifying the counterparts of faint or obscured sources at other wavelengths.
The observations presented here build on earlier wide-field VLBI studies of the Hubble Deep Field North (HDF-N), conducted by Garrett et al. (2001) using the European VLBI Network (EVN). Unlike traditional snapshot VLBI surveys, the wide-field approach permits many potential targets in the field to be imaged simultaneously, taking full advantage of the sensitivity and the coverage in the (u,v) plane associated with the total duration of the observations and the characteristics of the array. Using this observing strategy, it is possible to survey many sources (as in the case of snapshot observations) but with much greater sensitivity.
In this paper, we present the results of a deep VLBI survey that covers a region of 1017 arcmin2 0.28 deg2, surveying 61 potential sub-mJy and mJy radio source targets at angular resolution ranging from about 10 to 100 mas. For sources located at cosmological distances, the linear resolution corresponding to 10 mas is 90 pc or finer for a WMAP cosmology (Spergel et al., 2003). The VLBI observations and correlation are described in section 2, while section 3 describes the VLBI calibration and imaging. Definition of the VLBI survey fields, survey depths, and target-source selection appear in section 4. Results of the VLBI survey are presented in section 5 and discussed in section 6. The paper closes in section 7 with a synopsis of the future prospects for deep, wide-field VLBI surveys.
2 Observations and Correlation
2.1 VLBA+GBT Observations
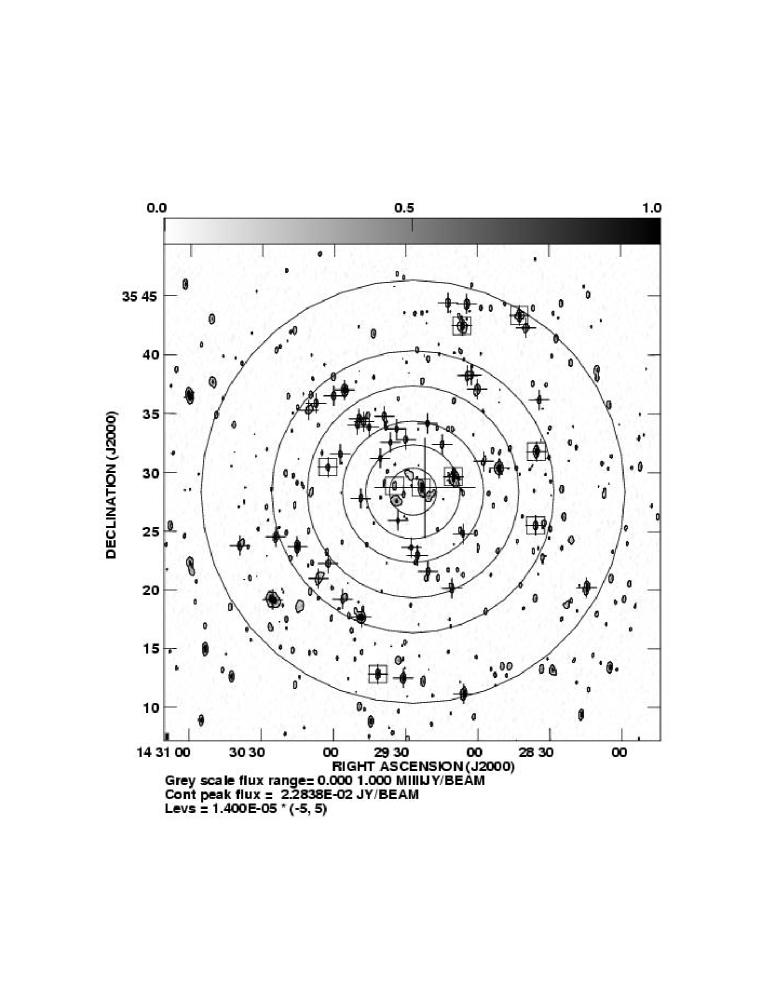
Observations at 1.4 GHz of a region of the NOAO-N Boötes field were made with the NRAO Very Long Baseline Array (VLBA) and Green Bank Telescope (GBT), recording at a data rate of 256 Mbit s-1 across a 64-MHz band. For descriptions of the VLBA and GBT, see Napier et al. (1994) and Jewell (2000), respectively. The observations spanned three 8-hour segments on 2002 August 3, 4, and 5 UT. The pointing position for the VLBI array was chosen as 14h 29m 22.0s and 35°28′50.00″ (J2000) and included an area of sky surveyed as part of an earlier VLBA snapshot survey of the region (Wrobel et al., 2004). In particular, with this pointing position, the compact 20-mJy source J142910.223352946.86 fell within the FWHM of the primary beam of all the antennas, including the 100-m GBT. Figure 1 presents the VLBA+GBT antenna pointing position and the in-beam calibrator, superimposed upon the Westerbork Synthesis Radio Telescope (WSRT) image of the field described in section 2.2.
A combination of nodding and in-beam phase referencing was employed (Wrobel et al., 2000),111Available at www.aoc.nrao.edu/vlba/html/MEMOS/scimemos.html., resulting in an integration time on the target field of 20 hours. J14263625 was used as the conventional phase calibrator and the VLBI astrometry reported in this paper assumes a position for this calibrator of 14h 26m 37.0874939s and 36°25′9.573930″ (J2000) in the ICRF (Extension 1) (IERS, 1999; Ma et al., 1998). Both the observations and correlation processing assumed a coordinate equinox of 2000. Two correlation passes were made within the GBT primary beam of FWHM 8.6′. One correlation pass was centered on the VLBA position of the in-beam calibrator J142910.223352946.86 given in Table 3. Another correlation pass was centered on 14h 29m 27.0s and 35°28′30.00″ (J2000), chosen because of the favorable number of potential targets that lay within a radial extent of 2′. The various VLBI survey fields introduced in section 4 are cast in terms of their radial extents with respect to this correlation phase center.
In order to reduce the effects of bandwidth and time smearing, and thus to image out as large a field of view as possible, the VLBA correlator generated data with 1024 spectral points per baseline and an integration time of 0.524 s. The VLBA station at Mauna Kea, HI, was omitted from the correlation process, due to the physical limitation on the total output data rate. With a correlator output data rate of 1 Mbyte s-1, a final data set size of 60 Gbytes was realised for each of the two correlator passes.
2.2 WSRT Observations
Previous WSRT observations of the Boötes field (de Vries et al., 2002) also encompassed the region of sky observed by the VLBA+GBT. In addition, a further 12-hour, 1.4-GHz observation of this particular region of the Boötes field was conducted (Morganti & Garrett, 2002), using the full 160 () MHz WSRT observing band and employing the default continuum frequency set-up (with the eight bands centered between 1.311 and 1.450 GHz). A short 20-minute scan on 3C 48 was used to initially calibrate the data. For each of the 8 bands, 64 spectral channels were generated (a total of 512 spectral points were obtained for the 160 MHz band) and 4 polarization products were recorded. The data were calibrated and images generated using the MIRIAD software package (Sault et al., 1995). The Morganti & Garrett (2002) WSRT image of the field, after primary beam correction, is shown in Figure 1. The image reaches a 1 rms noise level of Jy beam-1 in this area. The AIPS task JMFIT was used to determine the positions of regions of radio emission in the WSRT image, as well as their peak flux densities and integrated flux densities . WSRT sources that met the selection criteria defined in section 4 and Table 1 were added to the lists of potential target sources for the VLBA+GBT observations; those lists appear in Tables 2-7. The WSRT astrometry is typically accurate to . This estimate is consistent with the measured positions of the WSRT sources detected during the VLBA+GBT observations (see Tables 2-7). In Figure 1, the positions of potential radio source targets for the VLBA+GBT observations are indicated by a cross.
3 VLBI Calibration and Imaging
The data from the in-beam calibrator pass were edited, averaged, and calibrated in the NRAO AIPS package, and the gain parameters applied to the unaveraged, target-pass data. The response of the in-beam calibrator was also subtracted from the target (u,v) data. The AIPS task IMAGR was used to make naturally weighted dirty images and beams of the target regions selected from the WSRT image. Targets falling within a certain radial distance were imaged simultaneously using the multi-field option within IMAGR. Given the astrometric accuracy of the WSRT, together with the fact that many of the target sources may have extended radio structures on arcsecond scales, a large possible error between the WSRT and VLBI positions was assumed: each dirty image therefore subtended a square of at least 6″ on a side. For each target, three such dirty images were made, corresponding to the three epochs of observation. The three images for each target source were then simply co-added (averaged) to form the final target image. We estimate that the survey analysis required two orders of magnitude more processing power and disk storage requirements than a typical (single target) VLBI observation. The amount of processing power required does not only depend on the data set size (e.g. 120 Gbytes of data for this observation c.f. Gbyte for a typical VLBI continnum observation) but also the number of target images that must be generated ( target images in this experiment c.f. 1 target image for typical VLBI experiments).
The largest VLBI images of the targets contained about 400,000 synthesized-beam areas. Hence, the chances of misidentifying a random noise spike as a real detection are significant. In order to avoid spurious detections, the dirty images of the target regions were inspected for valid sources using a conservative 6 detection threshold. Most of the sources we detected lie well above this threshold and were therefore bright enough to benefit from the application of the CLEAN deconvolution algorithm. Cleaned images were produced using the AIPS task APCLN. Visibility-based cleaning is currently prohibitively expensive in terms of computing requirements.
4 Survey Fields, Survey Depths, and Source Selection
We split the survey into 6 separate fields, demarcated by increasing radial distance from the correlation phase center. These are referred to as the 0-2′, 2-4′, 4-6′, 6-9′, 9-12′, and 12-18′ survey fields. We also refer to deep and shallow survey fields. The deep survey fields (0-2′, 2-4′ and 4-6′) attains 1 rms noise levels of 9-19 Jy beam-1, significantly better than the Jy beam-1 for a typical 8-hour VLBA observation. The shallow survey field (6-9′, 9-12′ and 12-18′) attains 1 rms noise levels of 37-55 Jy beam-1, comparable with a typical 8-hour VLBA observation. The measured noise levels are in good agreement with those expected from thermal noise considerations.
Our survey attempts to detect sources at large radial distances from the antenna pointing position and the correlation phase center. The fall-off of the response of the primary beam is one effect that limits the depth of each survey field. In addition, the effect of employing a restricted (u,v) range in most survey fields, in order to reduce the effect of bandwidth and time smearing, leads to a noise level that also increases with radial distance from the correlation phase center.
In particular, the reduced response in the VLBA+GBT images presented here is composed of 4 independent components: the GBT primary beam response (), the VLBA primary beam response () and the reduced response due to time and bandwidth smearing effects (, ). The combined reduced response, , is given by:
| (1) |
The GBT only contributes to the 0-2′ and 2-4′ surveys, due to the sharp fall off of the primary beam response beyond its half-power point. For the 4-6′, 6-9′, 9-12′, and 12-18′ survey fields, the reduced response is given by:
| (2) |
We have estimated and following Bridle & Schwab (1999). For the VLBA 25-m antennas, a fiducial estimate of the primary beam at FWHM is 29′, but a functional form for the measured primary beam response is not available. Since the primary beam response of the VLBA 25-m antennas is expected to be similar to that for the VLA 25-m antennas, we have adopted for the VLBA antennas the fitted function documented in the AIPS task PBCOR to model the response of the VLA primary beam. For the GBT, we have assumed a pure Gaussian response (F. Ghigo, 2004, private communication) with a FWHM of 8.6′. In Table 1, we calculate the total response at the outer edge of each of the main survey fields. For the naturally weighted images associated with the inner 0-2′ and 2-4′ survey regions, we assume that the longest GBT baseline (3326 km to the VLBA station at Brewster, WA), is the appropriate limiting factor for the time and bandwidth smearing response.
For any given region we selected target sources with measured peak flux densities in the WSRT image, , that satisfied the following constraint:
| (3) |
Details of the properties of the various survey fields, including the survey depth, are presented in Table 1. The quoted survey depth is conservative, in the sense that the value of is determined from the maximum radial extent encompassed by each survey field; and for the 4-6′, 6-9′, 9-12′, and 12-18′ fields, from the maximum contributing baseline of the VLBI array. The deep survey is capable of detecting sub-mJy radio sources over its full extent of 254 arcmin2 0.07 deg2. The shallower and lower-resolution survey covers an additional 763 arcmin2 0.21 deg2 of sky, targeting the brighter sub-mJy and mJy radio sources in the field. The resolution at FWHM of the deep and shallow surveys range between 7 and 26 mas, and 27 and 115 mas, respectively.
5 Results
Details of the target sources and VLBI detections are presented in Tables 2-7 for the various deep and shallow fields. The WSRT flux densities are corrected for primary beam attenuation and the absolute flux density scale is estimated to be better than 2%. The absolute flux density scale of the VLBI observations are expected to be better than 5%. The VLBI flux densities have not been corrected for primary beam attenuation, the correction factors scale as as detailed in Table 1 for the various survey regions. We estimate the error in VLBI positions in the 0-2′, 2-4′& 4-6′ fields to be set by errors introduced by the ionosphere. With a separation of 1.2°between our primary phase reference and the target fields, we estimate an error of mas in each coordinate. In fact we measure a mas offset in each coordinate between the 1.4 GHz position for the in-beam phase reference VLBI J142910.2224 (target 11) presented in this paper, and the 5 GHz position for the same source measured by Wrobel et al. (2004). This offset is consistent with our estimated absolute VLBI position error, given that the source is likely to present slightly different radio source structures at 1.4 and 5 GHz. In the (heavily tapered) lower-resolution 6-9′, 9-12′& 12-18′ fields, r.m.s. noise errors limit the positional accuracy. Since all sources are detected above a detection threshold, the error in each coordinate for these outer fields is expected to be better than mas for the 6-9 arcmin field, and mas in the 9-12′& 12-18′, outer fields.
5.1 The Deep 0-2′ Survey
The 0-2′ survey is the deepest one listed in Table 1, since there are no restrictions on the (u,v) data used to produce VLBI images of the targets. For this survey field we identified 10 potential target regions with peak flux densities Jy (Table 2). Eight of the target regions showed no positive (or negative) peaks above (or below) the 6 detection threshold. Two of the target regions contained positive peaks at the 34 and 31 level. These are Target 3 and Target 10, discussed below. Naturally-weighted images of these VLBI detections are shown in Figures 2 and 3. Figures 4 and 5 present uniformly weighted images of the same sources (robustness -4). In order to maximise our chances of detecting extended VLBI sources, images of all 10 targets were made at lower resolution, using reduced (u,v) ranges from zero to 12M, 6M, and 3M. No additional targets were detected, nor was extended emission detected from Target 3 or Target 10.
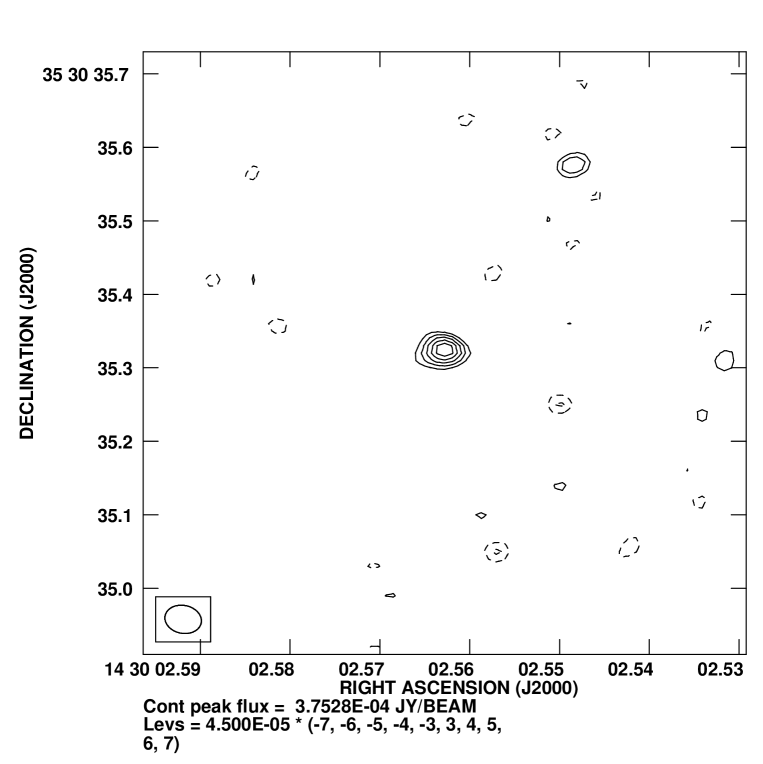
5.1.1 Target 3. mJy
VLBI J142923.6466 locates the active nucleus within the optical host, NDWFS J142923.6352851, an elliptical galaxy with total and (Jannuzi et al., 2004). Figure 2 was analysed with AIPS task JMFIT to yield the position, peak flux density , and integrated flux density entered in Table 2. Since mJy, less than ten percent of the integrated WSRT flux density has been recovered. A lower limit for the brightness temperature of the VLBI component of the source is K, suggesting this WSRT source is probably a radio galaxy. Assuming the strong correlation between K-band magnitude and the redshift of luminous radio galaxies also applies to fainter, less luminous systems (the relation e.g. Jarvis et al. (2001)), we estimate for this source. At this redshift 10 mas corresponds to 33 pc.
5.1.2 Target 10. mJy
Figure 5 shows that VLBI J142934.7033 is resolved into a double separated by about 5 mas. The integrated flux density is mJy (Fig. 3, Table 2), so most of the integrated WSRT flux density has been recovered. A lower limit for the brightness temperature of the VLBI component of the source is K. Moreover, this north-south double is misaligned with its east-west host galaxy, NDWFS J142934.7352859, which has a total and (Jannuzi et al., 2004). This radio-optical misalignment strongly suggest that this sub-mJy WSRT source is energised by a black hole rather than by star formation. Assuming the relation applies, we estimate , for which 10 mas corresponds to 67 pc.
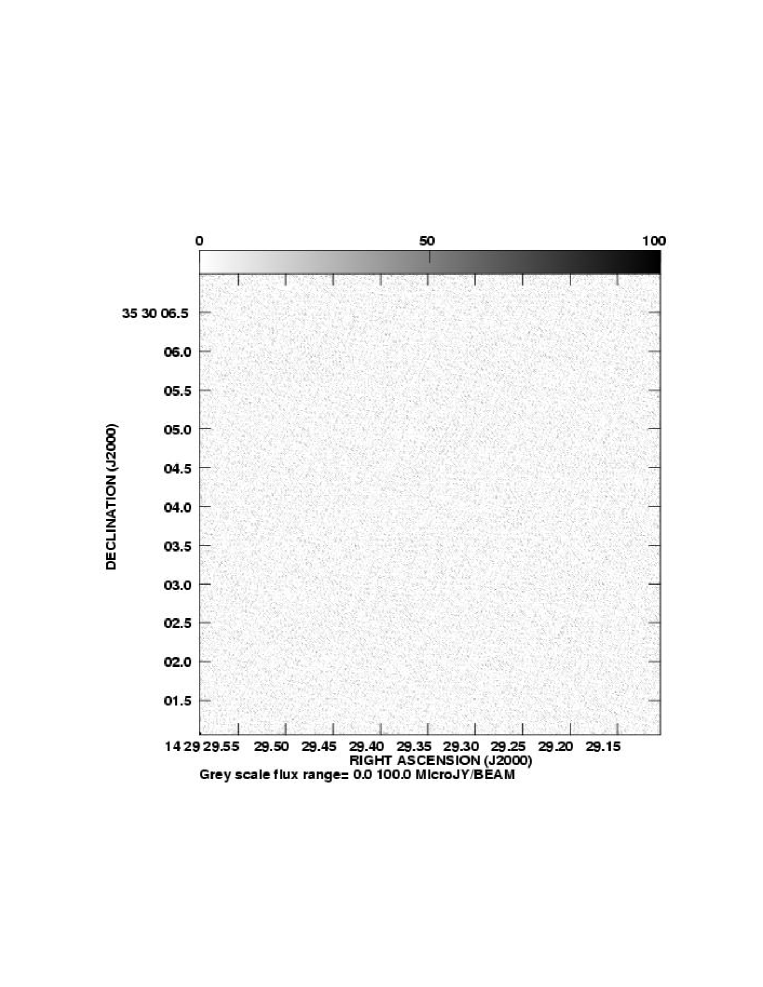
5.1.3 Target 9. mJy
One of the brightest potential targets in the 0-2′ survey region, this WSRT source is identified with the disk galaxy NGC 5646 at (de Vries et al., 2002). This target is not detected with VLBI at resolutions of 10-100 mas ( 6-60 pc). Figure 6 presents the full resolution image of the central NGC 5646 target region. Indeed, for this source, several regions each spanning 6″ ( kpc) on a side, were placed across the extended WSRT source, in case luminous SNe or SNR might be detectable. This VLBI non-detection, together with the fact that the WSRT emission follows the optical isophotes (Morganti & Garrett, 2002) and obeys the FIR-radio correlation Condon et al. (2002), strongly supports a star formation origin for this mJy WSRT source.
5.2 The Deep 2-4′ Survey
Within the 2-4′ survey field, we formally identified 3 potential targets with WSRT peak flux densities in excess of mJy (Table 3). Two of the target regions showed no positive (or negative) peaks above (or below) the 6 detection threshold. The remaining target, Target 11, is discussed below. Lower resolution images were made of all 3 targets, using reduced (u,v) ranges from zero to 6M and 3M. No additional source detections were made and no extended emission (from Target 11) was detected.
5.2.1 Target 11. mJy
VLBI J142910.2224 has previously been detected by Wrobel et al. (2004), who validated its suitability as an in-beam calibrator for this study. The naturally weighted image of the source, obtained via the initial data analysis of one of the three VLBI observations, recovers essentially all of the integrated WSRT flux density (Fig. 7, Table 3). Identified as a quasar of unknown redshift, VLBI J142910.2224 is identified with NDWFS J142910.2352946 () (Jannuzi et al., 2004). A lower limit for the brightness temperature of the VLBI component of the source is K. This mJy WSRT source must be dominantly energised by a super-massive black hole.
5.3 The Deep 4-6′ Survey
Within the 6-12′ survey field, we identified 11 potential targets with peak flux densities in excess of mJy (Table 4). None of the 11 target regions showed positive (or negative) peaks above (or below) the 6 detection threshold. Lower resolution images were also made of the target regions, using reduced (u,v) ranges from zero to 6M and 3M, but no targets were detected.
5.4 The Shallow 6-9′ Survey
Within the 6-9′ survey field, we identified 9 potential targets with peak flux densities in excess of mJy (Table 5). Eight of the target regions showed no positive (or negative) peaks above (or below) the 6 detection threshold. Only one target, Target 33, contained a positive peak at the 7 level.
5.4.1 Target 33. mJy
VLBI J143002.5631 is not resolved and has an integrated flux density mJy (Fig. 8, Table 2), recovering all of the integrated WSRT flux density. The host galaxy NDWFS J143002.5353035 has a total and , and may have a blue companion to the south-west (Jannuzi et al., 2004). A lower limit for the brightness temperature of the VLBI component of the source is K. If this sub-mJy WSRT source is a radio galaxy, then the relation suggests , for which 10 mas corresponds to 75 pc.
5.5 The Shallow 9-12′ Survey
Within the 9-12′ survey field, we identified 17 potential targets with peak flux densities in excess of mJy (Table 6). Fifteen of the target regions showed no positive (or negative) peaks above (or below) the 6 detection threshold. Two of the target regions contained positive peaks at levels of 13 for Target 34 and 8 for Target 35. Both are discussed below.
5.5.1 Target 34. mJy
VLBI J142835.5389 is resolved into a double with a combined flux density of mJy (Fig. 9, Table 6). More than 30% of the the integrated WSRT flux density has been recovered. The host galaxy NDWFS J142835.5353154 has a total (Jannuzi et al., 2004). The source is not detected in K-band ( for a 50% completeness limit) suggesting it may be located at . A lower limit for the brightness temperature of the VLBI component of the source is K suggesting that this mJy WSRT source is probably a radio galaxy.
5.5.2 Target 35. mJy
VLBI J142835.9570 is not resolved and has an integrated flux density mJy (Fig. 10, Table 6) that recovers at least 40% of the integrated WSRT flux density. A lower limit for the brightness temperature of the VLBI component of the source is K. The host galaxy NDWFS J142835.9352537 has a total and (Jannuzi et al., 2004). If this sub-mJy WSRT source is a radio galaxy, then the relation suggests .
5.6 The Shallow 12-18′ Survey
Within the 12-18′ survey field, we identified 17 potential targets with peak flux densities in excess of mJy (Table 7). Fourteen of the target regions showed no positive (or negative) peaks above (or below) the 6 detection threshold. Three of the target regions contained positive peaks at levels of 18 (Target 52), 18 (Target 55), and 6 (Target 58), and are discussed below.
5.6.1 Target 52. mJy
Figure 11 shows that VLBI J142842.5476 is resolved into a double. With mJy (Fig. 11, Table 7), at least half of the integrated WSRT flux density has been recovered. A lower limit for the brightness temperature of the VLBI component of the source is K. Moreover, this double is misaligned with its elongated host galaxy, NDWFS J142842.5354327, which has a total and (Jannuzi et al., 2004). This radio-optical misalignment strongly suggests that this mJy WSRT source is energised by a black hole rather than by star formation. The relation would then suggest .
5.6.2 Target 55. mJy
Figure 12 presents VLBI J142906.6095. With mJy (Fig. 12, Table 7), much of the integrated WSRT flux density is recovered. A lower limit for the brightness temperature of the VLBI component of the source is K. The optical counterpart must be fainter than (Brown et al., 2003; Jannuzi et al., 2004), quite unusual for such a strong radio source. There is no detection at K-band () suggesting the source may be located at .
5.6.3 Target 58. mJy
Figure 13 shows that VLBI J142941.6843 is resolved into a double. With mJy (Fig. 13, Table 7). A lower limit for the brightness temperature of the VLBI component of the source is K. A candidate host galaxy, NDWFS J142941.8351257, has a total (Jannuzi et al., 2004). There is no detection at K-band () suggesting the source may be located at .
6 Discussion
This paper presents the first attempt to characterise the sub-mJy and mJy radio source population at mas resolutions. A total of 61 potential targets were selected based on their peak WSRT flux densities, and 9 were detected at or above the 6 rms noise level in the VLBI images. Most of the sources are probably located at moderate redshifts () but the non-detection of two objects in K-band and one object in both I and K-band, suggests some significant fraction of these faint, compact sources may be located at . Our observations suggests that the percentage of mJy and sub-mJy radio sources that are powered by black-hole accretion processes in this Boötes field is, at least, 155%. Only 3 sub-mJy WSRT sources (VLBI J142934.7033, J143002.5631, and J142835.5389) are detected out of a total of 40 potential sub-mJy targets, implying a detection rate of 8%. The detection rate is higher for mJy WSRT sources: 6 sources are detected out of a total of 21 potential mJy targets, for a detection rate of 29%.
The disappointing detection rate in the sub-mJy radio source population serves to reinforce the rapid evolution that is believed to be taking place in the radio source population at these faint mJy and sub-mJy flux density levels (Muxlow et al., 2004). However, the detection rate reported here is probably further affected by resolution effects. Several of the sub-mJy sources in our sample are likely to be partially, rather than fully resolved. In these cases, compact structure associated with an active nucleus may be missed by our survey if it falls below our 6 detection threshold. Our detection rate of about 8% for sub-mJy sources is, therefore, very much a lower-limit on the fraction of sub-mJy sources with active nuclei.
The morphology of the sources detected also confirms previously observed trends for brighter sources to exhibit radio structure on much larger scales than fainter sources. This can be understood in terms of synchrotron-self-absorption theory, wherein the overall radio source size is proportional to the square root of the peak flux density (e.g., Snellen et al., 2000).
7 Future Prospects
EVN observations of the HDF-N (Garrett et al., 2001), plus the new VLBA+GBT VLBI observations presented here, demonstrate that deep, wide-field VLBI surveys can now be conducted on largely random areas of sky. In particular, at the single-figure r.m.s. noise levels demonstrated here, many sources can be detected simultaneously within the primary beam of individual VLBI antennas. This opens up the possibility of embarking on large-area, unbiased, high-resolution surveys of the sub-mJy and mJy radio source population. In addition, at frequencies of a few GHz, the combined response of the sources detected in such wide-field analyses should always be sufficient to permit self-calibration techniques to be utilized, irrespective of where the VLBI antennas are pointing.
Further important technical developments in this field are imminent. Fast data output rates are being implemented in the EVN correlator at JIVE and will permit wide-field, global VLBI studies to be conducted with reduced losses associated with time and bandwidth smearing. The resulting data sets will be extrememly large, typically Terrabyte. Fortunately the basic calibration data (e.g. phase corrections via external calibrators) will be possible via averaged (smaller) data sets. The full-beam calibration technique however, requires processing of the full (un-averaged) data set and would currently require the data to be split-up into smaller chunks (time-ranges) and the self-calibration process spread over multiple computer processors. A similar requirement is necessary for target imaging, though in this case the data can be split-up both in the time & frequency domain. Such parallel data processing is well-suited to emerging computer hardware, such as Linux-based PC clusters.
These developments, together with the wide-spread adoption of the Mark 5 recording system by the major VLBI networks (Whitney, 2003), should permit global, wide-field surveys to reach 1 rms noise levels of Jy beam-1. At these levels of sensitivity, a much more comprehensive census of active galaxies associated with sub-mJy radio sources will be possible, including studies of the optically faint microJy radio source population. At microJy noise levels, radio-loud active galaxies are detectable at the very earliest cosmic epochs, when the first active galaxies and their energising massive black holes began to form. Certainly with these new capabilities in place, it will be very interesting to see if the apparent low detection rate of sub-mJy radio sources continues to be observed at Jy beam-1 noise levels. Such an effect might be expected if black holes less massive than M⊙ are rare and/or produce less radio emission than more massive systems (Haiman et al., 2004).
References
- Bondi et al. (2003) Bondi, M., et al. 2003, A&A, 403, 857
- Bridle & Schwab (1999) Bridle, A. H. & Schwab, F. R. 1999, in ASP Conf. Ser. Vol. 180, Synthesis Imaging in Radio Astronomy II, ed. G. B. Taylor, C. L. Carilli, & R. A. Perley (San Francisco: ASP), 371
- Brown et al. (2003) Brown, M. J. I, Dey, A., Jannuzi, B. T., Lauer, T. R., Tiede, G. P., & Mikles, V. J. 2003, ApJ, 597, 225
- Condon (1984) Condon, J. J. 1984, ApJ, 284, 44
- Condon (1992) Condon, J. J. 1992, ARA&A, 30, 575
- Condon et al. (2002) Condon, J. J., Cotton, W. D., & Broderick, J. J. 2002, AJ, 124, 675
- Condon et al. (2003) Condon, J. J., Cotton, W. D., Yin, Q. F., Shupe, D. L., Storrie-Lombardi, L. J., Helou, G., Soifer, B. T., Werner, M. W. 2003, AJ, 125, 2411
- de Vries et al. (2002) de Vries, W. H., Morganti, R., Röttgering, H. J. A., Vermuellen, R., van Breugel, W., Rengelink, R., & Jarvis, M. J. 2002, AJ, 123, 1784
- Garrett et al. (2001) Garrett, M. A., et al. 2001, A&A, 366, L5
- Garrett (2002) Garrett, M. A., 2002, A&A, 384, L19
- Garrett (2003) Garrett, M. A. 2003, New Technologies in VLBI, ed. Y. C. Minh, ASP Conference Series, 306, 123.
- Haiman et al. (2004) Haiman, Z., Quataert, E. & Bower, G. C., 2004, ApJ, 612, 698
- IERS (1999) IERS. 1999, 1998 Annual Report, ed. D. Gambis (Paris: Obs. Paris), 87
- Ivezić et al. (2002) Ivezić, Z̆. et al. 2002, AJ, 124, 2364
- Jannuzi et al. (2004) Jannuzi, B. T., et al. 2004, ApJ, submitted
- Jarvis et al. (2001) Jarvis, M. J., Rawlings, S., Eales, S., Blundell, K. M., Bunder, A. J., Croft, S., Mclure, R. J., & Willott, C. J. 2001, MNRAS, 326, 1585
- Jewell (2000) Jewell, P. R., 2000, Radio Telescopes, Proc. SPIE, 4015, 136
- Ma et al. (1998) Ma, C., et al. 1998, AJ, 116, 516
- Morganti & Garrett (2002) Morganti, R., & Garrett, M. A. 2002, ASTRON Newsletter, No. 17 (http://www.astron.nl/astron/newsletter/2002-1/)
- Muxlow et al. (2004) Muxlow, T. W. B., et al. 2004, MNRASsubmitted.
- Napier et al. (1994) Napier, P. J., Bagri, D. S., Clark, B. G., Rogers, A. E. E., Romney, J. D., Thompson, A. R., & Walker, R. C. 1994, Proc. IEEE, 82, 658
- Richards (2000) Richards, E. J. 2000, ApJ, 533, 611
- Sault et al. (1995) Sault, R. J, Teuben, P. J., & Wright, M. C. H. 1995, in ASP Conf. Ser. 77, Astronomical Data Analysis Software and Systems IV, ed. R. A. Shaw, H. E. Payne & J. J. E. Hayes (San Francisco: ASP), 433.
- Smail et al. (2002) Smail, I., Owen, F. N., Morrison, G. E., Keel, W. C., Ivison, R. J., & Ledlow, M. J. 2002, ApJ, 581, 844
- Smith et al. (1998) Smith, H. E., Lonsdale, C. J., Lonsdale, C. J., & Diamond, P. J. 1998, ApJ, 493, 17
- Snellen et al. (2000) Snellen, I. A. G., Schilizzi, R. T., Miley, G. K., de Bruyn, A. G., Bremer, M. N. & Rottgering, H. J. A. 2000, MNRAS, 319, 445
- Spergel et al. (2003) Spergel, D. N., et al. 2003, ApJS, 148, 175
- Whitney (2003) Whitney, A. R. 2003, New Technologies for VLBI, ed. Y.C. Minh, ASP Conference Series, 306, 123.
- Williams et al. (2002) Williams, C. L., Panagia, N., Van Dyk, S. D., Lacey, C. K., Weiler, K. W., & Sramek, R. A. 2002, 581, 396
- Wrobel et al. (2000) Wrobel, J. M., Walker, R. C., Benson, J. M., & Beasley, A. J. 2000, VLBA Scientific Memo 24
- Wrobel et al. (2004) Wrobel, J. M., Rector, T. A., Taylor, G. B., Myers, S. T., & Fassnacht, C. D. 2004, Future Directions in High Resolution Astronomy: The 10th Anniversary of the VLBA, ed. J. D. Romney & M. J. Reid (San Francisco: ASP) (astro-ph/0403643)


| Maximum | Maximum | 1 rms | Survey | |||
|---|---|---|---|---|---|---|
| Survey | Radial Distance | (u,v) Range | Response | Noise | Resolution | |
| Field | (′) | (M) | (Jy beam-1) | (mas, mas) | (mJy beam-1) | |
| (1) | (2) | (3) | (4) | (5) | (6) | (7) |
| 0-2′ | 2 | 24 | 0.73 | 9 | ||
| 2-4′ | 4 | 12 | 0.47 | 11 | ||
| 4-6′ | 6 | 8 | 0.75 | 19 | ||
| 6-9′ | 9 | 6 | 0.62 | 37 | ||
| 9-12′ | 12 | 4 | 0.52 | 45 | ||
| 12-18′ | 18 | 3 | 0.27 | 55 |
| Right Ascension | Declination | ||||
|---|---|---|---|---|---|
| Target | (J2000) | (J2000) | (mJy beam-1) | (mJy) | () |
| (1) | (2) | (3) | (4) | (5) | (6) |
| 1 | 14 29 18.545 | 35 28 21.04 | |||
| 2 | 14 29 20.493 | 35 28 00.79 | |||
| 3 | 14 29 23.541 | 35 28 52.08 | |||
| 14 29 23.6466 | 35 28 51.431 | 0.3980.009 | 0.4610.018 | 0.008 | |
| 4 | 14 29 25.367 | 35 29 38.73 | |||
| 5 | 14 29 27.600 | 35 29 50.68 | |||
| 6 | 14 29 27.627 | 35 29 03.00 | |||
| 7 | 14 29 29.348 | 35 30 04.03 | |||
| 8 | 14 29 30.865 | 35 28 16.57 | |||
| 9 | 14 29 33.952 | 35 27 42.55 | |||
| 10 | 14 29 34.632 | 35 28 59.50 | |||
| 14 29 34.7033 | 35 28 59.361 | 0.3440.009 | 0.4550.019 | 0.010 |
Note. — Units of right ascension are hours, minutes, and seconds, and units of declination are degrees, arcminutes, and arcseconds. The first data entry for each target source refers to the WSRT image and the second entry, when present, refers to the VLBI image.
| Right Ascension | Declination | ||||
|---|---|---|---|---|---|
| Target | (J2000) | (J2000) | (mJy beam-1) | (mJy) | () |
| (1) | (2) | (3) | (4) | (5) | (6) |
| 11 | 14 29 10.130 | 35 29 46.13 | |||
| 14 29 10.2224 | 35 29 46.893 | 0.024 | |||
| 12 | 14 29 33.273 | 35 26 03.20 | |||
| 13 | 14 29 40.683 | 35 31 20.15 |
Note. — Units of right ascension are hours, minutes, and seconds, and units of declination are degrees, arcminutes, and arcseconds. The first data entry for each target source refers to the WSRT image and the second entry, when present, refers to the VLBI image.
| Right Ascension | Declination | ||||
|---|---|---|---|---|---|
| Target | (J2000) | (J2000) | (mJy beam-1) | (mJy) | () |
| (1) | (2) | (3) | (4) | (5) | (6) |
| 14 | 14 29 06.132 | 35 24 55.09 | |||
| 15 | 14 29 14.758 | 35 32 31.50 | |||
| 16 | 14 29 20.941 | 35 34 18.13 | |||
| 17 | 14 29 25.171 | 35 23 04.67 | |||
| 18 | 14 29 25.178 | 35 23 04.91 | |||
| 19 | 14 29 27.698 | 35 23 45.31 | |||
| 20 | 14 29 30.045 | 35 32 55.74 | |||
| 21 | 14 29 33.869 | 35 33 50.16 | |||
| 22 | 14 29 36.400 | 35 32 41.50 | |||
| 23 | 14 29 45.319 | 35 33 59.07 | |||
| 24 | 14 29 48.777 | 35 27 55.01 |
Note. — Units of right ascension are hours, minutes, and seconds, and units of declination are degrees, arcminutes, and arcseconds. The first data entry for each target source refers to the WSRT image and the second entry, when present, refers to the VLBI image.
| Right Ascension | Declination | ||||
|---|---|---|---|---|---|
| Target | (J2000) | (J2000) | (mJy beam-1) | (mJy) | () |
| (1) | (2) | (3) | (4) | (5) | (6) |
| 25 | 14 28 50.931 | 35 30 28.97 | |||
| 26 | 14 29 10.769 | 35 20 16.94 | |||
| 27 | 14 29 38.981 | 35 34 53.02 | |||
| 28 | 14 29 47.538 | 35 34 27.31 | |||
| 29 | 14 29 49.542 | 35 34 41.43 | |||
| 30 | 14 29 50.247 | 35 34 11.09 | |||
| 31 | 14 29 57.320 | 35 31 41.34 | |||
| 32 | 14 29 57.428 | 35 31 04.90 | |||
| 33 | 14 30 02.494 | 35 30 34.66 | |||
| 14 30 02.5631 | 35 30 35.323 |
Note. — Units of right ascension are hours, minutes, and seconds, and units of declination are degrees, arcminutes, and arcseconds. The first data entry for each target source refers to the WSRT image and the second entry, when present, refers to the VLBI image.
| Right Ascension | Declination | ||||
|---|---|---|---|---|---|
| Target | (J2000) | (J2000) | (mJy beam-1) | (mJy) | () |
| (1) | (2) | (3) | (4) | (5) | (6) |
| 34 | 14 28 35.444 | 35 31 53.34 | |||
| 14 28 35.5359 | 35 31 54.114 | ||||
| 14 28 35.5389 | 35 31 54.160 | ||||
| 35 | 14 28 35.858 | 35 25 36.64 | |||
| 14 28 35.9570 | 35 25 37.685 | ||||
| 36 | 14 29 00.076 | 35 37 11.30 | |||
| 37 | 14 29 02.588 | 35 38 24.88 | |||
| 38 | 14 29 04.128 | 35 38 21.36 | |||
| 39 | 14 29 20.670 | 35 21 43.80 | |||
| 40 | 14 29 48.525 | 35 17 47.08 | |||
| 41 | 14 29 55.571 | 35 37 06.92 | |||
| 42 | 14 29 56.252 | 35 19 20.17 | |||
| 43 | 14 30 00.129 | 35 36 38.07 | |||
| 44 | 14 30 02.362 | 35 22 22.85 | |||
| 45 | 14 30 06.389 | 35 21 04.45 | |||
| 46 | 14 30 07.560 | 35 35 59.62 | |||
| 47 | 14 30 10.649 | 35 35 25.21 | |||
| 48 | 14 30 15.192 | 35 23 47.45 |
Note. — Units of right ascension are hours, minutes, and seconds, and units of declination are degrees, arcminutes, and arcseconds. The first data entry for each target source refers to the WSRT image and the second entry, when present, refers to the VLBI image.
| Right Ascension | Declination | ||||
|---|---|---|---|---|---|
| Target | (J2000) | (J2000) | (mJy beam-1) | (mJy) | () |
| (1) | (2) | (3) | (4) | (5) | (6) |
| 49 | 14 28 14.636 | 35 20 15.98 | |||
| 50 | 14 28 34.192 | 35 36 16.86 | |||
| 51 | 14 28 39.791 | 35 42 23.14 | |||
| 52 | 14 28 42.457 | 35 43 26.15 | |||
| 14 28 42.5476 | 35 43 27.053 | ||||
| 53 | 14 29 04.519 | 35 44 24.60 | |||
| 54 | 14 29 05.907 | 35 11 14.99 | |||
| 55 | 14 29 06.517 | 35 42 34.16 | |||
| 14 29 06.6095 | 35 42 35.012 | ||||
| 56 | 14 29 12.314 | 35 44 29.88 | |||
| 57 | 14 29 30.993 | 35 12 36.75 | |||
| 58 | 14 29 41.602 | 35 12 56.73 | |||
| 14 29 41.6843 | 35 12 57.189 | ||||
| 59 | 14 30 24.204 | 35 24 37.12 | |||
| 60 | 14 30 25.477 | 35 19 15.21 | |||
| 61 | 14 30 39.112 | 35 23 50.76 |
Note. — Units of right ascension are hours, minutes, and seconds, and units of declination are degrees, arcminutes, and arcseconds. The first data entry for each target source refers to the WSRT image and the second entry, when present, refers to the VLBI image.