11email: jurcsik@konkoly.hu 22institutetext: Eötvös Loránd University, Department of Astronomy, P.O. Box 32, H-1518 Budapest, Hungary 33institutetext: Department of Experimental Physics and Astronomical Observatory, University of Szeged, H-6720 Szeged, Dóm tér 9, Hungary 44institutetext: Astrophysikalisches Institut Potsdam, An der Sternwarte 16, 14482 Potsdam, Germany
The Blazhko behaviour of RR Geminorum I
Extended CCD monitoring of RR Gem revealed that it is a Blazhko type RRab star with the shortest Blazhko period () and smallest modulation amplitude ( mag) currently known. The short period of the modulation cycle enabled us to obtain complete phase coverage of the pulsation at each phase of the modulation. This is the first multicolour observation of a Blazhko star which is extended enough to define accurate mean magnitudes and colours of the variable at different Blazhko phases. Small, but real, changes in the intensity mean colours at different Blazhko phases have been detected. The Fourier analysis of the light curves shows that, in spite of the mmag and smaller order of the amplitudes, the triplet structure is noticeable up to about the 14th harmonic. The modulation is concentrated to a very narrow, 0.2 phase range of the pulsation, centred on the supposed onset of the H emission during rising light. These observational results raise further complications for theoretical explanation of the long known but poorly understood Blazhko phenomenon.
Key Words.:
Stars: individual: RR~Gem – Stars: variables: RR Lyr – Stars: oscillations – Stars: horizontal-branch – Techniques: photometric –1 Introduction
Most RR Lyrae stars repeat their light curves with remarkable regularity. About 30% of the known galactic RR Lyrae stars, however, display cyclic modulation in the shape and amplitude of the light curve over tens to thousands of pulsational cycles (Smith, 1995). The phenomenon is often called the Blazhko effect since Blazhko (1907) was the first to recognize that the light maximum of an RR Lyrae star (namely RW~Dra) showed phase modulation on a long time-scale (around 42 days).
In several well-studied RR Lyrae stars, the amplitude and the period of the Blazhko effect has been observed to be variable on a time-scale of years (Szeidl, 1988; Smith et al., 1999; LaCluyzé et al., 2004). In this respect RR~Geminorum provides a very interesting case. Detre (1970) remarked that his unpublished photographic observations from the 1930s demonstrated the Blazhko effect in RR~Gem, but (in his words) it ‘ceased to exist since about 1940.’ That the Blazhko effect might be temporary in nature may be crucial in understanding the physical background of the phenomenon. Therefore we decided to begin an intensive photometric investigation of the star.
RR~Gem (, J2000) was discovered by L. P. Ceraski (Ceraski, 1903) on photographic plates taken by Blazhko. The first visual observations of the star was made by Graff (1905) and he was able to determine the pulsation period (0397). Since that time a great number of visual observations have been published, but there are only a few published photoelectric observations available (e.g., Fitch et al., 1966; Liu & Janes, 1989).
The absolute parameters of RR~Gem were determined by Liu & Janes (1990) from a Baade-Wesselink analysis. It belongs to the metal rich ([Fe/H] dex as compiled in Jurcsik & Kovács (1996)) disk population group of RR Lyrae stars (Layden, 1995).
Most of the papers dealing with Blazhko stars list the possible theoretical explanations of the phenomena and also the different observational arguments (see e.g. LaCluyzé et al., 2004; Alcock et al., 2003; Chadid et al., 2004). Neither of the two groups of possible models
b) resonant coupling of nonradial mode(s) to the dominant radial mode (Nowakowski & Dziembowski, 2001)
can fully explain the large variety of observational results of Blazhko behaviour. It is important to note, however, that both of the models connect the Blazhko period to the rotation of the star.
In this first part of a series of two papers on RR~Gem, we examine the photometric behaviour of the star exclusively using recent CCD observations. A reexamination of all the previous observations in order to reveal the long term behaviour of the modulation will be the subject of the second paper.
2 The data
The observations were obtained with the automated 60cm telescope of Konkoly Observatory, Svábhegy, Budapest equipped with a Wright 750x1100 CCD (parameters and calibration are given in Bakos (1999)) using filters. The field of view was 17’x24’. Data reduction was performed using standard IRAF111IRAF is distributed by the National Optical Astronomy Observatories, which are operated by the Association of Universities for Research in Astronomy, Inc., under cooperative agreement with the National Science Foundation. packages. More than 3000 frames were obtained in each passband on 56 nights between 14 January and 4 May in 2004 (JD ). The data were transformed to the standard system by using the magnitudes given by Liu & Janes (1989) for SAO~060004 and SAO~060008. Relative aperture photometry to BD~$+31°1549$ was calculated, and SAO~060004 was used as check star to control the stability of the results. The magnitude differences between our comparison and check stars remained constant with 0.0081, 0.0089, 0.0095, and 0.0093 mag scatter in the colours, respectively.
The magnitudes and colours we derived for BD~$+31°1549$ ( mag, mag, mag, and mag) are in excellent agreement with the mag and mag values given by Sturch (1966). Photometric data are available electronically at the CDS. In the electronic tables (http://cdsweb.u-strasbg.fr/cats/J.A+A.htx…..) Column 1 lists the HJD of the observation, and Column 2 gives the differential magnitude of RR~Gem with respect to BD~$+31°1549$ for the colours.
3 Photometric results
| / rms [mag] | 10.822 | 0.013 | 11.418 | 0.011 | 11.152 | 0.013 | 10.906 | 0.012 | |
|---|---|---|---|---|---|---|---|---|---|
| A | A | A | A | ||||||
| [c/d] | [mag] | [deg] | [mag] | [deg] | [mag] | [deg] | [mag] | [deg] | |
| 2.517063 | 0.5527 | 80.0 | 0.4009 | 77.1 | 0.3080 | 72.9 | 0.2376 | 66.7 | |
| 2 | 5.034126 | 0.3111 | 296.1 | 0.2303 | 295.8 | 0.1799 | 294.7 | 0.1395 | 293.2 |
| 3 | 7.551189 | 0.1751 | 169.7 | 0.1327 | 169.9 | 0.1055 | 169.6 | 0.0828 | 169.5 |
| 4 | 10.068252 | 0.1184 | 46.2 | 0.0900 | 46.1 | 0.0707 | 45.6 | 0.0557 | 45.9 |
| 5 | 12.585315 | 0.0663 | 278.0 | 0.0509 | 277.7 | 0.0409 | 276.4 | 0.0322 | 277.8 |
| 6 | 15.102378 | 0.0494 | 142.9 | 0.0385 | 142.9 | 0.0304 | 143.1 | 0.0241 | 142.2 |
| 7 | 17.619441 | 0.0341 | 18.3 | 0.0265 | 18.9 | 0.0212 | 18.7 | 0.0165 | 18.3 |
| 8 | 20.136504 | 0.0217 | 239.5 | 0.0170 | 241.4 | 0.0133 | 241.5 | 0.0099 | 241.8 |
| 9 | 22.653567 | 0.0174 | 105.1 | 0.0134 | 108.9 | 0.0109 | 109.5 | 0.0086 | 109.2 |
| 10 | 25.170630 | 0.0125 | 333.2 | 0.0098 | 335.4 | 0.0071 | 338.7 | 0.0057 | 330.0 |
| 11 | 27.687693 | 0.0091 | 196.2 | 0.0074 | 198.9 | 0.0054 | 195.5 | 0.0034 | 192.9 |
| 12 | 30.204756 | 0.0072 | 57.2 | 0.0048 | 58.34 | 0.0044 | 58.6 | 0.0030 | 61.0 |
| 13 | 32.721819 | 0.0055 | 282.0 | 0.0042 | 280.3 | 0.0036 | 294.2 | 0.0021 | 285.9 |
| 14 | 35.238882 | 0.0044 | 145.8 | 0.0031 | 148.2 | 0.0026 | 141.3 | 0.0015 | 149.1 |
| 15 | 37.755945 | 0.0039 | 3.9 | 0.0027 | 1.2 | 0.0024 | 2.7 | 0.0013 | 359.1 |
| 2.378743 | 0.0093 | 185.6 | 0.0065 | 186.6 | 0.0059 | 196.2 | 0.0044 | 192.6 | |
| 2.655383 | 0.0092 | 349.2 | 0.0064 | 347.3 | 0.0058 | 350.9 | 0.0039 | 352.4 | |
| 2 | 4.895806 | 0.0092 | 29.3 | 0.0073 | 38.8 | 0.0052 | 32.6 | 0.0044 | 42.7 |
| 2 | 5.172446 | 0.0086 | 175.3 | 0.0060 | 179.1 | 0.0043 | 181.2 | 0.0039 | 186.5 |
| 3 | 7.412869 | 0.0078 | 248.6 | 0.0061 | 248.4 | 0.0052 | 262.8 | 0.0038 | 271.1 |
| 3 | 7.689509 | 0.0071 | 43.9 | 0.0052 | 43.7 | 0.0046 | 45.8 | 0.0036 | 54.4 |
| 4 | 9.929932 | 0.0070 | 155.3 | 0.0054 | 156.3 | 0.0040 | 149.5 | 0.0032 | 161.5 |
| 4 | 10.206572 | 0.0067 | 306.8 | 0.0048 | 302.8 | 0.0043 | 304.1 | 0.0035 | 303.5 |
| 5 | 12.446995 | 0.0056 | 18.4 | 0.0043 | 14.8 | 0.0034 | 16.3 | 0.0028 | 16.4 |
| 5 | 12.723635 | 0.0054 | 190.0 | 0.0042 | 185.6 | 0.0033 | 188.6 | 0.0030 | 183.6 |
| 6 | 14.964058 | 0.0060 | 253.1 | 0.0043 | 250.4 | 0.0034 | 255.9 | 0.0027 | 243.3 |
| 6 | 15.240698 | 0.0035 | 41.3 | 0.0037 | 40.1 | 0.0024 | 38.1 | 0.0018 | 56.0 |
| 7 | 17.481121 | 0.0049 | 135.6 | 0.0036 | 136.1 | 0.0029 | 128.2 | 0.0027 | 126.9 |
| 7 | 17.757761 | 0.0048 | 280.5 | 0.0040 | 279.3 | 0.0037 | 282.5 | 0.0021 | 279.7 |
| 8 | 19.998184 | 0.0033 | 358.2 | 0.0026 | 1.2 | 0.0020 | 4.0 | 0.0026 | 356.5 |
| 8 | 20.274824 | 0.0033 | 169.6 | 0.0027 | 168.2 | 0.0018 | 172.1 | 0.0018 | 174.1 |
| 9 | 22.515247 | 0.0036 | 245.5 | 0.0025 | 240.8 | 0.0031 | 242.6 | 0.0017 | 246.8 |
| 9 | 22.791887 | 0.0030 | 30.6 | 0.0020 | 29.8 | 0.0017 | 21.4 | 0.0010 | 34.8 |
| 10 | 25.032310 | 0.0025 | 114.8 | 0.0020 | 100.3 | 0.0018 | 130.7 | 0.0014 | 113.8 |
| 10 | 25.308950 | 0.0024 | 269.4 | 0.0025 | 263.3 | 0.0012 | 254.8 | 0.0008 | 288.3 |
| 11 | 27.549373 | 0.0020 | 332.5 | 0.0017 | 339.3 | 0.0014 | 2.6 | 0.0014 | 325.4 |
| 11 | 27.826013 | 0.0018 | 138.7 | 0.0012 | 141.8 | 0.0012 | 152.6 | 0.0009 | 150.7 |
| 12 | 30.066436 | 0.0019 | 205.0 | 0.0009 | 205.5 | 0.0014 | 223.3 | 0.0011 | 206.3 |
| 12 | 30.343076 | 0.0016 | 356.0 | 0.0008 | 8.6 | 0.0007 | 343.0 | 0.0013 | 19.0 |
| 13 | 32.583499 | 0.0020 | 115.9 | 0.0015 | 111.0 | 0.0010 | 103.8 | 0.0003 | 147.5 |
| 13 | 32.860139 | 0.0019 | 252.5 | 0.0013 | 237.3 | 0.0006 | 223.0 | 0.0010 | 255.9 |
| 14 | 35.100562 | 0.0008 | 344.8 | 0.0008 | 330.2 | 0.0009 | 315.7 | 0.0006 | 329.6 |
| 14 | 35.377202 | 0.0011 | 155.2 | 0.0009 | 159.8 | 0.0013 | 122.4 | 0.0009 | 101.7 |
| 15 | 37.617625 | 0.0005 | 161.0 | 0.0007 | 219.6 | 0.0006 | 178.5 | 0.0006 | 140.6 |
| 15 | 37.894265 | 0.0008 | 11.8 | 0.0004 | 354.5 | 0.0005 | 30.4 | 0.0002 | 155.3 |
| 0.138320 | 0.0058 | 345.9 | 0.0045 | 355.7 | 0.0040 | 345.9 | 0.0042 | 354.1 | |
| 1 | 0.989 | 0.045 | 163.6 | 3.0 | 0.970 | 0.063 | 160.7 | 3.7 | 0.983 | 0.071 | 154.7 | 4.9 | 0.867 | 0.088 | 159.8 | 6.2 |
|---|---|---|---|---|---|---|---|---|---|---|---|---|---|---|---|---|
| 2 | 0.934 | 0.053 | 146.0 | 3.3 | 0.822 | 0.053 | 140.3 | 3.8 | 0.827 | 0.100 | 148.6 | 6.3 | 0.886 | 0.091 | 143.8 | 6.5 |
| 3 | 0.910 | 0.060 | 155.3 | 3.7 | 0.852 | 0.065 | 155.3 | 4.1 | 0.885 | 0.103 | 143.0 | 5.7 | 0.947 | 0.109 | 143.3 | 6.8 |
| 4 | 0.957 | 0.070 | 151.5 | 3.9 | 0.887 | 0.076 | 146.5 | 4.6 | 1.075 | 0.128 | 154.6 | 6.6 | 1.063 | 0.137 | 142.0 | 7.4 |
| 5 | 0.982 | 0.088 | 171.6 | 5.2 | 0.977 | 0.098 | 170.8 | 5.7 | 0.971 | 0.144 | 172.3 | 8.8 | 1.034 | 0.176 | 167.2 | 9.0 |
| 6 | 0.583 | 0.077 | 148.2 | 6.5 | 0.860 | 0.092 | 149.7 | 5.9 | 0.706 | 0.144 | 142.2 | 10.3 | 0.667 | 0.134 | 172.7 | 11.8 |
| 7 | 0.980 | 0.114 | 144.9 | 6.0 | 1.111 | 0.125 | 143.2 | 6.5 | 1.276 | 0.224 | 154.3 | 9.1 | 0.778 | 0.141 | 152.8 | 11.5 |
| 8 | 1.000 | 0.129 | 171.4 | 8.6 | 1.038 | 0.166 | 167.0 | 9.2 | 0.900 | 0.269 | 168.1 | 15.5 | 0.692 | 0.140 | 177.6 | 12.7 |
| 9 | 0.833 | 0.108 | 145.1 | 8.9 | 0.800 | 0.154 | 149.0 | 11.2 | 0.548 | 0.110 | 138.8 | 13.8 | 0.588 | 0.205 | 148.0 | 22.5 |
| 10 | 1.000 | 0.170 | 154.6 | 11.4 | 1.250 | 0.240 | 163.0 | 10.7 | 0.632 | 0.187 | 124.1 | 20.6 | 0.714 | 0.263 | 174.5 | 24.0 |


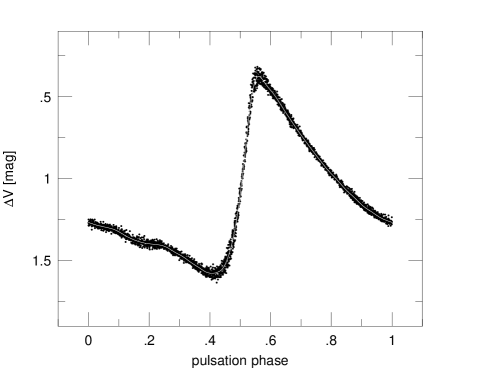
The CCD observations revealed that, indeed, RR~Gem shows Blazhko modulation, however, with very small, mag modulation amplitude. The modulation pattern is very regular, with a definite node (fixed point) on the ascending branch. Fig. 1 shows the band observations superimposed on the mean light curve. The variation in the heights of maxima indicated a modulation period of about 7 days.
The Fourier spectra of the data and the data prewhitened with the pulsation frequency and its harmonics are shown in Fig. 2. Data analysis was performed using the different applications of the MUFRAN package (Kolláth, 1990). The Fourier spectrum of the residual shows the triplet structure typical of amplitude modulation up to about the 14th harmonic component. The side lobe frequencies have similar amplitudes and are symmetrically placed around the radial mode frequency and its harmonics. The amplitudes of the side lobes decrease much less steeply than the amplitudes of the harmonics of the main pulsation frequency (see Fig. 3). This fact may imply a different explanation of these frequency components than that of the radial mode where nonlinear effects invoke harmonic components with exponentially decreasing amplitudes. The modulation components’ amplitudes of AR~Her (a Blazhko variable with large amplitude and phase modulation and a 32 d modulation period) show similar behaviour; from the fourth harmonic component its modulation amplitudes dominate over the pulsation ones (Smith et al., 1999).
Table 1 summarizes the amplitudes and phases of the pulsation and modulation frequencies in the passbands calculated from the least squares solution using sine terms and HJD initial epoch value according to the formula given in Kovács (1995, Eq. 2). In the top of Table 1 the mean magnitudes () and the standard deviations of the fits are also given.
This solution has been calculated by using locked values of both the pulsation and modulation frequency components. The pulsation frequency adopted is the mean value obtained for the data. The modulation frequency has been determined as the frequency which results the smallest scatter of the residuals of the least squares solutions assuming symmetrical displacement of the side lobes up to the 9th harmonic component of the radial mode. The period of the modulation obtained this way is . In Fig. 4 the light curve is folded according to this modulation period; sinusoidal variation in the height of maximum light is evident. The ephemerides of maximum pulsation light and maximum pulsation amplitude determined from the measurements of the 2004 observing season are the followings:
HJD
HJD .
The error weighted mean value of the asymmetry parameter () averaged over the first 10 modulation component pairs in the four colours is , indicating very small asymmetry with slightly larger amplitudes at the shorter frequency sides. For comparison the distribution of this parameter of the MACHO data peaks at (Alcock et al., 2003).


The currently viable theoretical explanations of the Blazhko phenomenon predict approximate equality of the amplitude ratios, and phase differences between the side lobe frequencies of the different order components in each colour (Kovács, 1995; Shibahashi, 2000; Smith et al., 1999; Nowakowski & Dziembowski, 2001). Although these predictions are based on simplified models it is worth checking the stability of these components in our data. Table 2 lists the amplitude ratios and phase differences and their errors of the side lobe frequency pairs in the bandpasses for the first 10 modulation component pairs. Differences larger than can be found in the amplitude ratios while the phase differences of the first 5 modulation component pairs in the different colours do not agree within the limit. The mean values and the standard deviations of the phase differences in the colours of the first five modulation component pairs are and . The phase differences of the fifth components are statistically significantly larger in each colour than the phase differences of the second pairs. The large scatter of the third and fourth components indicates colour to colour changes of the phase differences, too. Differences between these parameters (, ) have also been detected in AR~Her (Smith et al., 1999).
3.1 Stability of the results
One of the theoretically unexplained characteristics of Blazhko stars is the high asymmetry of the amplitudes of the modulation frequency components. In contrast, only very small if any asymmetry can be seen in Fig. 2. We have checked what happens if data subsets with less complete phase coverage are used. The results are shown in Fig. 5. The 110 day dataset has been divided into two intervals of equal length but different number of observations ( and ). In the first part of the observations both the clear sky statistics were better, and the observational runs were longer. The residual spectrum of the first dataset is very similar to that of the complete dataset shown in the middle panel of Fig. 2. However, the residual spectrum of the second dataset is significantly different, with enhanced power at the lower frequency side of the modulation, and with diminishing amplitudes at the higher frequency side. The data distribution of this second dataset also contains observations from each 0.1 phase intervals of the Blazhko period, but for some phase intervals no complete light curve can be constructed. This is the typical data distribution of Blazhko star photometry, thus our result warns that classification schemes of the modulation based on the asymmetry of the side lobe amplitudes might be seriously biased by the phase coverage of the data and may lead to an over-interpretation of the results. As the Blazhko period of RR~Gem is about an order of magnitude shorter than the typical period of the modulation, it should be expected that for stars with longer modulation periods even more extended observations than we have on RR~Gem are needed to correctly describe the properties of the modulation. For comparison, in Alcock et al. (2003), measurements of the stars were analysed.
The effect of data distribution biases on the side lobe amplitudes, however, has to be carefully treated. The fact that the different observations of RR~Lyrae (Szeidl & Kolláth, 2000; Smith et al., 2003) equally show the longer frequency modulation components to have higher amplitudes points to real differences in the amplitudes of the modulation components.
4 Variations during the Blazhko cycle
The full coverage of the pulsation light curve at different phases of the Blazhko cycle makes it possible to study the changes of the light curves’ shapes and Fourier parameters in detail, and to detect any possible variation in the mean magnitudes and colours.
4.1 Light curve changes
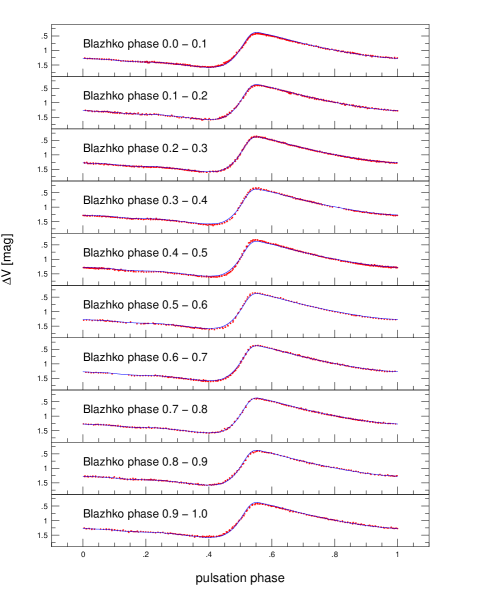
We have divided the data into 10 subsets containing observations from different phases of the Blazhko cycle. The minimum and maximum number of data in these subsets are 165 and 479, respectively. The behaviour of the Fourier parameters of the light curves in the different Blazhko phases is shown in Fig. 6. The total range of the variations in the , amplitudes are 0.026, (between 0.390 and 0.416 mag) and 0.009 mag (between 0.005 and 0.014 mag), respectively. The amplitude ratios () follow the changes of the amplitudes but there is no significant change in the epoch-independent phase differences () in accordance with the finding that no phase modulation in the light curve changes has been detected.

We have checked how the light curves at different Blazhko phases deviate from theo mean light curve. Fig. 7 and 8 show the pulsation light curves at each one-tenth phase of the Blazhko cycle, and the residual curves after subtracting the mean light curve from the data subsets.
Due to the good coverage of the data, a least squares fit with the pulsation period and its harmonics to the entire dataset (as shown in Fig. 1) is a good representation of the mean light curve of the variable. The Fourier parameters of this ‘average’ solution agree within the limits of the uncertainties with the corresponding amplitudes and phases of the complete solution listed in Table 1.
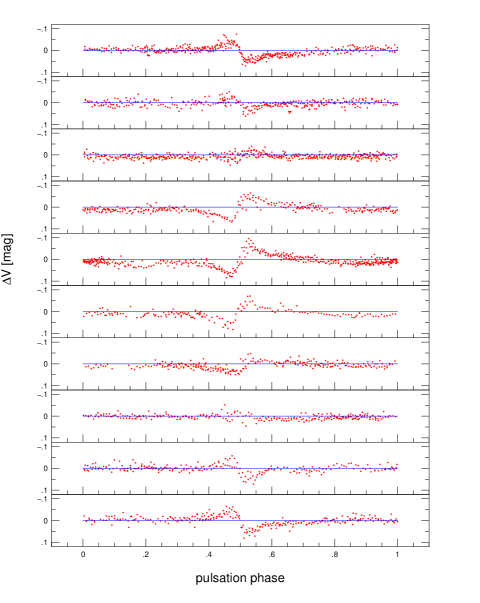
The most striking property of the residual curves is that they show intense variations only in a narrow, phase interval of the pulsation. The residual curve of all the data (Fig. 9) shows that the distortion is symmetrical to phase 0.5 which is set to the phase of the middle of the rising branch as described in Sect. 3. A similar residual plot has been shown by Lee & Schmidt (2001) for DR~And with the conclusion that ‘large residuals are obtained from data points on the ascending branch’. To analyse such a behaviour with the Fourier decomposition method might not be the most appropriate tool, as for a reliable model very high harmonic modulation frequencies are needed. This is reflected in the significantly different amplitude decrease behaviour of the modulation frequencies from the amplitude decrease of the harmonic components of the main pulsation (see Fig. 3). Although no complete fully nonlinear model calculation exists, Nowakowski & Dziembowski (2003) showed that in evolved stars the nonradial modes are highly nonlinear. However, even in the case of high nonlinearity it is hard to explain why the high () order nonlinear coupling terms have amplitudes commensurable with the first order ones.

It is also important to think about why the modulation is concentrated in the minimum to maximum phase interval of the pulsation, where nonlinear effects are most important. In the pioneering spectroscopic study of RR~Lyrae, Preston et al. (1965) concluded that a displacement of the shock-forming layer in the atmosphere takes place during the Blazhko cycle. In Preston & Paczińsky (1964) it was also shown that: ‘the phases at which H emission occurs are closely related to phases of photometric parameters’. Thus the phase of the excess and the phase on the ascending branch when the visual luminosity of the star equals its time average value (at phase 0.5 in the figures) are closely related, with only some minute differences, to the onset of the H emission. The observations of Liu & Janes (1989) indicate strong excess around the phase of the mid ascending branch in RR~Gem. In Figs. 8 and 9 the symmetrical modulation is centred exactly on this phase of the pulsation, indicating a connection between the origin of the modulation and that of the H emission.
As the standard deviations of the data from the fits using the 46 frequencies listed in Table 1 are larger in each colour than expected from the observations of the comparison and check stars, some further variations of the residual light curves are also suspected. The Fourier spectra of the residuals after prewhitening with both the pulsation and modulation frequencies listed in Table 1 for the data are shown in Fig. 10. Another modulation frequency component is present in each colour; the arrows indicate the positions of . This tertiary periodicity corresponds to modulation with a period of , which is very close to the dominant modulation period. A tertiary period shorter than the dominant modulation period has been also found by LaCluyzé et al. (2004) for XZ~Cygni. A quintuplet structure with equidistant frequency spacing would predict secondary modulation with a much shorter, periodicity.
| magnitude averages | intensity averages | ||||||||||||||
|---|---|---|---|---|---|---|---|---|---|---|---|---|---|---|---|
| Bl phase | |||||||||||||||
| 0.3898 | 11.819 | 11.414 | 11.150 | 10.903 | 0.405 | 0.264 | 0.511 | 11.713 | 11.359 | 11.118 | 10.885 | 0.354 | 0.241 | 0.474 | |
| 0.3981 | 11.818 | 11.416 | 11.150 | 10.905 | 0.402 | 0.266 | 0.511 | 11.707 | 11.358 | 11.116 | 10.885 | 0.349 | 0.242 | 0.473 | |
| 0.4036 | 11.824 | 11.419 | 11.153 | 10.908 | 0.405 | 0.266 | 0.511 | 11.706 | 11.358 | 11.117 | 10.888 | 0.348 | 0.241 | 0.470 | |
| 0.4104 | 11.827 | 11.421 | 11.156 | 10.910 | 0.406 | 0.265 | 0.511 | 11.702 | 11.356 | 11.117 | 10.888 | 0.346 | 0.239 | 0.468 | |
| 0.4159 | 11.829 | 11.422 | 11.154 | 10.911 | 0.407 | 0.268 | 0.511 | 11.701 | 11.355 | 11.115 | 10.888 | 0.346 | 0.240 | 0.467 | |
| 0.4088 | 11.824 | 11.421 | 11.155 | 10.908 | 0.403 | 0.266 | 0.513 | 11.701 | 11.356 | 11.117 | 10.885 | 0.345 | 0.239 | 0.471 | |
| 0.4081 | 11.824 | 11.420 | 11.154 | 10.908 | 0.404 | 0.266 | 0.512 | 11.704 | 11.357 | 11.117 | 10.886 | 0.347 | 0.240 | 0.471 | |
| 0.4953 | 11.823 | 11.416 | 11.152 | 10.905 | 0.407 | 0.264 | 0.511 | 11.710 | 11.358 | 11.118 | 10.886 | 0.352 | 0.240 | 0.472 | |
| 0.3947 | 11.820 | 11.414 | 11.150 | 10.903 | 0.406 | 0.264 | 0.511 | 11.712 | 11.357 | 11.116 | 10.883 | 0.355 | 0.241 | 0.474 | |
| 0.3900 | 11.816 | 11.413 | 11.146 | 10.901 | 0.403 | 0.267 | 0.512 | 11.710 | 11.357 | 11.114 | 10.882 | 0.353 | 0.243 | 0.475 | |
Fig. 11 shows the residual light curve after prewhitening with the frequencies of Table 1 folded with the pulsation period. Residuals are still concentrated in the same phase of the pulsation as in Fig. 9. This behaviour of the residuals indicates that, perhaps, some irregular behaviour of the Blazhko modulation mimics the tertiary periodicity. This idea seems to be supported by separate analyses of the two halves of the data, as neither parts of the data show the same residual structure shown in Fig. 11.


4.2 Magnitude and colour changes
Multicolour photometry of Blazhko stars which were extended enough to determine whether there is any change in the mean colour of the variables during the Blazhko period has never been obtained.
According the mean characteristics of the Blazhko variables in the MACHO database, the modulation frequency occurs in the spectra with an overall amplitude of 0.006 mag (Alcock et al., 2003), i.e., this is the typical amplitude of the the modulation in the magnitude average light level of Blazhko variables.
In Table 3 the magnitude and intensity mean magnitudes of RR~Gem in the different Blazhko phases are listed. Mean colours are calculated as the arithmetic differences between the mean magnitudes. Fig. 12 shows the mean magnitude and and colour variations during the Blazhko cycle calculated as magnitude and intensity averages. Although the magnitude mean brightness level of the star seems to vary with a 0.005 mag semi-amplitude (in accordance with the MACHO results), the intensity mean brightness shows much smaller if any variation. Concerning the colours, the situation is the opposite; the colours calculated from the intensity mean magnitudes definitely show correlated changes with the Blazhko phase, namely, the star is slightly cooler in its small amplitude phase than during the highest amplitude period.
Whether intensity or magnitude mean colors better correspond to the static values of pulsating stars is still controversial (Bono et al., 1995). As the luminosities of the stars have real physical meaning, we think that the intensity means reflect the real parameters of the star more correctly. According to the intensity mean values the mean brightness level of RR~Gem remains the same during the Blazhko cycle, but a slight colour (temperature) variation takes place in the sense that the star is K cooler when the amplitude of the pulsation is the smallest.
5 Discussion
The extended CCD observations of RR~Gem exposed some previously unknown or unexamined properties of the Blazhko phenomenon. The new results concerning the properties of the modulation of RR~Gem are summarized in the next items.

-
•
First detection of a very low amplitude Blazhko modulation with symmetrically placed triplets in the Fourier spectrum.
-
•
The modulation is concentrated in a 0.2 phase interval of the pulsation, centred on the mid of the ascending branch.
-
•
In contrast to the exponential decrease in the amplitudes of the harmonic components of the radial pulsation, the decrease in the amplitudes of modulating components is close to linear.
-
•
In contrast to theoretical expectations the amplitude ratios and phase differences of the modulation components are not the same for the different order modulation component pairs and in the different colours.
-
•
According to the intensity mean colours and magnitudes in the different phases of the Blazhko cycle, there is very small if any mean brightness variation along the Blazhko period, while the mean colours indicate small but definite changes in the sense that the star is 30-40 K cooler in its small amplitude phase.
-
•
The light curve cannot be completely fitted with symmetrically placed Fourier frequency components alone. Residual scatter of the light curve is still concentrated in the ascending branch, indicating some irregular behaviour of the modulation.
Any model which relates the Blazhko periodicity to the rotation of the star predicts a similar percentage of small amplitude modulation as large amplitude ones. Because of the incidental angle of view of the rotational axes, the observed amplitudes of the modulation has to vary uniformly from zero up to some tenths of a magnitude. On the contrary, no small amplitude Blazhko modulation has been known previously. This fact has to be carefully examined on the grounds of observational biases. The most extended observations of field RR Lyrae stars were the photographic observations from the middle of the century. These observations were not, however, accurate enough to detect modulation amplitudes smaller than mag. Photoelectric observations of field RR Lyrae stars are very sparse and usually time limited, so again, they were not suitable to detect small amplitude, long period modulations. The cluster and extragalactic variable surveys are usually seriously affected by crowding problems and are also often very time limited, thus small amplitude modulations might be missed or attributed to observational inaccuracy.
The detection of hundredths of magnitude amplitude modulation of RR~Gem indicates that there might be a serious selection effect against small amplitude Blazhko stars. A systematic search using today’s accurate photometric detectors is needed to reveal the true unbiased statistics of the modulation amplitudes.
Among the 731 fundamental mode Blazhko variables of the MACHO database there was only one star with a modulation period shorter than 10 days and only 5 with days (Alcock et al., 2003). In contrast, RR~Gem is already the second very short modulation period variable in the much smaller sample of well observed galactic field Blazhko variables (less than 50 stars). The other short period Blazhko star (AH~Cam) was studied in detail by Smith et al. (1994). Both AH~Cam and RR~Gem are relatively metal rich variables with pulsation periods shorter than . These are their common features, but the modulation pattern of the two stars are very different. In AH~Cam the amplitude of the modulation is mag, and phase modulation with about 0.1 pulsation phases occurs as well. A simplified explanation of the larger percentage of short modulation period Blazhko stars in our Galaxy than in the LMC would relate the short modulation periods to the larger metal content of these stars. However, the 530 day modulation period of RS~Boo (Kanyó (1986); Nagy (1998)) with d and [Fe/H]= dex (Layden, 1995) indicates that a more complex description is needed.
Though Chadid et al. (2004), favouring the nonradial mode explanation of the Blazhko phenomenon, argue against the presence of a strong magnetic field in RR~Lyrae, our detailed analysis of RR~Gem revealed a challenge to these models as well. The two most important results which would be hard to explain by nonradial modes are the followings.
a) The linear decrease of the amplitudes of the modulation components compared to the exponential decrease in the amplitudes of the radial mode (Fig. 3) indicates significant differences between these frequency components. As nonlinearity is proportional to the amplitude, it is expected that if the harmonic terms of the radial mode invoked by nonlinear coupling decrease exponentially, then the nonlinear coupling terms of the much smaller amplitude nonradial modes have to decrease even more steeply. The linear decrease of the amplitudes of the very small amplitude modulation components indicates a different origin of its higher order components than nonlinear coupling. This anomalous behavior of the amplitudes of the modulation frequencies arises from the high concentration of the modulation in only 0.2 phase intervals of the pulsation.
b) The modulation is centred on the phase when H emission is assumed to occur. Such a connection between a temporal physical phenomenon in the atmosphere and the occurrence of the modulation suggests that during the Blazhko period real changes in the atmosphere are present. This is also supported by the detected colour variations during the Blazhko cycle.
Our detailed photometric observations of RR~Gem have given new insight into the Blazhko phenomenon. However, it is an open question whether the Blazhko properties of RR~Gem are unique or give general information about the modulation as well. To find the answer, further similar studies of other Blazhko variables are planned.
Acknowledgements.
This research has made use of the SIMBAD database, operated at CDS Strasbourg, France. The financial support of OTKA grants T-043504 and T-046207 is acknowledged.References
- Alcock et al. (2003) Alcock, C., Alves, D. R., Becker, A. et al. 2003, ApJ, 598, 597
- Bakos (1999) Bakos, G. Á. 1999, Occ. Techn. Notes Konkoly Obs., No. 11, http://www.konkoly.hu/mitteilungen/mitteilungen.html
- Blazhko (1907) Blazhko, S. 1907, Astron. Nachr., 173, 325
- Bono et al. (1995) Bono, G., Caputo, F., & Stellingwerf R. F. 1995, ApJS, 99, 263
- Ceraski (1903) Ceraski, W. 1903, Astron. Nachr., 161, 363
- Chadid et al. (2004) Chadid, M., Wade, G. A., Shorlin, S. L. S., & Landstreet, J. D. 2004, A&A, 413, 1087
- Cousens (1983) Cousens, A. 1983, MNRAS, 203, 1171
- Detre (1970) Detre, L. 1970, Transactions of the IAU XIV A. Reports on Astronomy, 259
- Fitch et al. (1966) Fitch, W. S., Wiśniewski, W. Z., & Johnson, H. L. 1966, Comm. Lun. and Planet. Lab., Vol 5, Part 2, No 71
- Graff (1905) Graff, K. 1905, Mitteilungen d. Hamburger Sternwarte, Bd.3, Nr.8
- Jurcsik & Kovács (1996) Jurcsik, J., & Kovács, G. 1996, A&A, 312, 111
- Kanyó (1986) Kanyó, S. 1986, Mitt. der Sternw. der Ungarischen Akad. der Wiss., Nr. 87
- Kolláth (1990) Kolláth, Z. 1990, Occ. Techn. Notes Konkoly Obs., No. 1, http://www.konkoly.hu/staff/kollath/mufran.html
- Kovács (1995) Kovács, G. 1995, A&A, 295, 693
- LaCluyzé et al. (2004) LaCluyzé, A., Smith, H. A., Gill, E.-M., et al. 2004, AJ, 127, 1653
- Layden (1995) Layden, A. C. 1995, AJ, 110, 2288
- Lee & Schmidt (2001) Lee, K. M., & Schmidt, E. G. 2001, PASP, 113, 1140
- Liu & Janes (1989) Liu, T., & Janes, K. A. 1989, ApJS, 69, 593
- Liu & Janes (1990) Liu, T., & Janes, K. A. 1990, ApJ, 354, 273
- Nagy (1998) Nagy, A. 1998, A&A, 339, 440
- Nowakowski & Dziembowski (2001) Nowakowski, R. M., & Dziembowski, W. A. 2001, Acta Astron., 51, 5
- Nowakowski & Dziembowski (2003) Nowakowski, R. M., & Dziembowski, W. A. 2003, Ap&SS, 284, 273
- Preston & Paczińsky (1964) Preston, G. W., & Paczińsky, B. 1964, ApJ, 140, 181
- Preston et al. (1965) Preston, G. M., Smak, J., & Paczyńsky, B. 1965, ApJS, 12, 99
- Shibahashi (2000) Shibahashi, H. 2000, in ASP Conf. Ser. 203, The Impact of Large-scale Surveys on Pulsating Star Research, eds., L. Szabados and D.W. Kurtz, p. 299
- Smith et al. (1994) Smith, H. A., Matthews, J. M., Lee, K. M. et al. 1994, AJ, 107, 679
- Smith (1995) Smith, H.A. 1995, RR Lyrae Stars (Cambridge University Press)
- Smith et al. (1999) Smith, H. A., Barnett, M., Silbermann, N. A., & Gay, P. 1999, AJ, 118, 572
- Smith et al. (2003) Smith, H. A., Church, J. A., Fournier, J. et al. 2003, PASP, 115, 43
- Sturch (1966) Sturch, C. 1966, ApJ, 143, 774
- Szeidl (1988) Szeidl, B. 1988, in Multimode Stellar Pulsation, eds., G. Kovács, L. Szabados and B. Szeidl, (Kultúra, Budapest), p. 45
- Szeidl & Kolláth (2000) Szeidl, B., & Kolláth, Z. 2000, ASP Conf. Ser. Vol.203., RR Lyrae: Analysis of 100 years of Observations, eds.: Szabados, L., Kurtz, D. W., p. 281