e-mail: wnp@mpe.mpg.de
XMM-Newton survey of M 31††thanks: XMM-Newton is an ESA Science Mission with instruments and contributions directly funded by ESA Member States and the USA (NASA).,††thanks: Table 2 is available in electronic form at the CDS via anonymous ftp to cdsarc.u-strasbg.fr (130.79.128.5) or via http://cdsweb.u-strasbg.fr/cgi-bin/qcat?J/A+A/
In an analysis of XMM-Newton archival observations of the bright Local Group spiral galaxy M~31 we study the population of X-ray sources (X-ray binaries, supernova remnants) down to a 0.2–4.5 keV luminosity of 4.4 erg s-1. EPIC hardness ratios and optical and radio information are used to distinguish between different source classes. The survey detects in an area of 1.24 square degree 856 sources. We correlate our sources with earlier M~31 X-ray catalogues and use information from optical, infra-red and radio wavelengths. As M~31 sources we detect 21 supernova remnants (SNR) and 23 SNR candidates, 18 supersoft source (SSS) candidates, 7 X-ray binaries (XRBs) and 9 XRB candidates, as well as 27 globular cluster sources (GlC) and 10 GlC candidates, which most likely are low mass XRBs within the GlC. Comparison to earlier X-ray surveys reveal transients not detected with XMM-Newton, which add to the number of M~31 XRBs. There are 567 sources classified as hard, which may either be XRBs or Crab-like SNRs in M~31 or background AGN. The number of 44 SNRs and candidates more than doubles the X-ray detected SNRs. 22 sources are new SNR candidates in M~31 based on X-ray selection criteria. Another SNR candidate may be the first plerion detected outside the Galaxy and the Magellanic Clouds. On the other hand, six sources are foreground stars and 90 foreground star candidates, one is a BL Lac type active galactic nucleus (AGN) and 36 are AGN candidates, one source coincides with the Local Group galaxy M 32, one with a background galaxy cluster (GCl) and another is a GCl candidate, all sources not connected to M~31.
Key Words.:
Galaxies: individual: M~31 - X-rays: galaxies1 Introduction
In the XMM-Newton survey of the Local Group Sc galaxy M 33, Pietsch et al. (2004, hereafter Paper I) detected 408 sources in a 0.8 square degree field combining the counts of all EPIC instruments. The use of X-ray colours and optical and radio information allowed them to identify and classify the X-ray sources and proved to be efficient in separating super-soft X-ray sources (SSSs) and thermal supernova remnants (SNRs) in M 33 from Galactic stars in the foreground and “hard” sources. These hard sources may be either X-ray binaries (XRBs) or Crab-like SNRs in M 33 or active galactic nuclei (AGN) in the background of the galaxy.
The Andromeda galaxy M~31 is located at a similar distance as M~33 (780 kpc, Holland 1998; Stanek & Garnavich 1998, i.e. 1″ corresponds to 3.8 pc and the flux to luminosity conversion factor is 7.3 cm2) and – compared to the near face-on view of M~33 – is seen under a higher inclination (78∘). The optical extent of the massive SA(s)b galaxy can be approximated by an inclination-corrected ellipse with large diameter of 1533 and axes ratio of 3.09 (de Vaucouleurs et al. 1991; Tully 1988). With its moderate Galactic foreground absorption (= 7 cm-2, Stark et al. 1992) M~31 is well suited to study the X-ray source population and diffuse emission in a nearby spiral similar to the Milky Way. As M~31 is seen through a comparable Galactic absorbing column as M~33 one can use the same methods and similar source selection criteria that proved to be successful in the M 33 analysis. On the other hand, there is a big number of low mass XRBs (LMXBs) identified as bright X-ray sources in M~31 from earlier observations (see below). The properties of these sources may help to better classify some of the “hard” sources in M~33.
M~31 was a target for many previous imaging X-ray missions. The Einstein X-ray observatory detected 108 individual X-ray sources brighter than 5 erg s-1, 16 of which were found to vary between Einstein observations (van Speybroeck et al. 1979; Collura et al. 1990; Trinchieri & Fabbiano 1991). The sources were identified with young stellar associations, globular clusters (i.e. LMXBs) and SNRs (see e.g. Blair et al. 1981; Crampton et al. 1984). With the ROSAT HRI, Primini et al. (1993) reported 86 sources brighter than erg s-1 in the central area of M~31, nearly half of which were found to vary when compared to previous Einstein observations. With a separation of about one year between the M~31 surveys, the ROSAT PSPC covered the entire galaxy twice and detected altogether 560 X-ray sources down to a limit of 5 erg s-1 (Supper et al. 1997, 2001, hereafter SHP97, SHL2001). The intensity of 34 of the sources varied significantly between the observations, and SSSs were established as a new class of M~31 X-ray sources (see also Kahabka 1999).
With the new generation of X-ray observatories, Chandra and XMM-Newton, up to now only parts of M~31 were surveyed. Deep Chandra ACIS-I and HRC observations of the central region (covered areas of 0.08 and 0.27 square degree) resolved 204 and 142 X-ray sources, respectively (Garcia et al. 2000; Kong et al. 2002b; Kaaret 2002). Three M~31 disk fields, spanning a range of stellar populations, were covered with short Chandra ACIS-S observations to compare their point source luminosity functions to that of the galaxy’s bulge (Kong et al. 2003a). A synoptic study of M~31 with the Chandra HRC covered in 17 epochs “most” of the disk (0.9 square degree) in short observations and resulted in mean fluxes and long-term light curves for the 166 objects detected (Williams et al. 2004). In these observations, several M~31 SNRs were spatially resolved (Kong et al. 2002a, 2003b) and bright XRBs in globular clusters and SSSs and quasisoft sources (QSSs) could be characterized (Di Stefano et al. 2002, 2004; Greiner et al. 2004). During the XMM-Newton guaranteed time program there were four observations of the central area of M~31 and three aimed at the northern and two at the southern disk. These observations were used to investigate the bright and variable sources and diffuse emission (Shirey et al. 2001; Osborne et al. 2001; Trudolyubov et al. 2001, 2004), and to derive source luminosity distributions (Trudolyubov et al. 2002a). In addition, the time variability and spectra of several individual XRBs have been studied in detail (e.g. Trudolyubov et al. 2002b; Barnard et al. 2003a, b; Mangano et al. 2004).
Here we present X-ray images and a source catalogue for the archival observations of M~31 combining the three XMM-Newton EPIC instruments and using only times of low background. For the source catalogue and source population study of these observations we analyzed the individual pointings and the merged data of the central area simultaneously in five energy bands in a similar way as described in our M~33 analysis in Paper I. The covered area of 1.24 square degree and limiting sensitivity is a significant improvement compared to the Chandra surveys, however, up to now only covers about 2/3 of the optical M~31 extent ( ellipse) with a rather inhomogeneous exposure.
2 Observations and data analysis
| M 31 field | Obs. id. | Obs. dates | Pointing direction | Offset ∗ | EPIC PN | EPIC MOS1 | EPIC MOS2 | ||||
|---|---|---|---|---|---|---|---|---|---|---|---|
| RA/DEC (J2000) | Filter+ | Filter+ | Filter+ | ||||||||
| (1) | (2) | (3) | (4) | (5) | (6) | (7) | (8) | (9) | (10) | (11) | (12) |
| Centre 1 (c1) | 0112570401 | 2000-06-25 | 0:42:36.2 | 41:16:58 | medium | 26.40(23.60) | medium | 29.92(29.64) | medium | 29.91(29.64) | |
| Centre 2 (c2) | 0112570601 | 2000-12-28 | 0:42:49.8 | 41:14:37 | medium | 9.81( 5.85) | medium | 12.24( 6.42) | medium | 12.24( 6.42) | |
| Centre 3 (c3) | 0112570701 | 2001-06-29 | 0:42:36.3 | 41:16:54 | medium | 27.65(21.83) | medium | 27.65(23.85) | medium | 27.65(23.86) | |
| North 1 (n1) | 0109270701 | 2002-01-05 | 0:44:08.2 | 41:34:56 | medium | 54.78(48.57) | medium | 57.31(55.68) | medium | 57.30(55.67) | |
| Centre 4 (c4) | 0112570101 | 2002-01-06/07 | 0:42:50.4 | 41:14:46 | thin | 60.79(48.11) | thin | 63.31(52.87) | thin | 63.32(52.86) | |
| South 1 (s1) | 0112570201 | 2002-01-12/13 | 0:41:32.7 | 40:54:38 | thin | 53.45(47.00) | thin | 53.76(51.83) | thin | 53.73(51.84) | |
| South 2 (s2) | 0112570301 | 2002-01-24/25 | 0:40:05.0 | 40:34:38 | thin | 29.31(22.23) | thin | 29.37(24.23) | thin | 29.38(24.24) | |
| North 2 (n2) | 0109270301 | 2002-01-26/27 | 0:45:28.6 | 41:55:26 | medium | 26.27(22.86) | medium | 26.54(25.22) | medium | 26.55(25.28) | |
| North 3 (n3) | 0109270401 | 2002-06-29/30 | 0:46:31.1 | 42:17:32 | medium | 51.39(41.28) | medium | 59.69(45.39) | medium | 59.69(45.53) | |
| Halo 4 (h4) | 0151580401 | 2002-02-06 | 0:46:15.9 | 41:20:25 | medium | 11.29(11.29) | medium | 12.91(12.91) | medium | 12.92(12.92) | |
Notes:
: Systematic offset in Ra and DEC in arcsec determined from correlations with 2MASS, USNO-B1 and Chandra catalogues
: all observations in full frame imaging mode
: Exposure time in units of ks after screening for high
background used for detection, for colour image in brackets (see text)
Table 1 summarizes the archival XMM-Newton (Jansen et al. 2001) EPIC (Strüder et al. 2001; Turner et al. 2001) observations which at least partly overlap with the inclination corrected optical M~31 ellipse. For each observation we give the field name and the abbreviation used in the text for the M~31 observation (Col. 1), the observation identification (2), date (3), pointing direction (4,5) and systematic offset (6), as well as filter and exposure time after screening for high background for EPIC PN (7,8), MOS1 (9,10), and MOS2 (11,12). For creating the full field colour image we had to apply an even more stringent background screening which resulted in the shorter exposure times given in brackets.
In the XMM-Newton observations the EPIC PN and MOS instruments were operated in the full frame mode providing a time resolution of 73.4 ms and 2.6 s, respectively. The medium filter was in front of the EPIC cameras in all but the observations c4, s1 and s2 which were performed with the thin filter. For creating the merged images and source detection we used medium and thin filter observations together. This procedure can be justified as the difference in absorption between the medium and soft filters corresponds to an = 1.1 cm-2, significantly lower than the Galactic foreground absorption.
We carefully screened the event files for bad CCD pixels remaining after the standard processing. To create a homogeneous combined colour image with similar background level for all fields we had to carefully screen the data for times of high background using the high energy (7–15 keV) background light curves provided by the SAS tasks epchain and emchain. For the images that were used for the source detection procedures in the individual fields we adopted a less stringent background screening which due to the then longer exposures allowed us to detect fainter sources. The good time intervals (GTI) were determined from the higher statistic PN light curves and also used for the MOS cameras. Outside the PN time coverage, GTIs were determined from the combined MOS light curves. The corresponding low background times for the individual observations are listed for the PN and MOS cameras in Table 1.
The archive contains four observations of the centre area of M~31 separated by half a year adding up to low background exposures for source detection of 124.6, 133.1 and 133.2 ks for EPIC PN, MOS1 and MOS2 cameras, respectively. In addition there are two pointings in the southern and three in the northern disk of M~31 that aimed for 60 ks exposure. Due to high background, for two of the observations the time usable for detection is significantly shorter (s2, n2). In addition the archive contains four shorter pointings into the halo of M~31 (h1–h4, PI Di Stefano). These observations mainly contain foreground and background objects as they were pointed far of the disk of the galaxy. Only observation h4 (11 ks low background) partly covers the disk and therefore is included in our analysis. In total, the observations in our analysis cover an area of 1.24 square degree.
The data are treated in a similar way as the M 33 data described in Paper I. We used five energy bands: (0.2–0.5) keV, (0.5–1.0) keV, (1.0–2.0) keV, (2.0–4.5) keV, and (4.5–12) keV as band 1 to 5. We intentionally split the (0.5–2.0) keV band used in the 1XMM XMM-Newton Serendipitous Source Catalogue111Prepared by the XMM-Newton Survey Science Centre Consortium (http://xmmssc-www.star.le.ac.uk/) to get on average a more homogeneous distribution of the source counts to the energy bands which leads to a better spread of the hardness ratio values and allows effective source classification (see Paper I and Sect. 5).
For PN we selected only “singles” (PATTERN = 0) in band 1, for the other bands “singles and doubles” (PATTERN 4). For MOS we used “singles” to “quadruples” (PATTERN 12). To avoid background variability over the PN images we omitted the energy range (7.2–9.2) keV in band 5 where strong fluorescence lines cause higher background in the outer detector area (Freyberg et al. 2004). To convert source count rates in the individual bands to fluxes we used count rate to energy conversion factors (ECF) for PN and MOS observations calculated for the epoch of observation and filters used, assuming the same spectrum as for the first XMM-Newton source catalogue, i.e. a power law spectrum with photon index 1.7 absorbed by the Galactic foreground column of 7 cm-2. As has been demonstrated in Table 2 of Paper I, ECF values only vary by about 20% for PN in energy bands 1 to 4 for different spectra like an absorbed 1 keV thin thermal model typical for SNRs or a 30 eV black body model typical for SSSs. The same is true for EPIC MOS, with the exception of the black body ECF in the 0.2–0.5 keV band where the MOS sensitivity is much lower. For the detection in the merged centre images (combining observations with thin and medium filter) we used averaged ECFs which may lead to wrong flux estimates of at maximum 5%.
For most sources band 5 just adds noise to the total count rate. If converted to fluxes due to the high ECF this noise often dominates the total flux. To avoid this problem we calculated count rates and fluxes for detected sources in the “XID” (0.2–4.5) keV band (bands 1 to 4 combined). While for most sources this is a good solution for extremely hard or soft sources there may still be bands just adding noise. This then leads to rate and flux errors that seem to wrongly indicate a lower source significance. A similar effect occurs for the all instrument rates and fluxes if a source is mainly detected in one instrument (e.g. soft sources in PN).
To classify the source spectra we computed four hardness ratios from the source count rates. These hardness ratios and errors are defined as
and ,
for i = 1 to 4, where and denotes count rates and corresponding errors in band i as defined above. In the standard source detection products hardness ratios and count rates in individual energy bands are not combined for all instruments. To improve statistics we calculated for all energy bands “all EPIC” count rates, fluxes and hardness ratios. We are aware that these products have some jitter in their meaning, as the relative integration times for individual sources in the EPIC instruments differ. Due to the better signal in the combined products they are still very valuable for source classification. For investigations needing accurate calibration the products for the individual instruments should be used that are also given.
We created for PN, MOS1 and MOS2 in each of the 5 energy bands mentioned above images, background images, exposure maps (without and with vignetting correction), masked them for acceptable detector area. For PN the background maps contain the contribution from the “out of time (OOT)” events (parameter withootset=true in task esplinemap). In contrast to our M~33 raster, the M~31 images (with the exception of the four observations towards the M~31 centre, c1, c2, c3, c4) only overlap at the edge of the field of view (FOV). We therefore searched for sources in each of these fields individually and only merged the centre fields for source detection. For visualization purposes we created images of all observations individually, for the centre and for the full area merging all EPIC instruments (see Sect. 4). To allow an easy merging of the galaxy centre images, we re-calculated for the events of all contributing observations projected sky coordinates with respect to reference position RA=00h42m450, DEC=41°15′00″(J2000), for the full field images with respect to reference position RA=00h43m240, DEC=41°24′00″(J2000), respectively.
To create event lists and images we used the latest calibration products for the linearisation of the EPIC MOS CCDs (MOS*_LINCOORD_0017.CCF) and EPIC boresight (XMM_BORESIGHT_0018.CCF). We verified with the source-rich M~31 centre pointings that PN and MOS source positions coincide to better than 0.5″. On the other hand there were still significant offsets between the observations that had to be corrected for before merging. For the centre observations these offsets were determined from source lists of the individual observations. We used the USNO-B1, 2MASS, and Chandra catalogues to define an absolute reference frame. The offets applied are listed in column 6 of Table 1. This finally resulted in a residual systematic position error of less than 0.5″.
The images for PN, MOS1 and MOS2 do not fully overlap at the borders due to the different FOV of the EPIC instruments. Nevertheless, we used the full area for source detection.
The data analysis was performed using tools in the SAS v6.0 and some later versions from the development area as specially mentioned, EXSAS/MIDAS 03OCT_EXP, and FTOOLS v5.2 software packages, the imaging application DS9 v3.0b6 and spectral analysis software XSPEC v11.2.
3 Source catalogue
We searched for sources using simultaneously images (5 energy bands and PN, MOS1 and MOS2 camera). For the pointings into the disk and halo of M~31 this procedure was applied to the individual observations. The centre pointings strongly overlap and we therefore merged the images to reach higher detection sensitivity. A preliminary source list created with the task boxdetect with a low likelihood threshold was used as starting point for the task emldetect v. 4.40. To resolve sources that overlap due to the PSF, we used parameter multisourcefit=4. We selected sources equivalent to a single camera likelihood of 10 by accepting sources in the combined fit which have a likelihood above 7. This procedure produced acceptable results when checked against the smoothed images (see Sect. 4). Two emission peaks were resolved into several sources with no sign of multiplicity from the smoothed images. In a specific detection run we found these sources (747 and 832) with a high likelihood for extent and that they can be characterized by a King beta model with a core radius of 30103 and 28312, respectively. We rejected spurious detections in extended emission around the centre. Finally we merged the source lists of the centre and individual pointings to the disk and ordered the sources according to increasing right ascension. For sources detected in more than one observation we included the parameters of that source in the catalogue that was found with the higher detection likelihood. A recurrent transient source was reported from Chandra and XMM-Newton observations (Garcia et al. 2000; Osborne et al. 2001; Williams et al. 2004). It is only visible during the short observation c2 and was not significantly detected above the central diffuse emission by the detection procedure in the merged centre observation. We therefore derived the source parameters of this source from just observation c2, and added them at the end of the catalogue. In total we detect 856 sources in the field.
The source parameters are summarized in Table 2 (EPIC combined products and products for EPIC PN, MOS1 and MOS2, separately) which is available in electronic form at the CDS.
Table LABEL:master gives the source number (Col. 1), detection field, from which the source was entered into the catalogue (2), source position (3 to 9) with uncertainty radius (10), likelihood of existence (11), integrated PN, MOS1 and MOS2 count rate and error (12,13) and flux and error (14,15) in the (0.2–4.5) keV XID band, and hardness ratios and errors (16–23). Hardness ratios are calculated only for sources for which at least one of the two band count rates has a significance greater than . Errors are the properly combined statistical errors in each band and can extend beyond the range of allowed values of hardness ratios as defined previously (–1.0 to 1.0). The EPIC instruments contributing to the source detection, are indicated in the “Val” parameter (Col. 24, first character for PN, second MOS1, third MOS2) as “T”, if inside the field of view (FOV), or “F”, if outside of FOV. There are 52 sources at the periphery of the FOV where only part of the EPIC instruments contribute. The positional error (10) does not include intrinsic systematic errors which amount to 05 (see above) and should be quadratically added to the statistical errors.
Table 2 then gives for EPIC PN exposure (25), source existence likelihood (26), count rate and error (27,28) and flux and error (29,30) in the (0.2–4.5) keV XID band, and hardness ratios and error (31–38). Columns 39 to 52 and 53 to 66 give the same information corresponding to Cols. 25 to 38, but now for the EPIC MOS1 and MOS2 instruments. Hardness ratios for the individual instruments were again screened as described above. From the comparison of the hardness ratios derived from integrated PN, MOS1 and MOS2 count rates (Cols. 16–23) and the hardness ratios of the individual instruments (Cols. 31–38, 45–52 and 59–66) it is clear that combining the instrument count rate information yielded significantly more hardness ratios above the chosen significance threshold.
Column 67 shows cross correlations with M~31 X-ray catalogues in the literature (see detailed discussion in Sect. 5). Only 364 sources in our catalogue correlate with previously reported M~31 X-ray sources, i.e. our catalogue doubles the number of known X-ray sources in M~31.
In the remaining columns of Table 2, we give cross correlation information with sources in other wavelength ranges, which is further described in Sect. 6. We only want to mention here, that we used the foreground stars, globular cluster sources and candidates, to verify the assumed source position errors. All but six of the 33 identifications and 100 candidates are located within the statistical plus systematic positional error given above.
The faintest sources detected have an XID band flux of 6.0 erg cm-2 s-1. The brightest source (50, XID band flux of 4.5 erg cm-2 s-1) is identified as AGN in the M~31 field. The brightest M~31 source (291, an XRB) has an XID band flux of 3.9 erg cm-2 s-1. The XMM-Newton detected sources in M~31 therefore cover an absorbed luminosity range of 4.4 erg s-1 to 2.8 erg s-1 in the XID band.
4 Images
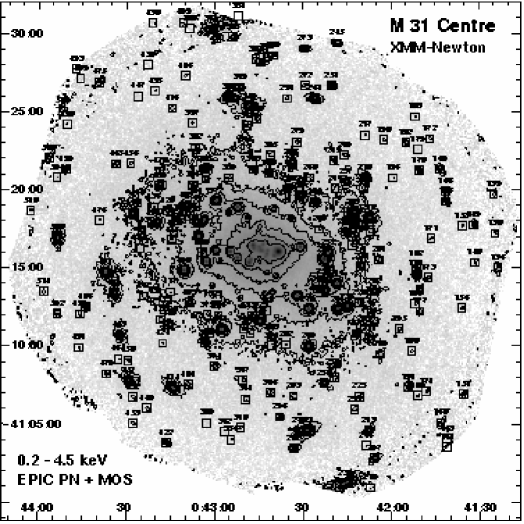
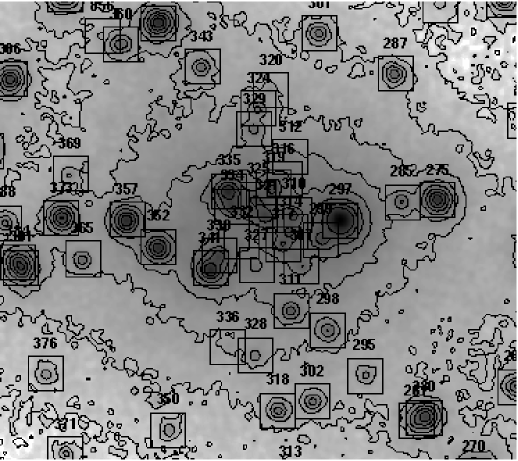
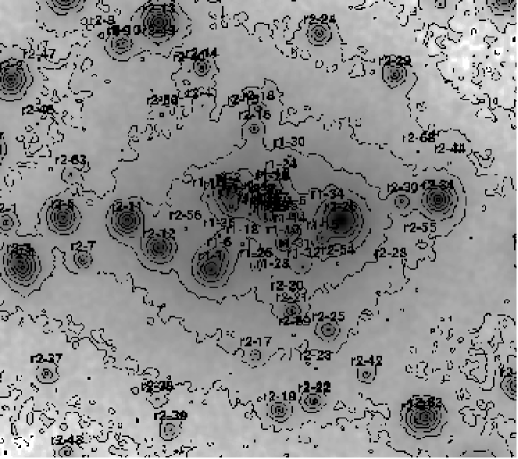
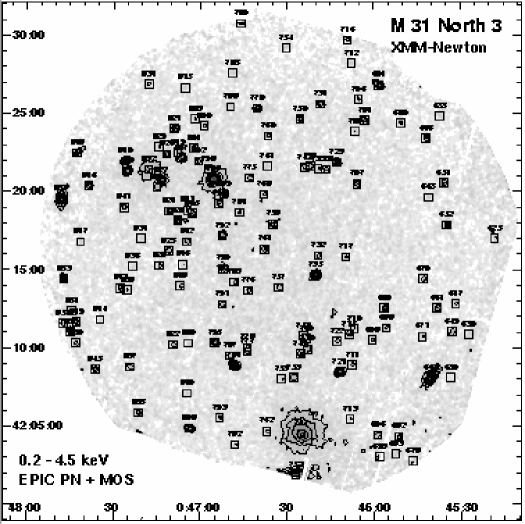
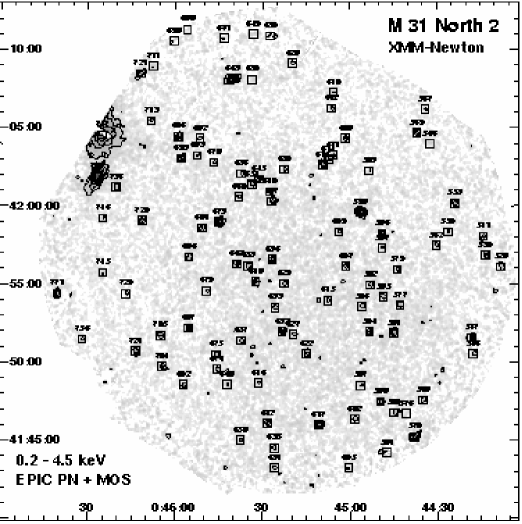
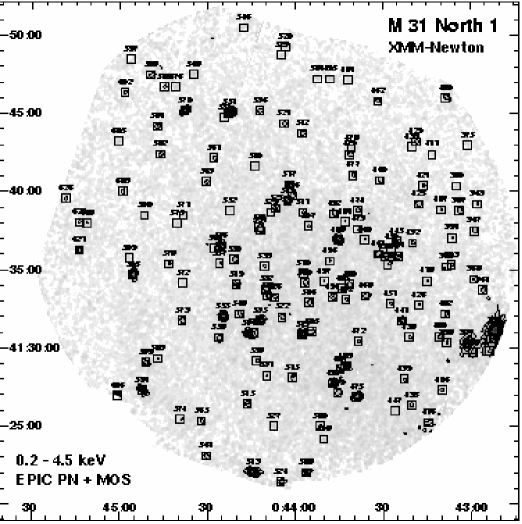
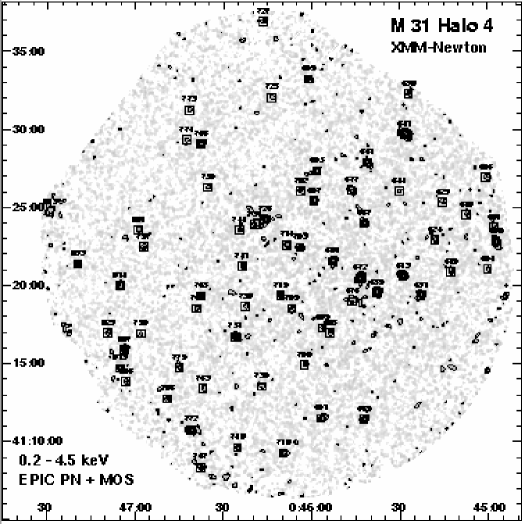
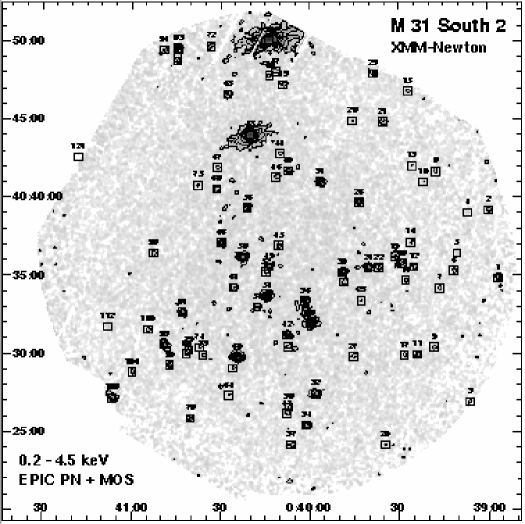
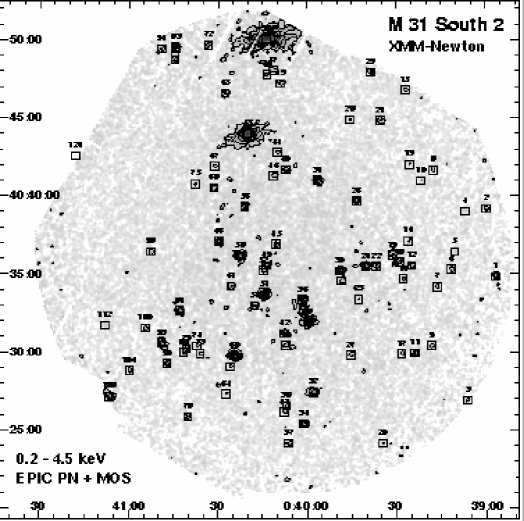
For Figs. 1, 3, 4, we smoothed the images and exposure maps used for detection with a Gaussian ( of 5″, 10″ and 20″, respectively). For PN we subtracted OOT images, that were masked and smoothed in the same way as the images. For the EPIC combined images we added the images of the individual cameras scaled according to the background in the individual energy bands. For the colour image Fig. 4, we added images for the individual bands as needed, masked them to a total un-vignetted exposure of 5 ks and indicated the optical extent of M~31 by the ellipse.
The (0.2–4.5) keV XID band images (Figs. 1, 3) give an overview on the sources detected in the XMM-Newton analysis. To better visualize faint structures we added contours. By comparing images in the different energy bands it is clear that many sources only show up in some of the images, a fact that indicates spectral diversity and is further quantified in the different hardness ratios of the sources. This fact can be visualized even more clearly in the combined EPIC colour image where we coded the (0.2–1.0) keV band in red, the (1.0–2.0) keV band in green and the (2.0–12) keV band in blue (see Fig. 4). The image is a demonstration of the colourful X-ray sky. SSSs, thermal SNRs and foreground stars appear red or yellow, XRBs, Crab-like SNRs and AGN green to blue. Bright diffuse emission fills the bulge and fainter emission the area of the disk (yellow and red, see also Fig. 1). A detailed analysis of this emission is outside the scope of this paper. XMM-Newton analysis of the diffuse emission of the M~31 bulge region was reported by Shirey et al. (2001) and Takahashi et al. (2004) and of the northern disk by Trudolyubov et al. (2004).
5 Cross-correlation with other M~31 X-ray catalogues
| SSHP97 source numbers | SHL2001 source numbers | |
|---|---|---|
| outside XMM-Newton field: | 1–24,27–33,35,37–41,46-48,50,52,54,58,60, | 1–32,34,35,37–43,45,47,50,52,53,55,57,58,60–63, |
| 61,65,70–72,78,79,81,85,87,88,91,95,98–100, | 66,67,69,74,75,77,78,80,81,83,85,87–91,93,98,100, | |
| 102,104,110,114,120,122,123,125,129,134, | 103,106,107,109,113,115–120,123,125,127,128,130, | |
| 135,137,148,154,159,169,171,180,183,185, | 131,133–135,141,145,146,149,155,158,160,164,165, | |
| 199,202,209,212,216,219,224,227,230,236, | 167,176,179,181,185,186,189,192,196,201,202,204, | |
| 237,242,245,246,257–260,264,265,268,269, | 205,210,215,220,221,224,225,228,233,234,239,243, | |
| 271,273–276,282,285–287,290,293,294,298, | 245,248,251–253,259,260,263–265,270,271,274,276, | |
| 300,305,312,314,318–320,327,335,339,341, | 278,280–282,284,290–293,295–298,300,302,305,309, | |
| 342,350,356,358,362–365,367,371,373,374, | 311,313,317,325,326,328,336,355,358,361,364–367, | |
| 376,377,381–383,385–396 | 369,371–373,375,377–379,381–383,387–396 | |
| resolved by XMM-Newton: | 131,177,186,198,200,211,220,250,370 | 129,177,178,183,191,193,195,197,206,214,254,272, |
| 374 | ||
| not detected, LH12: | (12 of 18 sources) | (3 of 21 sources) |
| 59,62,63,69,84,86,113,149,161,307,329,330 | 96,238,307 | |
| not detected, 12LH15: | (9 of 29 sources) | (2 of 17 sources) |
| 49,82,93,109,128,196,283,334,372 | 76,79 | |
| not detected, LH15: | (22 of 193 sources) | (18 of 167 sources) |
| 68(LH=14294),77(25),80(16),126(217), | 104(LH=901),121(94),171(43),173(317),190(216), | |
| 133(40),160(26),166(17),190(113),191(55), | 207(98),208(299),230(76),232(1166),246(40), | |
| 192(54),203(103),214(400),215(251), | 256(60),267(22),322(2703),324(148),344(41), | |
| 232(104),263(38),270(40),277(16),284(20), | 356(15),380(17),384(16) | |
| 309(82),325(21),331(20),340(28) |
In this section we discuss the cross-correlation of the XMM-Newton detected sources with sources reported in earlier X-ray catalogues. All correlations (together with other X-ray information like variability (v) or transient nature (t), reported in these catalogues as well as extent (ext) detected in this work) are indicated in the XID column of Table 2 (Col. 67).
From the 108 Einstein sources reported in Trinchieri & Fabbiano (1991, hereafter TF91), 14 are outside the field covered by the XMM-Newton observations \germanTeX([TF91] 6,””9,””11,””13,””15,””38,””81,””86,””95,””97,””98,””102,””106,””108). From the remaining 94 sources 22 are not detected in our analysis while they were clear Einstein detections \germanTeX([TF91] 29,””30,””31,””35,””37,””39,””40,””43,””46,””47,””53,””65,””66,””72,””75,””78,””88,””93,””96,””99,””100,””107) and have to be classified as transient. Three Einstein sources \germanTeX([TF91] 10,””70,””103) are resolved by XMM-Newton into two sources. Several of the transient candidates \germanTeX([TF91] 31,””39,””40,””46,””47,””53,””75,””78,””96) were already classified as transients \germanTeXor variable ([TF91] 37,””88) after the ROSAT HRI and PSPC observations (Primini et al. 1993, hereafter PFJ93, and SHL2001). On the other hand, the Einstein source [TF91] 84, classified as transient by SHL2001, was detected with XMM-Newton at an absorbed XID band luminosity of 1.5 erg s-1, about a factor of 8 below the luminosity reported by TF91 and a factor of two below the SHL2001 upper limit. This source therefore either is a recurrent transient or just highly variable.
In the correlation with ROSAT detected sources we concentrate on the catalogue of the central HRI pointing (PFJ93) performed in July 1990, and the first (July 1991) and second (August 1992) PSPC survey of the full galaxy (SHP97,SHL2001). With the HRI 86 sources are detected within the central 34′ of M~31. The XMM-Newton observations cover the full field and detect all but 7 of the sources. The missing sources \germanTeX([PFJ93] 1,””2,””31,””33,””51,””63,””85) are not in confused regions and covered the luminosity range (0.2–2.4) erg s-1. While \germanTeX[PFJ93] 1,””2,””85 were still detected in the first and/or second ROSAT PSPC survey, sources \germanTeX[PFJ93] 31,””33,””51,””63 were no longer active. All ROSAT HRI sources should have clearly been detected as bright sources in the XMM-Newton survey and the missing sources therefore have to be classified as transients.
The ROSAT PSPC surveys of M~31 contain 396 sources each, covering 6.3 and 10.7 deg2, an area much bigger than the 1.24 deg2 of the XMM-Newton survey. In Table 3 we list sources of SHP97 and SHL2001 that are not detected by XMM-Newton. From ROSAT PSPC survey I and II, 156 and 191 sources are outside the field covered by the XMM-Newton observations, 43 and 23 are not detected by XMM-Newton, respectively. For M~33 we found in Paper I that many of the sources with the lowest detection likelihoods LH were spurious detections. To search for similar effects in the M~31 ROSAT catalogues we arranged the ROSAT sources in the field, that are not detected by XMM-Newton according to LH. From the first ROSAT survey, we do not detect 12 out of 18 sources with LH below 12 and 9 out of 29 sources with LH below 15. These sources should have been detected by the deeper XMM-Newton observations if still at the ROSAT brightness. While in principle they all could have dimmed by such an amount that we do not detect them, this seems rather unlikely and probably most of these sources were spurious detections. They may have originated if a too low background has been used for the long observations (exposures up to 50 ks) taken during the “reduced pointing phase” of the ROSAT mission. As Table 3 shows this problem is not affecting the sources of the second ROSAT survey LH. There are many ROSAT PSPC sources detected with high LH that are missing in our XMM-Newton catalogue. Many of these sources have already been classified as transient comparing with the M~31 Einstein catalogue or just ROSAT survey I and II by SHP97 and SHL2001. At the position of one of these possible transients ([SHL2001] 240) we detect a source with a luminosity of 1.5 erg s-1 (if located in M~31), which is about a factor of 100 fainter than during the outburst detected by ROSAT.
There are Chandra catalogues of M~31 X-ray sources based on observations of the centre area with the ACIS-I (204 sources, 43 not detected by XMM-Newton, Kong et al. 2002b) and HRC (142 sources, 18 not detected by XMM-Newton, Kaaret 2002) detectors, and of shorter observations rastering part of the disk with the HRC (166 sources, 4 outside XMM-Newton field, 23 not detected by XMM-Newton, Williams et al. 2004). While the Chandra centre area surveys are fully covered by the XMM-Newton survey, the Chandra disk raster partly exceeds the field covered by the XMM-Newton observations. In addition to these larger Chandra survey papers, there are shorter lists of e.g. GlC sources and SSSs and reports of transients detected by Chandra. Correlations are given in the XID column of Table 2 and further references in the footnotes. While most of the Chandra detected sources can be resolved with XMM-Newton EPIC, there are sources close to the M~31 nucleus (319,321,325) or with arcsecond separation (360,366) that remain unresolved. Many of the Chandra sources not detected by XMM-Newton are rather faint (luminosities of a few erg s-1 in the centre area and down to erg s-1 further out in the bulge) and therefore not resolved from the surrounding diffuse emission. The remaining undetected Chandra sources are rather bright and all but one of them (source n1-77 from Williams et al. (2004)) are already classified as transient \germanTeX(s1-79,””s1-80,””r3-46,””s1-82,””r1-34,””r3-43,””r2-28,””r1-34,””s1-85,””r1-23,””r1-19,””n1-85).
Chandra spatially resolved several SNRs in M~31. Only some of them are detected by XMM-Newton (see Sect. 6.4).
Only lists of bright XMM-Newton sources were published up to now (see e.g. Osborne et al. 2001; Trudolyubov et al. 2004). All of these sources are contained in our catalogue. For bright sources in M~31, many photons were collected by the XMM-Newton EPIC cameras resulting in detailed light curves and spectra that could be analyzed in detail and allowed us to define the source class (see references in Table 2 and the discussion of source classes in the following section).
6 Classes of point-like X-ray sources detected in the direction of M~31
| Source type | Selection criteria | identified | classified |
|---|---|---|---|
| fg Star | and and or not defined | 6 | 90 |
| AGN | Radio source and not classification as SNR from or optical/radio | 1 | 36 |
| Gal | optical id with galaxy | 1 | |
| GCl | X-ray extent and/or spectrum | 1 | 1 |
| SSS | , or not defined, , not defined | 18 | |
| SNR | and and not a fg Star, or id with optical/radio SNR | 21 | 23 |
| GlC | optical id | 27 | 10 |
| XRB | optical id or X-ray variability | 7 | 9 |
| hard | or only and/or defined, and no other classification | 567 |
To identify the X-ray sources in the M~31 field we searched for correlations around the X-ray source positions within a radius of in the SIMBAD and NED archives and within several catalogues. In columns 68 to 73 of Table 2, we give extraction information from the USNO-B1 catalogue (name, number of objects within search area, distance, B2, R2 and I magnitude of the brightest object). To improve on the reliability of identifications we have used the B and R magnitudes to calculate , following Maccacaro et al. (1988, see Col. 74).
The X-ray sources in the catalogue are identified or classified based on properties in the X-ray (HRs, variability, extent) and of correlated objects in other wavelength regimes (Table 2, Cols. 75, 76). The criteria are summarized in Table 4 and are similar to the ones used in Paper I for M~33. However, one has to keep in mind, that M~31 is more massive than M~33 with more interstellar matter in the disk which in addition is more inclined. Therefore sources in or behind M~31 may suffer higher absorption than similar sources in the M~33 field. To take this into account, we compare our HRs to model HRs determined assuming Galactic foreground absorption and additional absorption within M~31 of 9 cm-2, a factor of 2 higher than in Paper I. We count a source as identified, if at least two criteria secure the identification. Otherwise, we only count a source as classified (indicated by pointed brackets).
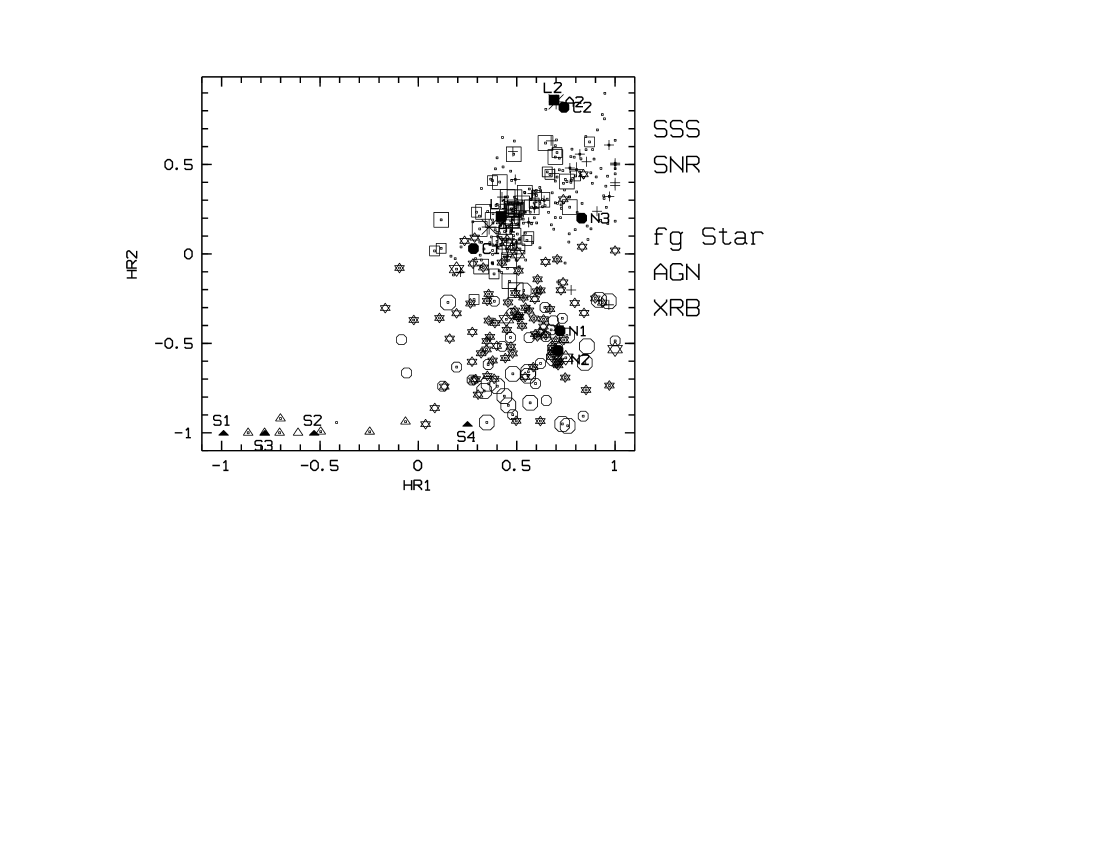
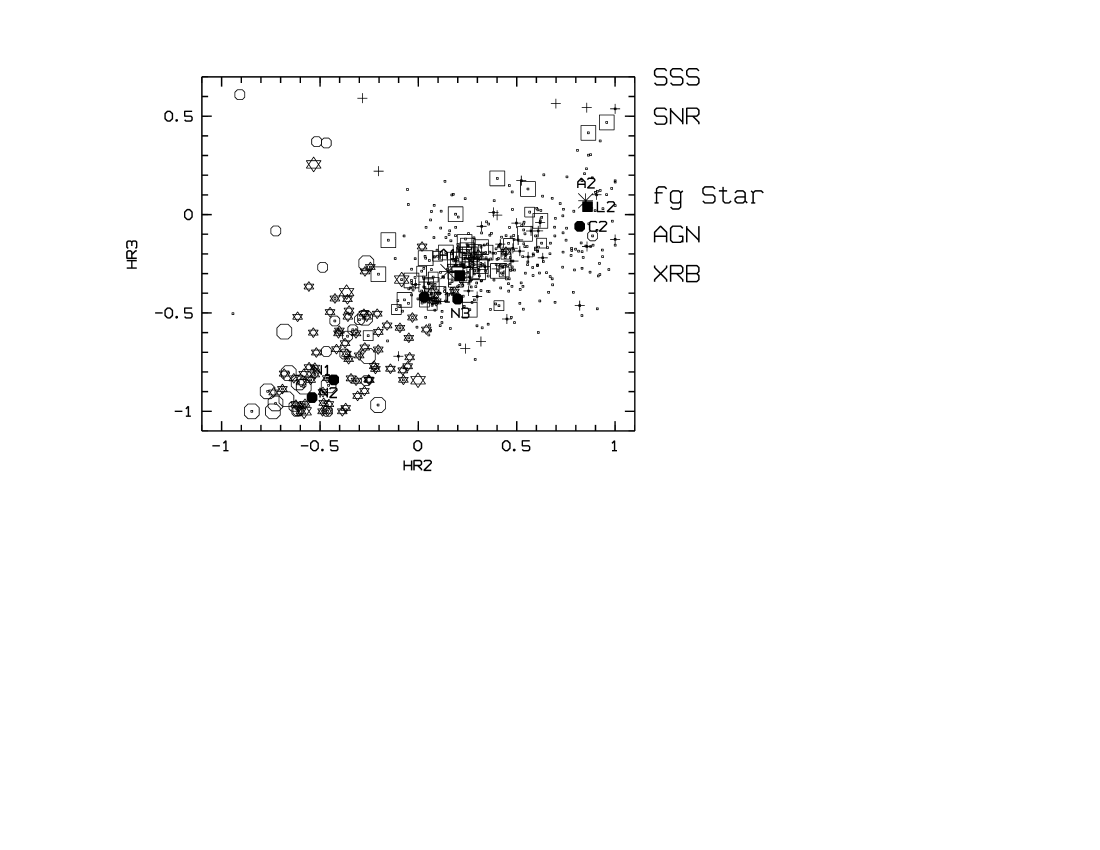
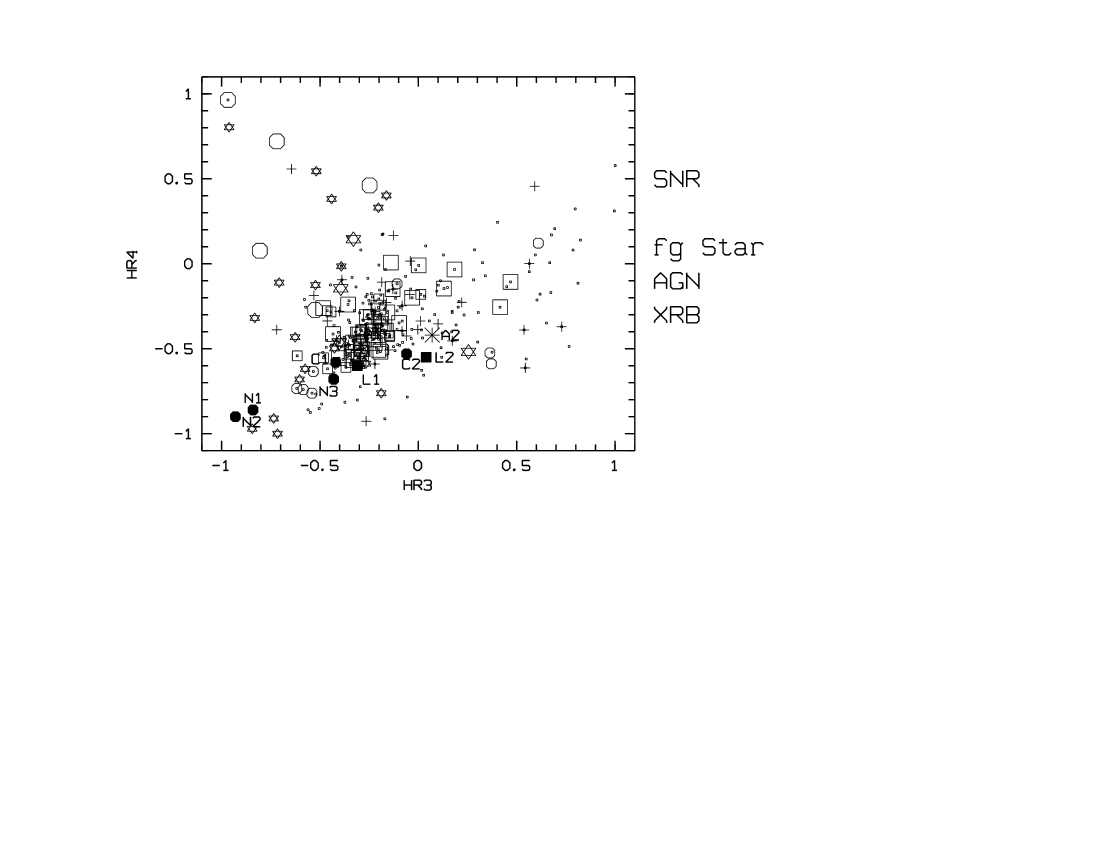
We plot X-ray colour/colour diagrams based on the HRs (see Fig. 5). Sources are plotted as dots if the error in both contributing HRs is below 0.2. Classified and identified sources are plotted as symbols even if the error in the contributing HRs is greater than 0.2. Symbols including a dot therefore mark the well defined HRs of a class. To identify areas of specific source classes in the plots, we over-plot colours of sources, derived from measured XMM-Newton spectra and model simulations.
Identification and classification criteria and results are discussed in detail in the subsections on individual source classes below. Many foreground stars, SSSs and SNRs can be classified or identified. However, besides a few clearly identified XRBs and AGN, and SNR candidates from positions in other wavelengths, we have no clear hardness ratio criteria (see below) to select XRBs, Crab-like SNR or AGN. They are all “hard” sources and we therefore introduced a class hard for sources with minus error greater than 0.2. In the following subsections we first discuss foreground and background sources in the catalogue and then sources within M~31. Thirty-eight sources remain unidentified or without classification.
6.1 Foreground stars (fg Star)
Foreground stars are a class of X-ray sources that is homogeneously distributed over the FOV of M~31. The good positioning of XMM-Newton and the available catalogues USNO-B1 and 2MASS allow us to effectively select this type of sources. All our foreground stars and candidates are 2MASS sources. We identified two sources (139 and 709) with stars of known type in the SIMBAD data base. Two sources (552 and 565) are W UMa type variables identified in the DIRECT program (Kaluzny et al. 1998; Stanek et al. 1999). Two sources (284 and 385) were globular cluster candidates that have been identified as foreground stars (Galleti et al. 2004). Their X-ray fluxes are in the range expected for these sources. In addition, we classify 90 sources as foreground stars (, see Maccacaro et al. (1988) and in addition and ). For several of the star candidates we estimate the type from the optical colours in the USNO-B1 catalogue using the stellar spectral flux library from Pickles (1998). For many candidates we can not determine the type from the optical colours. This may indicate that these sources are not isolated stars but more complicated systems or even in some cases galaxies. This expectation can for instance be confirmed for source 766, which is resolved into two sources in DSS2 images.
Several of the foreground star candidates close to the centre of M~31 (219,231,304,378,423,434) have no entry in the USNO-B1 catalogue, however, they are clearly visible on Digital Sky Survey images, they are 2MASS sources and fulfill the X-ray hardness ratio selection criteria. Therefore, we also classify them as foreground stars.
For three sources (2,802,835) the HRs indicate a foreground star, however, are (–0.98,–0.87,–0.81) slightly bigger than the assumed limit for classification. Comparing USNO-B1 and 2MASS optical magnitudes for these sources clearly indicates variability. Therefore, we still include them as foreground star candidates.
Searching for correlations in the SIMBAD database, we found that source 136 correlates with the recurrent nova Rosino 61. Rosino (1973) reports: “maxima of 16.4 pg and 17.7 pg have been respectively observed on August 12, 1966 and Oct 25, 1968. In both cases, the star was near maximum for only one or two days, rapidly declining below the limit of visibility. Although the apparent magnitude at maximum may be consistent with that of a nova at the distance of M~31, the light curve is abnormal, even for a recurrent nova. An alternative hypothesis is that the star may be not a nova, but a foreground U Gem variable, projected by chance over M~31.” The X-ray hardness ratios of the source and its 2MASS classification support the latter explanation and we therefore add the source as a foreground star candidate.
For seven sources \germanTeX(40,””78,””114,””206,””495,””562,””686), points at a stellar identification. However, the HRs including errors are outside the assumed limits for foreground stars. Source 686 in addition correlates with a radio source making it a good candidate for an AGN behind M~31.
Optical spectroscopy of all foreground star candidates is needed to prove the suggested identification.
6.2 Galaxies (Gal), galaxy clusters (GCl) and AGN
Already after the Einstein observations the X-ray bright source [TF91] 51 (315) was identified with the local group galaxy M 32. Mainly based on ASCA and ROSAT HRI observations, Loewenstein et al. (1998) argued that the X-ray emission is dominated by a LMXB, slightly offset from the black hole nucleus of M 32. Chandra observations allowed to resolve this central emission of M 32 into three sources, one coincident with the nucleus and the by far brightest source at an offset from the galaxy nucleus of 83 coincident with the position of the proposed LMXB (Ho et al. 2003). In addition to these sources, Williams et al. (2004) detected a bright X-ray transient in M 32 (s1-85). The XMM-Newton source 315 is positioned far off-axis in observation s1 and does not allow us to resolve the three Chandra sources close to the nucleus. The luminosity of 5 erg s-1 and HRs of the source are certainly dominated by the LMXB and typical for this source class (). The M 32 transient detected by Chandra, was not active during the XMM-Newton observation.
The brighter of the two extended sources in our survey (747) has been identified as a cluster of galaxies (GCl) at a redshift of z=0.293 based on the X-ray spectrum (Kotov et al. 2003). The second extended source (832) is detected in the northeast part of the n3 field outside the optical ellipse of M~31. We therefore classify this source as a GCl candidate.
There are no correlations with AGN with known redshift. However, the brightest X-ray source in the M~31 field (50) which was always active since the first Einstein observations correlates with a radio source and an unresolved optical object with a magnitude in the R band of 18.2. It has been identified as a BL Lac type AGN (NED).
In addition, we classify 36 sources as AGN based on SIMBAD, NED, and other radio source correlations (NVSS, Braun (1990), Gelfand et al. (2004)) with the additional condition of being not a SNR or SNR candidate from the X-ray HR. A final decision will only be possible from optical spectra as some of the sources may still be plerion type SNRs. In Fig. 5 we include typical HRs for an AGN spectrum (power law with photon index of 1.7 assuming Galactic foreground absorption (A1) and absorption of 9 cm-2 through M~31 (A2)). The AGN candidates populate the area in the HR diagrams expected from the model spectra. Many of the other sources in that HR diagram area – now just classified as hard – may turn out to be AGN.
6.3 Super-Soft Sources (SSSs)
SSSs show black body spectra with temperatures below 50 eV, radiate close to the Eddington luminosity of a 1 object and are believed to be white dwarf systems steadily burning hydrogen at the surface. They were identified as a class of X-ray sources by ROSAT and are often observed as transient X-ray sources (see Greiner 2000, and references therein). In the catalogue, SSSs are only classified using their HRs. To guide the classification we calculated SSS HRs assuming a 25 and 50 eV black body spectrum assuming Galactic foreground absorption (S1 and S3) and absorption of 9 cm-2 within M~31 (S2 and S4). At the high absorption, the sources would no longer be detectable with XMM-Newton as the intrinsic flux (expected to be around erg s-1) would be reduced by 5 and 4 orders of magnitude for the two model spectra, respectively. This led to the selection criteria in Table 4 and the classification of 18 M~31 SSSs. They are detected with absorbed XID band luminosities of 6 erg s-1 to 9 erg s-1. Only eight of the sources and the model values can be plotted in Fig. 5. For the other 10, is not determined.
One of the SSS candidates (430) was already detected by Einstein and ROSAT. It was found to be variable, however not classified as a SSS in the ROSAT survey which may be caused by nearby sources unresolved by the ROSAT PSPC. This source as well as another six \germanTeX(313,””320,””336,””359,””369,””431) were also detected by Chandra. Sources \germanTeX320,””336,””367,””431 were classified as supersoft transients (Williams et al. 2004; Di Stefano et al. 2004). Source 431 shows a 865s period in the XMM-Newton data reminiscent of a rotation period of a magnetized white dwarf (Osborne et al. 2001). Four of the sources correlate with optical novae \germanTeX(313,””347,””359,””456) and two correlate with 2MASS sources, indicating a dusty surrounding (191,401).
A special case is source 352, where indicates a SSS, however, is 0.94 and within the error not compatible with –1.0 and and are not undefined. Therefore we do not classify the source as a SSS. On the other hand, this source was classified as a variable SSS from Chandra observations (Di Stefano et al. 2004). It is detected by Einstein and ROSAT. There are several possibilities: Due to the position close to the centre of M~31 and the high source density in this region, XMM-Newton may not be able to resolve this source from nearby sources, the source detection may be fooled by the surrounding diffuse emission, or it is not a source with typical SSS properties.
Another source (395), classified as a transient SSS from Chandra observations (Williams et al. 2004; Di Stefano et al. 2004), has hard HRs in XMM-Newton and is classified here as XRB candidate.
In the discussion above already two sources (352,395) were mentioned that are also covered by the Chandra survey for SSSs and QSSs. In this survey, Di Stefano et al. (2004) determined 33 SSSs and QSSs using rates and hardness ratio criteria based on the Chandra ACIS-S (0.1–1.1), (1.1–2), and (2–7) keV bands. As the authors discuss, this survey not only selects classical SSSs as defined above but also includes sources with effective temperatures as high as 350 eV. This expectation is confirmed by the 16 sources of the catalogue which coincide with sources from the XMM-Newton catalogue. Here, three of them are classified as SSS candidates (320,336,369), one as SNR (154), three as SNR candidates (295,318,704), four as foreground star candidates (128,157,231,727), two as XRB candidates (321,395), and one even as hard (169).
6.4 Supernova remnants (SNR)
SNRs can be separated in sources where thermal components dominate the X-ray spectrum below 2 keV (examples are N132D in the Large Magellanic Cloud and 1E 0102.2–7219 in the Small Magellanic Cloud) and so called “plerions” with power law spectra (examples are the Crab nebula and N157B in the Large Magellanic Cloud). To guide the classification we calculated HRs from archival XMM-Newton spectra of these SNRs. Spectra of N132D (N1), 1E 0102.2–7219 (N2), and N157B (N3) can directly be compared to M~31 SNRs as they are seen through comparable foreground absorption. For the Crab nebula spectrum, we assumed Galactic foreground absorption (C1) and absorption of 9 cm-2 within of M~31 (C2). It is clear from Fig. 5, that “thermal” SNRs are located in areas of the X-ray colour/colour diagrams that only overlap with foreground stars. If we assume that we have identified all foreground star candidates from the optical correlation and inspection of the optical images, the remaining sources can be classified as SNRs with the criteria given in Table 4. Compared to our M~33 analysis in Paper I, we relaxed our selection a bit to adjust to the higher absorption in the M~31 disk.
Extensive searches for SNRs in M~31 were performed in the optical (Dodorico et al. 1980; Magnier et al. 1995, and references therein) and radio (Braun & Walterbos 1993). Before Chandra and XMM-Newton, M~31 X-ray sources were identified as SNR just by positional coincidence with optical and radio catalogues. Also for our catalogue, many X-ray sources correlate with optical and/or radio SNRs or radio sources (see Table 2). With Chandra and XMM-Newton, we now have the possibility to identify M~31 SNRs by their X-ray properties (extent, HRs, or spectra). Chandra observations of sources 260, 342 and 454 (Kong et al. 2002a; Williams et al. 2004) were analyzed in detail and the SNR nature determined by X-ray extent and optical/radio correlation. We count sources as SNR identifications (21) if they correlate with optical and/or radio SNRs or radio sources and fulfill the HR criteria (see above). We count sources as classified SNRs (23) if they either fulfill the HR criteria (22) or correlate with an optical/radio SNR (1). The SNRs and candidates cover an absorbed XID band luminosity range from 4 erg s-1 to 5 erg s-1. The 22 HR selected SNR candidates have just been selected from their X-ray properties and significantly enlarge the number of M~31 SNR candidates. For three of these sources, the classification may be questionable: From Chandra observations (Kong et al. 2002a), source 316 is classified as variable, and 295 and 318 correlate with a star of the catalogue by Haiman et al. (1994) .
A special case is source 642 with an XID band luminosity of 1.0 erg s-1, which correlates with the optical SNR candidate [MPV95] 1-013 (Magnier et al. 1995). The XMM-Newton HRs clearly point at a hard spectrum as expected for a plerion embedded in the M~31 disk. If the identification is correct this source would be the first plerion detected outside the Galaxy or the Magellanic Clouds. Final proof can only be achieved if the source turns out to be extended and shows no time variability.
Kong et al. (2003b) reported the Chandra detection of two additional resolved X-ray SNRs in the centre of M~31. The first of the sources lies about 40″ northeast of the XMM-Newton source pair 338,341, the second inbetween these two sources. With X-ray luminosities of (4 and 8) erg s-1 in the (0.3–7) keV band, they are too faint to be detected by XMM-Newton in the neighbourhood of the bright sources and surrounding diffuse emission.
6.5 Globular cluster sources (GlC)
A significant part of the luminous X-ray sources in the Galaxy and M~31 are found in globular clusters. Most of the GlCs in the Galaxy show bursts and therefore are low mass neutron star X-ray binaries (see e.g. Verbunt & Lewin 2004). There have been extensive surveys for globular clusters in M~31 in the optical and infrared band (see Magnier 1993, Galleti et al. 2004). From the ROSAT survey sources, SHL2001 identify 33 sources as GlCs. We correlated the XMM-Newton catalogue with the catalogues of Galleti et al. (2004) and Magnier (1993) and add one candidate, found in SIMBAD. We count sources as identifications (27) when the correlating source is listed as confirmed GlC in Galleti et al. (2004). The remaining correlations are counted as classified. Two sources (91,146), correlating with GlC candidates in Galleti et al. (2004) showed X-ray HRs typical of SNRs, source 91 correlates with an optical SNR candidate and both with radio sources. We therefore identify them as SNRs.
In Fig. 5, the GlCs are plotted with the same symbols as the XRBs. All of our GlC identifications and candidates have been reported in earlier work and many of them have been classified as time variable in X-rays (see Table 2). They cover an absorbed XID band luminosity range from 4.5 erg s-1 to 2.4 erg s-1. Only the brightest source (351) has a luminosity that seems to be at the upper end, allowed for neutron star LMXBs.
For source 414, Trudolyubov et al. (2002b) report intensity dips with a period of 2.78 hr reminiscent of a neutron star LMXB.
6.6 X-ray binaries (XRB)
As already mentioned in the introduction to this section, expected spectra of XRBs are similar to AGN and Crab-like SNRs. To guide the classification we calculated HRs as expected for low mass XRBs (5 keV thermal Bremsstrahlung spectrum assuming Galactic foreground absorption (L1) and absorption of 9 cm-2 within M~31 (L2)). High mass XRB (HMXB) spectra are expected to be even harder. As can be seen in Fig. 5 the different source classes do not separate.
Detailed work on individual sources using XMM-Newton and/or Chandra data, has identified four black hole XRBs (sources 257,287,310,384, Barnard et al. 2003b; Trudolyubov et al. 2001; Barnard et al. 2004), three neutron star LMXBs (297,353,403, Barnard et al. 2003b; Kaaret 2002; Mangano et al. 2004) and an XRB pulsar (544 Trudolyubov et al. 2004). In addition, we classify X-ray transients from XMM-Newton and/or Chandra data as XRB candidates. While in general transient behaviour of bright X-ray sources indicates an XRB nature, in this selection we may also pick up variable background sources. Such a source may be (405) which also correlates with a radio source. The XRBs selected in this way cover the same area in the X-ray colour/colour diagrams as the GlCs (see Fig. 5). The absorbed XID band luminosities range from 8.4 erg s-1 to 2.8 erg s-1.
Besides the Chandra transients covered in the XMM-Newton catalogue, we identified many transients in earlier catalogues in Sect. 5 that are further XRB candidates. There certainly are more transients XRBs buried in the XMM-Newton catalogue which only could be discovered by a detailed comparison of fluxes of all the XMM-Newton sources with earlier missions. Such an analysis was outside the scope of this work and, due to the lower sensitivity of the catalogues before XMM-Newton and Chandra, transient sources detected on this basis may be less reliable. On the other hand, also X-ray sources classified as variable may turn out to be XRBs. However, this criterion is not unique as it would also cover many variable background sources. Up to now no high mass XRBs are identified in M~31. Several identifications with emission line objects (EmO) in SIMBAD may be good candidates for Be-type high mass XRB.
All the candidates mentioned above need further X-ray work to confirm an XRB nature.
7 Summary
We present a catalogue of 856 X-ray sources based on archival XMM-Newton observations covering an area of 1.24 square degree. We correlate our sources with earlier M~31 X-ray catalogues and use information from optical, infra-red and radio wavelengths and in addition their X-ray properties for source classification. We applied a source classification scheme similar to the one successfully used in Paper I for M~33. As M~31 sources we detect 21 SNRs and 23 SNR candidates, 18 SSS candidates, 7 XRBs and 9 XRB candidates, as well as 27 GlCs and 10 GlC candidates, which most likely are low mass XRBs within the GlC. Comparison to earlier X-ray surveys reveals transients not detected with XMM-Newton, which add to the number of M~31 XRBs. The number of 44 SNRs and candidates more than doubles the X-ray detected SNRs. 22 sources are new SNR candidates in M~31 based on X-ray selection criteria. Another SNR candidate may be the first plerion detected outside the Galaxy and the Magellanic Clouds. On the other hand, six sources are foreground stars and 90 foreground star candidates, one is a BL Lac type AGN and 36 are AGN candidates, one source coincides with the Local Group galaxy M 32, one with a background galaxy cluster and another is a GCl candidate, all sources not connected to M~31.
There are 567 sources classified as hard, which may either be XRBs or Crab-like SNRs in M~31 or background AGN. If source variability is detected SNRs may be excluded from source identification. Thirty-eight sources remain unidentified or without classification.
The archival XMM-Newton M~31 observations allowed us to probe the point source population of the covered area significantly deeper than during the ROSAT PSPC surveys. However, the XMM-Newton EPIC coverage is rather inhomogeneous and a significant part of the M~31 disks has not been observed at all. To get a full census of the M~31 X-ray point sources it would be very important to fully cover this nearby galaxy with XMM-Newton observations.
Acknowledgements.
This publication makes use of the USNOFS Image and Catalogue Archive operated by the United States Naval Observatory, Flagstaff Station (http://www.nofs.navy.mil/data/fchpix/), of data products from the Two Micron All Sky Survey, which is a joint project of the University of Massachusetts and the Infrared Processing and Analysis Center/California Institute of Technology, funded by the National Aeronautics and Space Administration and the National Science Foundation, of the SIMBAD database, operated at CDS, Strasbourg, France, and of the NASA/IPAC Extragalactic Database (NED) which is operated by the Jet Propulsion Laboratory, California Institute of Technology, under contract with the National Aeronautics and Space Administration. The XMM-Newton project is supported by the Bundesministerium für Bildung und Forschung / Deutsches Zentrum für Luft- und Raumfahrt (BMBF/DLR), the Max-Planck Society and the Heidenhain-Stiftung.?refname?
- Barnard et al. (2003a) Barnard, R., Kolb, U., & Osborne, J. P. 2003a, A&A, 411, 553
- Barnard et al. (2004) Barnard, R., Kolb, U., & Osborne, J. P. 2004, A&A, 423, 147 (BKO2004)
- Barnard et al. (2003b) Barnard, R., Osborne, J. P., Kolb, U., & Borozdin, K. N. 2003b, A&A, 405, 505 (BKO2003)
- Blair et al. (1981) Blair, W. P., Kirshner, R. P., & Chevalier, R. A. 1981, ApJ, 247, 879
- Braun (1990) Braun, R. 1990, ApJS, 72, 761 (B90)
- Braun & Walterbos (1993) Braun, R. & Walterbos, R. A. M. 1993, A&AS, 98, 327 (BW93)
- Collura et al. (1990) Collura, A., Reale, F., & Peres, G. 1990, ApJ, 356, 119 (CRP90)
- Crampton et al. (1984) Crampton, D., Hutchings, J. B., Cowley, A. P., Schade, D. J., & van Speybroeck, L. P. 1984, ApJ, 284, 663
- de Vaucouleurs et al. (1991) de Vaucouleurs, G., de Vaucouleurs, A., Corwin, H. G., et al. 1991, Third Reference Catalogue of Bright Galaxies (Volume 1-3, XII, 2069 pp. 7 figs.. Springer-Verlag Berlin Heidelberg New York)
- Di Stefano et al. (2002) Di Stefano, R., Kong, A. K. H., Garcia, M. R., et al. 2002, ApJ, 570, 618 (DKG2002)
- Di Stefano et al. (2004) Di Stefano, R., Kong, A. K. H., Greiner, J., et al. 2004, ApJ, 610, 247
- Dodorico et al. (1980) Dodorico, S., Dopita, M. A., & Benvenuti, P. 1980, A&AS, 40, 67 (DDB80)
- Freyberg et al. (2004) Freyberg, M., Briel, U., Dennerl, K., et al. 2004, in Proc. SPIE, X-Ray and Gamma-Ray Instrumentation for Astronomy XIII, K.A. Flanagan; O.H.W. Siegmund; Eds., Vol. 5165, 112
- Galleti et al. (2004) Galleti, S., Federici, L., Bellazzini, M., Fusi Pecci, F., & Macrina, S. 2004, A&A, 416, 917 (GFB2004)
- Garcia et al. (2000) Garcia, M. R., Murray, S. S., Primini, F. A., et al. 2000, ApJ, 537, L23
- Gelfand et al. (2004) Gelfand, J. D., Lazio, T. J. W., & Gaensler, B. M. 2004, ApJS, 155, 89
- Greiner (2000) Greiner, J. 2000, New Astronomy, 5, 137
- Greiner et al. (2004) Greiner, J., Di Stefano, R., Kong, A., & Primini, F. 2004, ApJ, 610, 261
- Haiman et al. (1994) Haiman, Z., Magnier, E., Lewin, W. H. G., et al. 1994, A&A, 286, 725
- Ho et al. (2003) Ho, L. C., Terashima, Y., & Ulvestad, J. S. 2003, ApJ, 589, 783
- Holland (1998) Holland, S. 1998, AJ, 115, 1916
- Jansen et al. (2001) Jansen, F., Lumb, D., Altieri, B., et al. 2001, A&A, 365, L1
- Kaaret (2002) Kaaret, P. 2002, ApJ, 578, 114 (K2002)
- Kahabka (1999) Kahabka, P. 1999, A&A, 344, 459
- Kaluzny et al. (1998) Kaluzny, J., Stanek, K. Z., Krockenberger, M., et al. 1998, AJ, 115, 1016 (KSK98)
- Kong et al. (2003a) Kong, A. K. H., DiStefano, R., Garcia, M. R., & Greiner, J. 2003a, ApJ, 585, 298
- Kong et al. (2002a) Kong, A. K. H., Garcia, M. R., Primini, F. A., & Murray, S. S. 2002a, ApJ, 580, L125 (KGP2002)
- Kong et al. (2002b) Kong, A. K. H., Garcia, M. R., Primini, F. A., et al. 2002b, ApJ, 577, 738
- Kong et al. (2003b) Kong, A. K. H., Sjouwerman, L. O., Williams, B. F., Garcia, M. R., & Dickel, J. R. 2003b, ApJ, 590, L21
- Kotov et al. (2003) Kotov, O. V., Trudolyubov, S., & Vestrand, W. T. 2003, ApJ, submitted (astro-ph/0307223)
- Loewenstein et al. (1998) Loewenstein, M., Hayashida, K., Toneri, T., & Davis, D. S. 1998, ApJ, 497, 681
- Maccacaro et al. (1988) Maccacaro, T., Gioia, I. M., Wolter, A., Zamorani, G., & Stocke, J. T. 1988, ApJ, 326, 680
- Magnier et al. (1995) Magnier, E. A., Prins, S., van Paradijs, J., et al. 1995, A&AS, 114, 215 (MPV95)
- Mangano et al. (2004) Mangano, V., Israel, G. L., & Stella, L. 2004, A&A, 419, 1045 (MIS2004)
- Osborne et al. (2001) Osborne, J. P., Borozdin, K. N., Trudolyubov, S. P., et al. 2001, A&A, 378, 800 (OBT2001)
- Pickles (1998) Pickles, A. J. 1998, PASP, 110, 863
- Pietsch et al. (2004) Pietsch, W., Misanovic, Z., Haberl, F., et al. 2004, A&A, 426, 11 (Paper I)
- Primini et al. (1993) Primini, F. A., Forman, W., & Jones, C. 1993, ApJ, 410, 615 (PFJ93)
- Rosino (1973) Rosino, L. 1973, A&AS, 9, 347 (R73)
- Shirey et al. (2001) Shirey, R., Soria, R., Borozdin, K., et al. 2001, A&A, 365, L195
- Stanek & Garnavich (1998) Stanek, K. Z. & Garnavich, P. M. 1998, ApJ, 503, L131
- Stanek et al. (1999) Stanek, K. Z., Kaluzny, J., Krockenberger, M., et al. 1999, AJ, 117, 2810 (SKK99)
- Stark et al. (1992) Stark, A. A., Gammie, C. F., Wilson, R. W., et al. 1992, ApJS, 79, 77
- Strüder et al. (2001) Strüder, L., Briel, U., Dennerl, K., et al. 2001, A&A, 365, L18
- Supper et al. (2001) Supper, R., Hasinger, G., Lewin, W. H. G., et al. 2001, A&A, 373, 63 (SHL2001)
- Supper et al. (1997) Supper, R., Hasinger, G., Pietsch, W., et al. 1997, A&A, 317, 328 (SHP97)
- Takahashi et al. (2004) Takahashi, H., Okada, Y., Kokubun, M., & Makishima, K. 2004, ApJ, 615, 242
- Trinchieri & Fabbiano (1991) Trinchieri, G. & Fabbiano, G. 1991, ApJ, 382, 82 (TF91)
- Trudolyubov et al. (2004) Trudolyubov, S., Kotov, O., Priedhorsky, W., Cordova, F., & Mason, K. 2004, ApJ, submitted (astro-ph/0401227) (TKP2004)
- Trudolyubov et al. (2001) Trudolyubov, S. P., Borozdin, K. N., & Priedhorsky, W. C. 2001, ApJ, 563, L119 (TBP2001)
- Trudolyubov et al. (2002a) Trudolyubov, S. P., Borozdin, K. N., Priedhorsky, W. C., Mason, K. O., & Cordova, F. A. 2002a, ApJ, 571, L17 (TBP2002)
- Trudolyubov et al. (2002b) Trudolyubov, S. P., Borozdin, K. N., Priedhorsky, W. C., et al. 2002b, ApJ, 581, L27
- Tully (1988) Tully, R. B. 1988, Nearby galaxies catalog (Cambridge and New York, Cambridge University Press)
- Turner et al. (2001) Turner, M. J. L., Abbey, A., Arnaud, M., et al. 2001, A&A, 365, L27
- van Speybroeck et al. (1979) van Speybroeck, L., Epstein, A., Forman, W., et al. 1979, ApJ, 234, L45
- Verbunt & Lewin (2004) Verbunt, F. & Lewin, W. H. G. 2004, in Compact Stellar X-ray Sources, in press (astro–ph/0404136)
- Williams et al. (2004) Williams, B. F., Garcia, M. R., Kong, A. K. H., et al. 2004, ApJ, 609, 735 (WGK2004)