Abstract
Galaxies undergoing formation and evolution can now be directly observed over a time baseline of some 12 Gyr. An inherent difficulty with high–redshift observations is that the objects are very faint and the best resolution (HST) is only kpc. Such studies thereby combine in a highly synergistic way with the great detail that can be obtained for nearby galaxies through ”archaeological” studies. Remarkable advances are being made in many areas, due to the power of our observatories on the ground and in space, particularly the unique capabilities of the HST ACS. Three new developments are highlighted. First is the derivation of stellar masses for galaxies from spectral energy distributions (SEDs) using HST and now Spitzer data, and dynamical masses from both sub–mm observations of CO lines and near–IR observations of optical nebular lines like H. A major step has been taken with evidence that points to the LBGs having masses that are a few . Second is the discovery of a new population of red, evolved galaxies, again at redshifts which appear to be the progenitors of the more massive early–type galaxies of today, with dynamical masses around a few . Third are the remarkable advances that have occurred in characterizing drop–out galaxies (LBGs) to and beyond, less than 1 Gyr from recombination. The HST ACS has played a key role here, with the dropout technique being applied to and images in several deep ACS fields, yielding large samples of these objects. This has allowed a detailed determination of their properties (e.g., size, color), and meaningful comparisons against lower–redshift dropout samples. The use of cloning techniques has overcome many of the strong selection biases that affect the study of high redshift populations. A clear trend of size with redshift has been identified, and its impact on the luminosity density and star formation rate estimated. There is a significant, though modest, decrease in the star formation rate from redshifts out through . The latest data also allow for the first robust determination of the luminosity function at . Last, but not least, the latest UDF ACS (optical) and NICMOS (near–IR) data has resulted in the detection of some galaxies at .
keywords:
Galaxy Formation, Galaxy Evolution, High Redshift Galaxies[From to : Unearthing Galaxies at the Edge of the Dark Ages] From to : Unearthing Galaxies at the Edge of the Dark Ages
1 Watching Galaxies Form and Grow
Direct observation of galaxies in their formative stages is proving to be an extremely powerful approach for understanding how galaxies form and grow. The key physical processes are, in principle, directly observable. However, the primary challenge for direct observations is that high redshift galaxies are faint and small, and the rest frame observations are often in the UV, a spectral region that has been poorly characterized locally – though current observations by GALEX are beginning to provide the needed benchmark.
A key consideration, of particular relevance for this workshop, is that studies of high redshift galaxies are complementary to what can be learned from nearby galaxies – although strongly synergistic may be a more appropriate characterization. The ability to do both extraordinarily detailed “archaeological” studies of nearby galaxies at one epoch (now) contrasts with the much more superficial characterization that can be carried out for distant galaxies. The resolution at high redshift, kpc arcsec-1 from to , is dramatically worse than can be achieved at , and presents a serious challenge, even with HST. The discussion that has taken place at this workshop about bars in galaxies is an example of how small changes in resolution (from WFPC2 to ACS) can lead to significant differences in conclusions about the properties of high redshift galaxies. Nonetheless the opportunity to measure the properties of galaxies directly, even at the global level, to within Gyr from the Big Bang, is exciting and valuable, even if the details are mostly lacking.
In the talk by Ken Freeman (this volume), a further example was given of how observations at high and low redshift combine to challenge our view of galaxy evolution. The thin disk of our galaxy appears to have been undisturbed for some 10 Gyr, corresponding to a relatively quiescent life since . Yet large disks appear to become rare around . Are we missing many such disks in our observations? Or were we just “lucky” in the Milky Way….?
A very interesting constraint on the nature of high redshift galaxies comes from the cosmic baryon budget as discussed by Fukugita, Hogan and Peebles (1998). They compiled a census of where the baryons are at . The vast majority are in gas or plasma (83%). Of the 17% locally that are in stars, 73% are in spheroids (bulges/ellipticals), 25% are in disks and 2% are in late-type galaxies. Thus a key issue at high-redshift (at ) is identifying and characterizing spheroid (bulge and elliptical) buildup. Most of the star formation at high redshift must be part of the buildup of spheroids, with different classes of objects (LBGs, evolved objects, SCUBA sources etc) exemplifying different phases of this process. This is particularly true if the 25% in disks was assembled relatively late – maybe after ?.
2 Observations at High Redshift
The observational goals of high–redshift galaxy studies have largely been to establish global properties, such as luminosity, sizes, colors, structure (scale lengths, shapes, etc), dust content, kinematics, etc. From these we hope to determine the galaxy luminosity function, stellar (from SEDs) and dynamical mass distributions, luminosity density and its evolution, star formation rate evolution, mass buildup, merging rate, AGN role, etc.
The lack of resolution and the inherent faintness of high–redshift galaxies results in a “morphology challenge”. This basic problem is further exacerbated by our difficulty in obtaining high spatial resolution observations in the rest–frame optical. Our high resolution images (HST ACS) are essentially all in the optical, which is in the rest–frame UV at . At these wavelengths, evolved populations become faint and the effect of dust is magnified. Comparisons (morphology, structure, shape, etc.) with low redshift optical samples are then subject to biases. High spatial resolution IR ( m) imaging such as that from WFC3 on HST, and later from JWST, are key steps that will alleviate this problem. Spitzer of course, will provide remarkably valuable data on high–redshift objects, but its very low spatial resolution precludes any measurement of structure.
From the perspective of high–redshift galaxy studies one of the most significant developments of the last decade has been a much needed refinement of the cosmological parameters. The large uncertainties in timescale that permeated galaxy formation discussions in the 1980s and 1990s have largely evaporated. The WMAP results (Bennett et al. 2003), combined with other constraints, have enabled us to compare timescales from local observations with redshift “ages” with increased confidence.
With Gyr, it is of interest to note a few timescales and epochs relevant for galaxy formation and evolution. Some useful numbers: corresponds to an age of Gyr; redshift 5 is when the universe is 10% of its current age; redshift 2 is at 25%, or about 3.4 Gyr from recombination; and redshift 0.8 corresponds to an age Gyr, when the universe was just half its present age. At the earliest times for galaxies, the universe appears to be reionized by , 1 Gyr from recombination, with reionization likely starting at (Kogut et al. 2003). This requires that the first UV-bright stars occurred within Gyr of recombination. Since the first QSOs are seen at , deep potential wells must be in place by that time (within Gyr of the first stars forming!).
By , all the significant elements of the classic Hubble sequence seem to be in place (though not necessarily in the same proportions as today). This is rather striking. We tend to be rather cavalier about the epoch, treating it as but a “slightly modified version of now”. Yet is around Gyr ago, more than half the age of the universe. It is fascinating to think that the galaxy population of today was largely in place by , and that this buildup happened between , or somewhat before, and , or over a timespan of only a few Gyr.
Another way of describing this change is to note that around is when the morphological characteristics of galaxies appear to undergo a change to much less structured forms (even taking into account the tendency of UV observations to enhance star–forming regions relative to older, smoother populations). Much less regular galaxies, like those common in the deepest HST images (the HDFs and the UDF), appear to become the dominant forms. For galaxies, one could think of three epochs: “reionization” at , the “weird” ages from , and the “normal” galaxy epoch from onwards. Dramatic examples of galaxies at higher redshifts can be seen in the HST UDF images (see, e.g., the color plate in this volume from the UDF). A fascinating recent result is that the star formation rate (and mass buildup) in galaxies is approximately constant from to (the first 50% of time) and then decreases significantly () to .
A well-known, but nonetheless extremely critical observational problem for studies of high–redshift galaxies is that surface brightness goes as . This surface brightness dimming dramatically impacts the detectability of galaxies at high redshift (corresponding to 600 – or 7 mag – from to ).
3 HST ACS
We are fortunate to have a number of powerful new tools with which carry out the needed observations. The remarkable new spectrographs on large ground-based telescopes (DEIMOS, VIRMOS, IMACS, for example) have revolutionized our ability to take large numbers of redshifts. HST, Chandra and Spitzer each contribute unique and important information on the nature of high–redshift objects. Arguably though, it is the Advanced Camera on HST (Ford et al. 2003) that is providing the most valuable and unique data at this time (though the impact of Spitzer will undoubtedly grow). High–redshift galaxies are small, and therefore it has only been through the capabilities of HST and the ACS that we have been able see structural details. In short, the advent of the HST ACS has greatly increased our ability to “watch galaxies form and grow”. The sensitivity, resolution and excellent filter set have provided us with images from which large samples of high–redshift galaxies can be derived. Of particular interest are those galaxies with red enough colors to qualify as –dropouts – galaxies at redshifts , within 1 Gyr of recombination. Such objects have been the focus of a number of papers over the last year (e.g., Bouwens et al. 2003b, Stanway et al. 2003, Yan et al. 2003, Dickinson et al. 2004). Spectroscopic confirmation is beginning to appear (e.g., Bunker et al. 2003, Dickinson et al. 2004, Stanway et al. 2004), but such observations are challenging, as Weymann et al. (1998) demonstrated with their object, which took over 7 hours of integration on Keck.
Given the crucial and central role that HST plays in studies of high–redshift galaxies, it is worthwhile listing those fields that are playing a starring role in our collective efforts to push the frontiers on the properties of distant galaxies. In addition to the time-honored WFPC2 HDF–N and HDF–S fields, there are now several HST ACS datasets with deep observations in multiple filters (broadly ). For the highest redshift galaxies the key filters are the two that are new on HST, the ACS and filters, which are perfect for detecting galaxies, i.e., –dropouts. The new ACS fields are the Great Observatories Origins Deep Fields (GOODS) CDF–S and HDF–N, the Hubble Ultra-Deep Field (UDF), and the two UDF–Parallel fields UDF–Ps (which are deeper than the original HDFs). Most of the UDF has also been imaged with NICMOS in and , giving a very deep dataset that complements the ACS optical filter data. The UDF data is deep, with a limiting magnitude of AB mag in and AB mag in in the UDF–IR image.
4 High-Redshift Galaxies - Issues/Questions
The breadth of studies on high redshift galaxies can be exemplified by noting some of the questions which are actively being addressed in current observational programs:
When did the first galaxies begin to grow (at , by ?)
When were the first giant Es assembled?
What are the sub-mm (SCUBA) galaxies? – and are they an important contributor to the mass density?
Are we missing a significant fraction of assembling galaxies (dusty reddened objects – a key area for Spitzer)?
Do we really have a good estimate of the star formation history of the universe SFR(z)? Are our dust estimates right?
How/when do disks form – and how common are large disks at or even 2+? What is the role of bars in evolution at high redshift?
What is the mass assembly history? We see light, but what really counts is mass (and that is really important for the connection to theory).
Why are black hole masses and galaxy velocity dispersions so tightly related? When did the first massive black holes buildup in galaxies?
What was the role of AGNs in early galaxy evolution?
What are the progenitors of the 50% (?) of todays E/SO population that have formed since then?
5 High-Redshift Galaxies - Current Frontiers
The capabilities of the current generation of large ground-based telescopes (like Keck, the VLT, Gemini and Magellan), combined with the Great Observatories (HST, Chandra, Spitzer) have led to the initiation of numerous studies of the intermediate–to–high–redshift universe. On–going examples, which were discussed at this workshop, are the VIRMOS, DEEP, GEMS, COSMOS and GOODS surveys. They will provide great insight into the nature of the universe at . Complementary to these studies of field galaxies are programs on clusters like that described by at this meeting by Holland Ford. This ACS GTO team program focuses on rich clusters of galaxies out to , with an extension to protoclusters at high–redshift, as described by George Miley.
A key part of these surveys is the characterization of galaxies at intermediate redshift through kinematical measures (velocity dispersion and rotation curves) of very large samples, as described by David Koo for example, for the DEEP survey. A number of groups are focusing on deriving fundamental plane parameters for both field and cluster galaxies out to , and beyond.
A subject of great interest is understanding the nature of the powerful sub–mm sources (e.g., SCUBA sources) and establishing their redshifts and properties. Considerable progress is occurring in this area, but truly astonishing gains will come about when ALMA comes on line. LIRGS and ULIRGS at high redshift will continue to be the focus of considerable effort in the future.
The nature of Lyman break galaxies (LBGs) at is starting to become clearer, as IR and kinematical data begin to establish their stellar and dynamical masses. Many important studies are continuing on these sources. A related activity is assessing the properties of galaxies in the redshift “desert” at . Recent results, for both star–forming and evolved galaxies in this redshift range, will prove to be very valuable in finally establishing the star formation history of the universe across the full redshift range.
These studies, and others, will benefit from major new datasets, particularly from Spitzer (e.g., the GTO programs, and Legacy surveys like GOODS) and HST deep fields (like the GOODS CDF–S and HDF–N, UDF, UDF–Ps, and UDF–IR from NICMOS), combined with Chandra data, and with ground–based spectra from 8-m class telescopes (and then from ALMA).
Spitzer, in particular, will provide a valuable addition to the photometry (optical and IR) now available for large samples of galaxies, extending the wavelength baseline by a factor of 10 or more, thereby improving our leverage to constrain the stellar mass. The IR data will largely free us from the tyranny of uncertain M/Ls that abound in purely optical (rest–frame UV) studies of star–forming (or recently star–forming) galaxies. Some initial studies demonstrated the value of measuring the stellar mass buildup history of galaxies (e.g., Dickinson et al. 2003). Galaxy stellar masses have also recently been derived from early Spitzer IRAC observations (Barmby et al. 2004).
It is clear that a vast number of surveys and studies are under way, in a broad area, and it is impractical to give more than a superficial overview of them in this review. Instead we will concentrate on developments in three areas at the forefront. These all involve very recent developments on galaxies at . They include, in addition to the stellar masses derived from optical and near-IR rest-frame SEDs mentioned above, the dynamical masses from kinematical observations of LBG galaxies (e.g., Erb et al. 2003, Erb et al. 2004, Genzel et al. 2003); the nature of the red, evolved population of galaxies at high redshift, the galaxies of Franx et al. (2003) and van Dokkum et al. (2003, 2004); and the very high redshift samples of LBGs, the dropout samples at , and beyond from HST ACS (and NICMOS for the galaxies), e.g., as discussed by Bouwens et al. (2003b), Stanway et al. (2003), and Yan et al. (2003).
The current frontier for high redshift objects is at (the ACS UDF and NICMOS UDF–IR images together have extended the dropout sources to redshifts 7 and beyond, but the samples are small). Rapid changes in the properties of high redshift galaxies must occur beyond and so careful characterization of objects, even those separated by small intervals of time, is an important aspect of the study of galaxies. There is great value in having large samples of objects to contrast with the galaxies. Though only Gyr later in cosmic history, galaxies are larger and much better characterized than galaxies, providing key baseline information needed to evaluate evolutionary changes with redshift.
6 Masses of High-Redshift galaxies
Star formation is a continuing challenge for galaxy formation and evolution models. The physics is complex, and not well constrained by the observational evidence. There has been significant progress in the parameterization of the key steps in the models. However, enough discrepancies exist between the model (semi–analytic or hydro code) predictions of light and the observed photometric properties of galaxies that it behooves the observational astronomers to do all they can to measure mass scales for galaxies as a function of redshift. The more direct coupling with theory will be a key step in understanding the buildup of galaxies. Fortunately, a number of observational programs are beginning to give greater insight into the mass scales of galaxies at key epochs.
It is important to distinguish direct dynamical measures of mass from those that rely on SED fits and assumptions about the IMF to derive “stellar” masses. Both approaches have value, but significant assumptions go into the latter, which may not be valid in all cases or at all stages of the buildup of a galaxy (the IMF may change with time in star–forming regions). The challenges of actually measuring gas or stellar kinematics in high–redshift galaxies means that the derivation of stellar masses from SEDs is more widely used at this time. But both techniques provide valuable insights and are becoming increasingly common (see, e.g., Rudnick et al. 2003, Shapley et al. 2004).
For SED–fit stellar masses of high–redshift galaxies, most results have relied on rest–frame UV–optical observations, and were therefore subject to sizable uncertainties due to the effect on star formation on the measured ratios. This approach was nonetheless a valuable first step, and demonstrated the value of deriving the evolution of the global stellar mass density from , i.e., deriving the the mass buildup history of the universe. For example, Dickinson et al. (2003) used the HDF–N data, from the WFPC2 to the NICMOS –band IR data down to 26.5 mag (AB), determined photometric redshifts and rest-frame mag for a wide range of redshifts, and then derived stellar masses.
This approach to deriving stellar masses will mature as data from Spitzer become available for large samples. The IRAC data from Spitzer, with its simultaneous 5.12 x 5.12 arcmin images at 3.6, 4.5, 5.8, and 8m, will allow fluxes of high redshift galaxies like LBGs to be determined at rest–frame near–IR (m). This will greatly reduce concerns about the uncertain – since the recent star formation history will have significantly lower influence on the flux at m. As noted above, the first such results are beginning to appear from the Spitzer IRAC GTO team. Barmby et al. (2004) carried out SED fits for Spitzer IRAC observations of LBGs. These were combined with optical data and Bruzual and Charlot (2003) models to estimate stellar masses. Since the Spitzer IRAC data corresponded to rest–frame m there is greater confidence in the derived “stellar masses” than those derived just from the optical (though, reassuringly, the Spitzer IRAC results are consistent with the earlier rest–frame optical results, e.g., Papovich et al. 2001). Interestingly, the typical stellar galaxy masses were found to be about – characteristic of current–day massive bulges.
While much will be done over the coming years using SEDs from Spitzer the most valuable observations will be direct dynamical measures of mass from kinematic observations. These have the potential to allow direct comparison of the mass scales of galaxies at different redshifts with the very large body of data that is now available at .
A recent paper by Genzel et al. (2003) exemplifies the power of sub–mm observations, a field which will grow dramatically when ALMA comes on line. IRAM interferometer observations were made of the SCUBA source SMM J02399–0136 at in the CO (3–2) line. This object is extended in a Keck image. The sub–mm velocity–position diagram showed a structure characteristic of a rotating disk. The “two–peaked” line profile looked much like those seen in disk galaxies at low redshift from HI radio observations. What was particularly striking about this object was the magnitude of the rotation: km s-1 implying a mass of some within kpc at ! This is a strikingly massive galaxy. While challenging at this time, such observations should be routine with ALMA.
The recent advent of efficient long–slit IR spectrographs on large telescopes is also providing opportunities for studies of the kinematic motions in high–redshift galaxies. Using emission lines in high–redshift LBGs to derive velocities for the gas has long been a goal, but the large outflows in these strongly star–forming objects (first seen in the spectra obtained of the strongly–lensed galaxy G1 in the cluster Cl1358+62 – see Franx et al. 1997) has limited the value of any measures derived from UV lines like Ly.
Fortunately the optical nebular lines like H and [NII] provide velocities that are likely to be more representative of the dynamically–induced velocity field in the galaxy. But these fall in the near–IR at m for galaxies and so require near–IR spectroscopy. As noted above this is now possible with ISAAC on the VLT and NIRSPEC on Keck, for example, and allows the measurement of velocities to give dynamical mass estimates.
A key paper in this area was that of Erb et al. (2003). They took H observations of 16 LBG galaxies with Keck NIRSPEC and VLT ISAAC. They derived “rotation” curves for a sample of objects that were extended along the spectrograph slit. No particular effort was made in these observations to put the slits along the long axes of the objects (it is not clear, however, in these high–redshift star forming objects that the “long axis” of the light distribution corresponds to the major axis of the mass distribution, since the star forming regions may be scattered about the galaxy in a quite non–uniform way). Nonetheless they found that the emission lines were extended and tilted, characteristic of those seen in rotating galaxies. They derived “rotation velocities”, as well as velocity dispersions from the widths of the H line. To derive masses they needed a characteristic radius, and used the mean half–light radius that was determined for a subset of the sample for which HST images were available. The half–light radius was about 0.2 arcsec, corresponding to 1.6 kpc at the redshift of this sample (). While the effect of outflows on the measured kinematics remains to be determined, it is expected that the optical nebular lines will be much less affected than the UV lines like Ly. Ultimately one will need high S/N spectra to compare the emission line velocities with the interstellar and photospheric absorption line velocities as a check on the outflow contribution to the emission lines.
The current kinematical data give typical masses of a . This is strikingly similar to the stellar masses estimated by Barmby et al. (2004) from Spitzer SED fits! This work is being continued with further results given by Erb et al. (2004).
7 Red, Evolved Galaxies at
One of the most striking developments in the last two years in the field of high–redshift galaxies has been the discovery of an evolved population of galaxies at . These objects were detected from very deep near–IR imaging in the HDF–S and in a well–studied distant cluster field, MS1054–03. Their SEDs suggested that they were relatively unreddened, evolved galaxies at high redshift (Franx et al. 2003). Their SEDs were best fit with early–type populations. Galaxies with evolved stellar SEDs that are red in () were considered likely, from models, to have redshifts around . An initial spectroscopic study (van Dokkum et al. 2003) supported these inferences. These first papers suggested that these objects are likely to be progenitors of current–day early–type galaxies.
These objects are now being characterized with increasing detail (see, e.g., Forster Schreiber et al. 2004). A recent development has been to use velocity measurements (line widths) to establish their mass scales. This was done with near–IR spectroscopy again, using NIRSPEC on Keck to measure the width of H in four of these objects (van Dokkum et al. 2004). The ISAAC VLT images of the galaxies with line widths showed that they are resolved with characteristic sizes arcsec. Given measured velocity dispersions and a length scale, a characteristic mass could be determined. It was found to be high, , some that of the LBG galaxies. These galaxies (or DRGs – distant red galaxies) are larger, redder and more massive than LBGs. Strikingly, they are massive even compared to present day samples of early–type galaxies. A comparison of the 7 DRGs with measured velocity dispersions (and hence masses) with 20,000 local SDSS ellipticals shows that they fall at the high end of the SDSS distribution (which extends to about ). The median SDSS elliptical mass is a little over ). As expected, the DRGs have a dynamical that is substantially larger than that of the LBGs, 0.2.
An estimate of their mass density at shows that their contribution is comparable to the LBGs at that redshift. Clearly the DRGs are an important contributor to the overall galaxy population at high redshift.
8 Dropout Galaxies – to and Beyond….
Over the last 8 years the HDFs have played a central role in the study of high–redshift galaxies. Recently the HST ACS has been used to obtain high quality multi–band data on a number of fields, which rival or exceed the HDFs in their value for detecting and characterizing high–redshift galaxies. Several of these fields have been the used extensively for identifying samples of high–redshift dropout galaxies over the last year. The most important of these are the GOODS fields, the UDF, and the UDF–Parallels (UDF–Ps), though we will also mention a distant cluster field around RCDS 1252–2927 used for some dropout work. All have excellent HST ACS and data, while the GOODS, the UDF and UDF–Ps fields also have deep and data. Near–IR data also is of great value in isolating the highest redshift samples, and for minimizing contamination, though this tends to be a minor problem for conservatively–chosen dropout samples. The excellent VLT ISAAC IR data (Lidman et al. 2004) in RCDS 1252–2927 makes a substantial contribution to the selection of –dropouts. Similar data is available in some of these fields, particularly the UDF, with the NICMOS UDF–IR data (Thompson et al. 2004), and the GOODS CDF–S field which has extensive VLT ISAAC data.
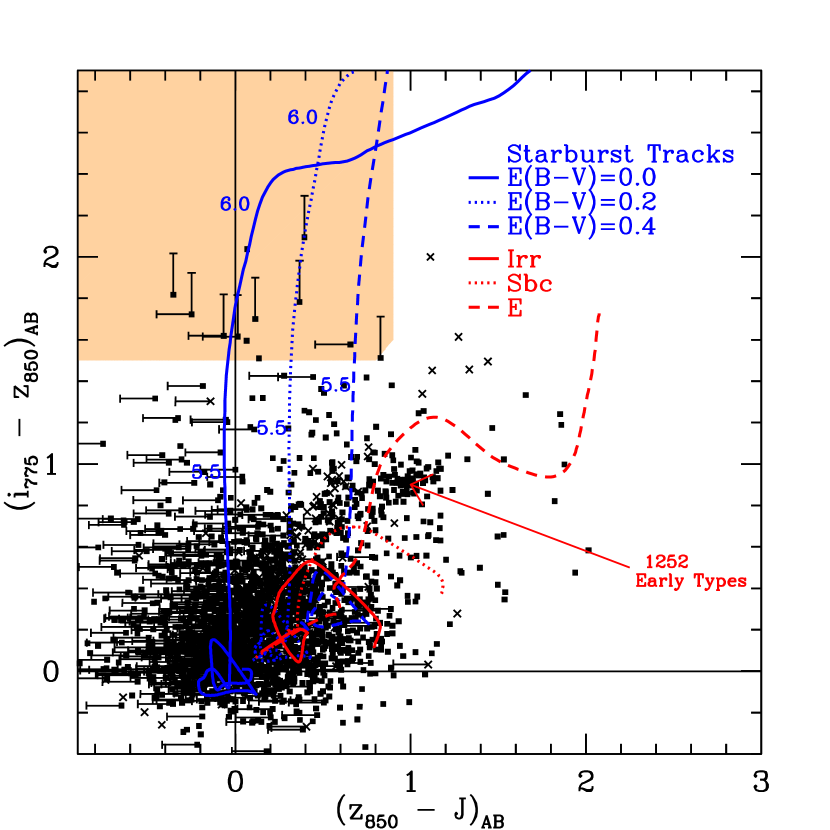
The selection of dropout galaxies is routinely done in the two–color plane. An example for –dropouts is shown in Fig 1 for the RCDS 1252–2927 field (from Bouwens et al. 2003b). The ACS data reaches typically to mag (), while the ground–based IR data goes impressively deep, down to and mag (). The fraction of objects in the IR footprint of RCDS 1252–2927 is impressively small, only 12 out of 3000 galaxies (0.3%). Even so the estimated contamination of the –dropouts is only about 11%. A number of these candidates have been observed with Keck and the VLT and confirmed to be at . A total of 23 galaxies were found in the four ACS pointings of the RCDS 1252–2927 field, giving a surface density of –dropouts per square arcmin to mag (though this surface density appears to be a larger than the cosmic average). The objects are very small, though nevertheless resolved, with typical half-light radii of 0.15′′ or kpc. In this particular field, the objects reach down to (Steidel et al. 1999).
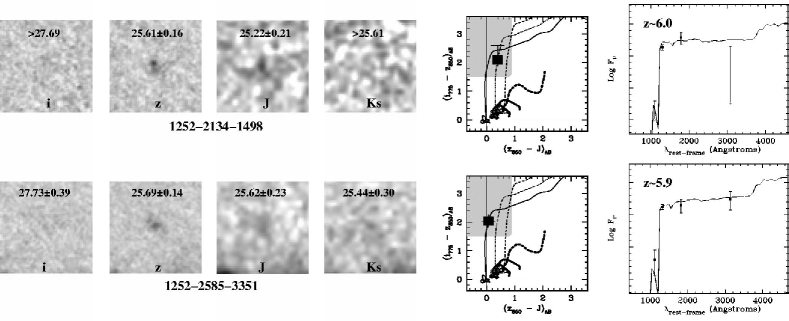
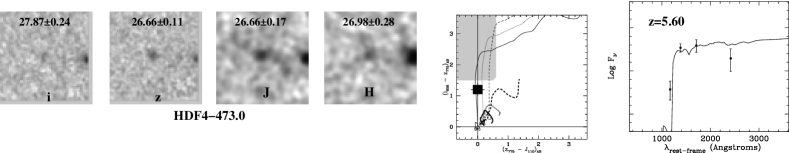
Two of the brighter –dropouts from the RCDS 1252–2927 field are shown in Fig 2, along with their location in the two–color plane, and SED fits used to establish the redshifts. The ACS and data from the HDF–N also allowed for a search for –dropouts. A reassuring result was that the Weymann et al (1998) object in the HDF–N was given a photometric redshift , quite consistent with its spectroscopic value of . It was very close to meeting our –dropout criterion (its color was just a little too blue). While not a true –dropout, this consistency suggested that our selection was yielding bona–fide high redshift objects. Other spectroscopic results (Bunker et al. 2003 and Dickinson et al. 2004), and our own ongoing Keck programs, have only served to strengthen our confidence in the dropout approach.
While the RCDS 1252–2927 field provided a significant sample of –dropouts (with a good assessment of the contamination), the best samples of brighter dropouts come from the two ACS GOODS fields, CDF–S and HDF–N (see Giavalisco et al. 2004). From these fields, Bouwens et al. (2004b) derived a large number of , and –dropouts, augmenting them with a smaller but very useful sample of –dropouts from the HDF–N and HDF–S fields so that a self–consistent differential analysis could be applied across a large redshift range, to . Even with relatively conservative selection criteria, Bouwens et al. (2004b) derive 1235 –dropouts, 407 –dropouts, and 59 –dropouts. These samples go as faint as 0.2, 0.3, 0.5 (using the Steidel et al. 1999 value for ), respectively, with 10 limiting magnitudes of 27.4 in the band and 27.1 in the band.
The large samples and wide areal coverage of the GOODS fields are nicely complemented by the two UDF–Ps obtained in parallel with the deep NICMOS images of the UDF. These fields have overlapping ACS images on a 45′′ grid with 9 orbits each in B and , 18 orbits in and 27 orbits in (as well as 9 orbits with the grism). They reach impressively faint, to 28.8, 29.0, 28.5 and 27.8 mag () in , and AB-mag, respectively – or to . The UDF itself is an impressive addition to these fields, taking the limits to .
9 Dropout Galaxies: Evolution
A major issue with deriving the evolution of galaxy properties at high redshift is systematic error – primarily through the many selection effects that can influence the nature of the samples, even when derived from very similar datasets. Of these the surface brightness dimming is the dominant effect, but many others affect the derived samples (e.g., size evolution, color evolution, definition of selection volumes, data properties as a function of redshift, filter band, and instrument, etc.). To treat these effects, we compare our highest redshift samples with “cloned” projections of our lower redshift samples (e.g., Bouwens et al. 1998; Bouwens et al. 2003a), allowing us to contrast intrinsic evolution from changes brought about by the selection process itself.
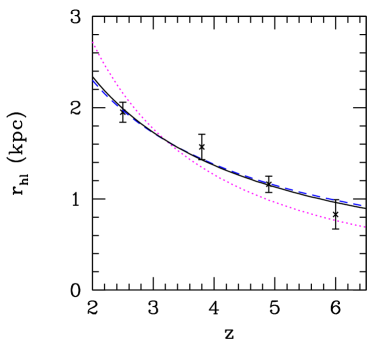
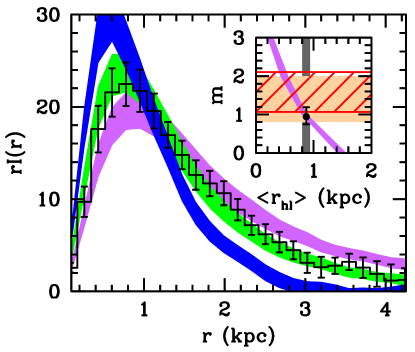
One of the key results is that of size evolution. An excellent illustration of this is provided in Fig 4a with data from the UDF showing that there is a clear decrease in size with redshift for objects of fixed luminosity (Bouwens et al. 2004c). While a more rigorous demonstration of this is given in Fig 4b, this trend has now been demonstrated in a variety of ways with both the GOODS data and the UDF–Ps data (Ferguson et al. 2004; Bouwens et al. 2004a; Bouwens et al. 2004c). The preferred size scaling from the best dataset, the UDF, is , but the measured size scalings have ranged from to in the above studies and may depend upon luminosity.
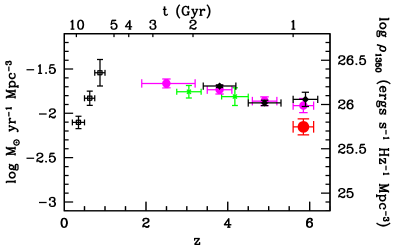
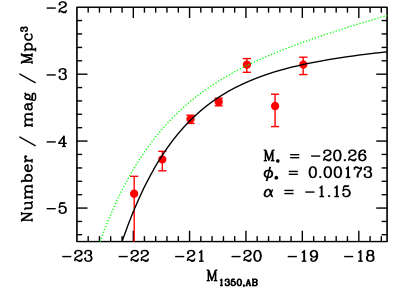
A major goal of these studies is to extend the constraints on the luminosity density and the star formation rate with redshift to higher redshifts and beyond. A related goal is to improve the constraints at lower redshifts (). These new datasets are proving to be of great value for these two goals, as Fig 5a demonstrates, showing several of the more recent estimates which have been made on the (dust–free) star formation rate out to . These data also permit a derivation of the luminosity function to significantly fainter than , as was done by Bouwens et al. (2004a) with the GOODS + UDF–Ps data (Fig 5b). While much work is still in progress, the UDF is allowing us to make significant improvements to these measures, particularly at , where it provides a significant check on both the incompleteness and faint end slope (Bunker et al. 2004; Bouwens et al. 2004c; Bouwens et al. 2004d).
10 Dropout Galaxies: Galaxies
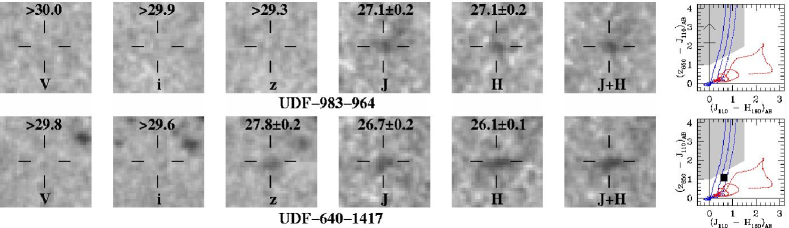
The UDF promises to be a resource comparable to the original HDFs. NICMOS and IR data were also taken covering a substantial fraction of the UDF (Thompson et al. 2004). Together these datasets will provide great insight into the nature of high-redshift galaxies, given the wide wavelength coverage (especially when the Spitzer CDF–S data also become available) and the great depth. In particular, they allow a search for –dropouts, i.e., galaxies at redshifts . Remarkably, there are indications that we have detected such galaxies (see Bouwens et al. 2004e). An example of such a detection is shown in Fig 6, along with that for a slightly lower redshift galaxy (one at ). The detections in Bouwens et al. (2004e) suggest that luminous galaxies are in place at , and that the UV luminosity density, while down compared to that at is still quite significant.
11 Summary – High Redshift Galaxies at
There has been remarkable progress on characterizing galaxies at high redshift, particularly since the ACS came on line after the HST servicing mission SM3B in 2002. Significant numbers of evolved galaxies have been detected. These galaxies, or DRGs, appear to be the progenitors of ellipticals and massive bulges (at one stage of their development). Substantial progress has been made on determining mass scales from kinematics and from stellar populations (SEDs). This is challenging but the future holds great promise with observations from HST, Spitzer, ALMA, and ground-based 8–10 m IR spectrographs. Large samples of LBG (strongly star-forming) galaxies at to have been detected. The ACS GOODS + HDF dropout samples extend to 27 AB mag () and total some 1900 galaxies, of which 200 are –dropouts, 1230 are –dropouts, 410 are –dropouts, and 60 are –dropouts. The UDF, UDF–Ps and other fields increase the –dropout sample to over 200. Our cloning analysis of several datasets including the GOODS CDF–S & HDF–N, and the UDF plus the UDF–Ps fields has shown that there is a systematic decrease in the size of dropout galaxies as a function of redshift (). The best fit is , but the precise scaling may depend on luminosity, ranging from to . This implies a decrease in galaxy size from to . Our recent studies on the UDF–Ps + GOODS fields indicated that there is a increase in the rest–frame continuum UV luminosity density from to (within a period of 1 Gyr). The uncorrected star formation rate density at was just the star formation rate density at . New data from the GOODS, the UDF–Ps, and UDF fields are permitting an –dropout luminosity function to be constructed down to ( AB mag). Studies indicate that these galaxies could provide the needed reionizing flux at and earlier. Remarkably, HST ACS and NICMOS data in the UDF have led to the likely detection of (a few) –dropout galaxies.
Acknowledgements.
We would like to thank the organizers for an excellent meeting in a wonderful country. We particularly appreciate the Anglo American Chairman’s Fund for sponsoring the Conference. We acknowledge the remarkable advances that have come about because of HST and its amazing imagers, particularly the ACS. We regret the decision by NASA to cancel SM4 that would lead to the premature death of HST. We hope that a mission, astronaut or robotic, to add the SM4 instruments and extend Hubble’s life, comes about. We owe a lot to our team members on the ACS GTO team∗ and the UDF–IR team∗∗, and particularly the PIs, Holland Ford and Rodger Thompson (∗ACS GTO team: Holland Ford, Txitxo Benitez,Tom Broadhurst, Piero Rosati, Marijn Franx, Marc Postman, Brad Holden, Rick White, John Blakeslee, Dan Magee, Gerhardt Meurer plus many other team members; ∗∗UDF-IR team: Rodger Thompson, Mark Dickinson, Marijn Franx, Pieter van Dokkum, Adam Riess, Xiaohui Fan, Dan Eisenstein, Marcia Rieke). Support from NASA grant NAG5–7697 and NASA/STScI grant HST–GO–09803.05–A is gratefully acknowledged. ACS was developed under NASA contract NAS5–32865.1
References
- [1] Barmby, P., et al. ApJS., in press, astro-ph/0405624 (2004).
- [2] Bennett, C. L., et al. ApJS., 148, 97 (2003).
- [3] Bouwens, R., Broadhurst, T. and Silk, J. ApJ., 506, 557 (1998).
- [4] Bouwens, R., Broadhurst, T., & Illingworth, G. ApJ., 593, 640 (2003a).
- [5] Bouwens, R. J., et al. ApJ., 595, 589 (2003b).
- [6] Bouwens, R. J., et al. ApJL., 606, L25 (2004a).
- [7] Bouwens, R. J. et al. ApJ., submitted (2004b).
- [8] Bouwens, R. J. et al. ApJL., 611, L1 (2004c).
- [9] Bouwens, R. J. et al. ApJ., in preparation (2004d).
- [10] Bouwens, R. J. et al. ApJL., in press, astro-ph/0409488 (2004e).
- [11] Bruzual, G. & Charlot, S. MNRAS, 344, 1000 (2003).
- [12] Bunker, A. J., et al. MNRAS, 342, L47 (2003).
- [13] Dickinson, M., et al. ApJL., 600, L99 (2004).
- [14] Dickinson, M., Papovich, C., Ferguson, H. C., & Budavári, T. ApJ., 587, 25 (2003).
- [15] Erb, D. K., et al. ApJ., 591, 101 (2003).
- [16] Erb, D.K., et al. ApJ., in press, astro-ph/0404235 (2004).
- [17] Ferguson, H.C., et al. ApJL., 600, L107 (2004).
- [18] Ford, H. C. et al. Proc. SPIE, 4854, 81 (2003).
- [19] Forster Schreiber, N.M., ApJ., in press (2004).
- [20] Franx, M., et al. ApJL., 486, L75 (1997).
- [21] Franx, M., et al. ApJL., 587, L79 (2003).
- [22] Fukugita, M., Hogan, C. J., & Peebles, P. J. E. ApJ., 503, 518 (1998).
- [23] Giavalisco, M., et al. ApJL., 600, L93 (2004).
- [24] Genzel, R., et al. ApJ., 584, 633 (2003).
- [25] Kogut, A., et al. ApJS., 148, 161 (2003).
- [26] Lidman, C., et al. A.& A., in press (2004).
- [27] Lilly, S.J., Le Fevre, O., Hammer, F., & Crampton, D. ApJ., 460, L1 (1996).
- [28] Madau, P., Pozzetti, L. & Dickinson, M. ApJ., 498, 106 (1998).
- [29] Mo, H. J., Mao, S., & White, S. D. M. MNRAS, 295, 319 (1998).
- [30] Papovich, C., Dickinson, M., & Ferguson, H. C. ApJ., 559, 620 (2001).
- [31] Rosati, P., et al. ApJ., 492, L21 (1998).
- [32] Rudnick, G., et al. ApJ., 599, 847 (2003).
- [33] Shapley, A.S., et al. ApJ., in press, astro-ph/0405187 (2004).
- [34] Stanway, E. R., Bunker, A. J., & McMahon, R. G. MNRAS, 342, 439 (2003).
- [35] Stanway, E. R., et al. ApJL., 604, L13 (2004).
- [36] Steidel, C.C., et al. ApJ., 519, 1 (1999).
- [37] Thompson, R. I., Weymann, R. J., & Storrie-Lombardi, L. J. ApJ., 546, 694 (2001).
- [38] Thompson, R. I., et al., in preparation, (2004).
- [39] van Dokkum, P.G., et al. ApJL., 587, L83 (2003).
- [40] van Dokkum, P.G., et al. ApJ., in press, astro-ph/0405482 (2004).
- [41] Weymann, R. J., et al. ApJL., 505, L95 (1998).
- [42] Yan, H., Windhorst, R. A., & Cohen, S. H. ApJL., 585, L93 (2003).