1
Multi-wavelength study of a sample of nearby Seyfert galaxies
Abstract
One of the least biased complete Seyfert sample available to date has been considered to perform an X-ray survey using the capabilities of XMM-Newton and Chandra satellites. The X-ray nuclear luminosities obtained have been used to perform a multi-wavelength analysis as a powerfull tool in the identification of heavily obscured objects. The new X-ray data, together with highest quality nuclear fluxes available from the radio to the optical band, allow us to obtain nuclear Spectral Energy Distributions (SEDs) for type 1 and type 2 objects in our sample. The results obtained from the analysis of the SED have been discussed in the framework of Unified Models.
1 Introduction
Active Galactic Nuclei (AGNs) produce a large amount of energy in small spatial scales and radiate their energy over a wide range of energies, from gamma-rays and X-rays through the ultraviolet, optical and infrared spectral regions to the far-infrared and radio-frequency regions. X-ray emission is arguably the most important aspect of understanding AGNs, because of its unambiguous association with genuine nuclear activity, and its important diagnostic capabilities for studying accretion mechanisms.
Nonetheless, the study of the continuum emission of Seyfert galaxies over a broad range of frequencies is an important tool to understand/discriminate the energy output in different wavebands, as well as a mean to distinguish galaxies of different activity classes and to test Unified Models which ascribe the differences between type 1 and type 2 Seyferts as merely due to orientation effects rather than fundamental physical differences. Previous works, however, were limited since they concentrated nearly exclusively on high-luminosity AGNs (Lbol 1044 erg/s) and very little data exist on the spectral properties of low-luminosity sources (low-luminosity Seyfert galaxies and Liners, with Lbol 1041-1043 erg/s). To date, only a handful of objects have been adequately studied with multi-wavelength observations obtained with sufficient angular resolution in order to detect the nuclear emission and separate it from the host galaxy background.
We have performed an extensive X-ray study of a complete sample of AGNs unbiased against low-luminosity sources using the capabilities of the Chandra and XMM-Newton observatories. We obtained high quality nuclear SEDs for type 1 and type 2 objects in our sample from the radio to the hard X-ray band, using the combination of high angular resolution capabilities and unprecedented sensitivity of the new generation telescopes. We refer to forthcoming publications for details on the results here presented (Panessa et al. in preparation, Cappi et al. in preparation).
2 The sample
The sample of Seyfert galaxies has been derived from the Palomar optical spectroscopic survey of nearby galaxies (Ho, Filippenko, & Sargent 1995). From this survey, high-quality spectra of 486 bright ( 12.5 mag), northern ( 0∘) galaxies have been taken and a comprehensive, homogeneous catalog of spectral classifications of all galaxies have been obtained (Ho et al. 1997). The Palomar survey is complete to = 12.0 mag and 80% complete to = 12.5 mag (Sandage, Tammann, & Yahil 1979). From the entire Ho et al. (1997) sample we have extracted all Seyfert galaxies111In a few cases the classification assignment is ambiguous, and more than one is given. Objects in which the Seyfert classification was not dominant but still present (L2/S2, H/S2 or T2/S2) have been included in the present sample. Hereafter we refer to these objects as to ”Seyfert dim objects”.. The total sample of 60 Seyfert galaxies includes 39 type 2 (type 2, 1.8 and 1.9), 13 type 1 (type 1.0, 1.2, 1.5) and 8 ”Seyfert dim objects”.
3 Chandra and XMM-Newton data analysis
An homogeneous and standard X-ray data analysis has been carried out on our selected Seyfert sample using Chandra and XMM-Newton observations for 39 objects of the sample with 22 objects having observations with both satellites222To complement the X-ray informations on the whole sample, a search in the literature for observations with previous satellites (operating in the 2-10 keV energy range) has also been carried out. ASCA observations have been found for 8 objects. At the end, 47 sources out of 60 have X-ray data available..
An atlas of Chandra and XMM-Newton images and spectra has been produced in the 0.3-10 keV energy band. The results obtained indicate a high detection rate ( 95%) of active nuclei, characterized, in 60% of the objects, also by the presence of nearby off-nuclear sources and/or in 35% of the objects, of diffuse emission. Altogether these results demonstrate that high spatial resolution is fundamental for this type of studies in order to isolate nuclear emission from other X-ray emitting components of the host galaxy. Spectral analysis has been performed in order to first identify the underlying continuum when possible, then additional components and features have been included to best reproduce the data. The distribution of spectral parameters, in particular for type 1 objects, are found to be within the range of values observed in bright AGNs. In figure 1, left panel, the observed distribution of column densities for the total sample is shown ranging from the typical Galactic values to very high absorptions (i.e. 1023 cm-2). Nearly 30% of type 1 Seyfert galaxies are characterized by a significant amount of absorption (i.e. 1022 cm-2) that could be ascribed to ionized material and/or dense gas clouds crossing the line of sight. The distribution of the observed column densities for type 2 Seyfert galaxies here apparently deviates from past results showing mostly mildly absorbed objects. However, it is well known that Compton thick sources (with NH 1024 cm-2) may appear as objects with little absorption (Risaliti et al. 1999). In this case we need to use independent tools to assess their true nature (i.e. heavily absorbed vs. intrinsically unabsorbed).


The right panel of figure 1 shows the observed 2-10 keV luminosity distribution for the total sample: a wide range of luminosities is covered, from objects with luminosities comparable to those of binary systems (i.e. L2-10keV 1037 erg/s) to those with luminosities typical of bright AGNs (i.e. L2-10keV 1043 erg/s). It has been shown in previous surveys that Seyfert 2 galaxies are generally weaker than their type 1 counterparts. The distribution of type 1 (middle panel) and type 2 (lower panel) objects of our sample confirms, at a first glance, this evidence. A Kolmogorov-Smirnov test to compare the two distributions confirms that they are different at 99.9% confidence level. We will address below whether this difference could be ascribed to absorption effects or whether it is an intrinsic property of these sources.
4 Diagnostics for heavy absorption
The issues related to the distribution of the absorption among objects in our sample have been investigated taking advantage of some powerful diagnostic tools in order to unveil the presence of obscuration in Seyfert galaxies.
4.1 Flux diagnostic diagrams
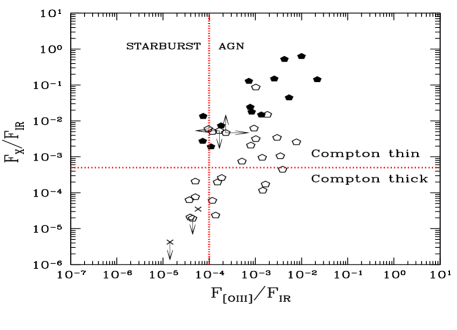
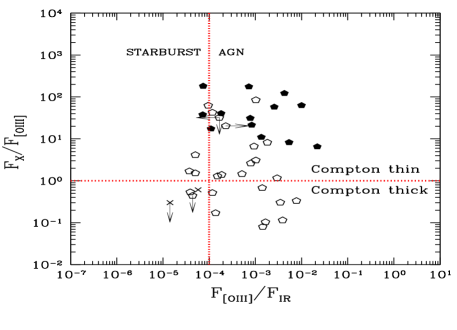
Measuring the X-ray luminosity and compare it with an isotropic indicator of the intrinsic brightness of the source offers an indirect method for evaluating the true amount of absorption. In particular, the [OIII]5007 flux is considered a good isotropic indicator because it is produced in the Narrow Line Region (Maiolino & Rieke 1995; Risaliti et al. 1999; Bassani et al. 1999). Also the Far-Infrared emission seems to be produced over a larger region than that of the molecular torus and, thus, has been used as an isotropic indicator too (Mulchaey et al. 1994, Mas-Hesse et al. 1994).
The F2-10keV/FIR, F2-10keV/F[OIII] and F[OIII]/FIR ratios, as plotted in the diagrams of figure 2, can provide an independent way to establish which is the dominant component between AGN or starburst and at the same time they are a powerful tool in the detection of Compton thick sources when an X-ray spectral analysis is not sufficient (Panessa & Bassani 2002). The use of such diagrams allows us to recognize a few of Compton thick candidates that the X-ray spectral analysis has not been able to retrieve. Moreover, a small fraction of objects occupies the Starburst region pointing to stellar processes as the underlying agent responsible for the activity.
4.2 The NH vs F2-10keV/F[OIII] diagram
The effect of the column density is to decrease the F2-10keV/F[OIII] ratio with respect to Seyfert 1 galaxies. The reduction is at most by a factor 5 when NH is less than a few times 1023 cm-2, and by about two orders of magnitude when 1024 cm-2. In figure 3 the column densities measured from our X-ray spectra have been plotted versus the logarithm of the F2-10keV/F[OIII] ratio. The shaded region (lower left to upper right) indicates the expected correlation by assuming that F2-10keV is absorbed by the NH reported on the Y-axis, starting from the average F2-10keV/F[OIII] ratio observed in type 1 Seyfert galaxies and assuming a 1% reflected component. The width of the shaded region has been drawn considering the lower and higher F2-10keV/F[OIII] ratios of the type 1 Seyferts of our sample. The shaded region (upper left to lower right) obtained by Maiolino et al. (1998) has also been reported for comparison: it is evident that our and their results are substantially similar confirming the relation between the X-ray versus [OIII] flux ratio and column density333 There are 8 objects in our sample for which an estimate of the column density is not available, they have been plotted assuming that they are absorbed only by a Galactic column density of 5 1019 cm-2..
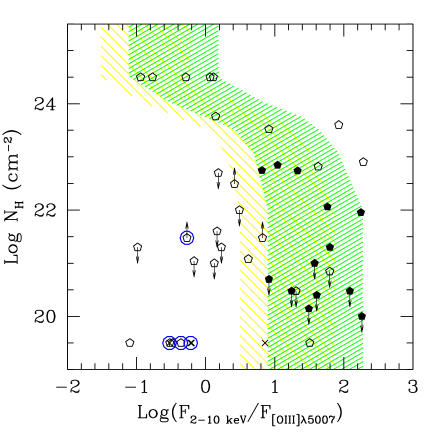
Compton thick objects should occupy the high NH - low F2-10keV/F[OIII] region of the predicted distribution. A large fraction of objects follow the expected distribution, while 30% of the sources are clearly out of the correlation in the low NH - low F2-10keV/F[OIII] part of the diagram. These objects would lie in the correlation if they were absorbed by a column density higher than few times 1023 cm-2. Among these objects we find five of them which have been found in the Starburst region from the flux diagnostic diagrams (figure 2): all of them have been marked with a ring in figure 3 to highlight their difference from the other Seyfert galaxies. Their different behaviour is also confirmed by our X-ray analysis which indicates that the nuclear cores of these objects appear to be very faint or absent. Since in these objects it is not even clear that there is an AGN, we prefer to be conservative and treat them as a separate class, however these sources may also be affected by large absorption and turned out to be Compton thick if deeper X-ray measurements were to be done.
Sources having a F2-10keV/F[OIII] ratio smaller than 1 are our most likely Compton thick candidates.
It is worth noting a few anomalous cases in figure 3: (i) type 1 objects (filled polygons) having the absorbing column greater than 1022 cm-2 and (ii) type 2 objects (open polygons) which lie in the region of high F2-10keV/F[OIII] - low NH occupied by type 1 objects.
4.3 Corrected column density and X-ray luminosity distribution
After considering multi-wavelength diagnostics it turns out that the fraction of absorbed objects is largely underestimated if the column density measurements are based only on the 2-10 keV spectrum. As a consequence, the observed column density and 2-10 keV luminosity distributions should be corrected taking into account our Compton thick candidates. Those tools applied to our sample sources, have revealed that the fraction of objects which may be affected by Compton thick obscuration ranges from 20% up to 50% in agreement with previous estimates available for a flux-limited sample (Risaliti et al. 1999). With the present work we are able to probe much lower luminosities and still find that the fraction of absorbed objects remains significantly high.
As a consequence, the dichotomy often observed in the luminosity of type 1 and type 2 AGNs is, therefore, mainly to be ascribed to the presence of heavy absorption in type 2 objects. In fact, correcting for the absorption, we find a flat distribution of NH and no significant difference in luminosity of type 1 and type 2 Seyfert galaxies. Overall, the results obtained here are therefore in agreement with the predictions of unified models, except for a few ( 10%) particular cases which do not fit easily into the standard picture: (i) bona-fide type 2 objects which have no evidence for absorption in excess to the Galactic value and (ii) type 1 Seyferts which have column densities of 1022-1023 cm-2, i.e. more typical of type 2 objects. Another small fraction ( 10%) of objects in our sample, characterized by luminosities lower than 1038 erg s-1, is of ambiguous nature, i.e. it is not clear whether a nuclear starburst or an active nucleus or a combination of both are responsible for the observed emission.
5 Nuclear Spectral Energy Distributions
Recently, multi-wavelength surveys from the radio to the Infrared band have been performed on sub-samples of the Ho et al. (1997) sample of Seyfert galaxies (Ho & Ulvestad 2001, Alonso-Herrero et al. 2003, Ho & Peng 2001). Taking advantage of these extensive data sets, it is thus possible to consider here the highest quality nuclear fluxes and therefore assemble the SEDs from radio ( Hz) to hard X-rays ( Hz) for a significant fraction of the objects in our sample. High resolution 2-10 keV observed fluxes as obtained from the X-ray analysis have been used in assembling the SEDs.
The best quality individual SEDs of type 1 and type 2 Seyfert galaxies are presented in figure 4, shifted vertically by arbitrary constants, for clarity. The data from the radio to the hard X-rays have been drawn as filled dots. A straight line has also been drawn to connect the data points and better compare the SEDs444Note that in the millimeter and in the UV region this line does not represent the real SED..


The SEDs reported in figure 4 indicate the same behaviour in both type 1 and type 2 objects going from the radio to the far infrared band: clearly in each object the flux increases going from 6 cm to 200 m. Figure 4 also shows that the infrared energy band is very well described over 3 decades of frequencies from the far-infrared to the near infrared band. It is interesting to note that type 1 sources show a flatter spectrum all over the infrared waveband with respect to type 2 objects in which Lν decreases with increasing frequency. Moreover, in type 1 objects the spectra appear to be flat enough as to meet the observed emission at X-ray frequencies, while in type 2 objects it is likely that absorption has the effect of reducing the emission also in the optical and X-ray wavebands.
The average continuum spectral distribution from radio to hard X-rays for type 1 and type 2 Seyfert have been plotted in figure 5 normalized to the flux at 6 cm. In both types the far and mid infrared components appear to dominate the energy output, while the two mean SEDs differ from the near-infrared band (at 1.6m) up to 10 keV, reconciling at hard X-ray frequencies, namely at 50 keV555It is worth noting that the luminosity in the B band ( 1015 Hz) has been obtained assuming , with by Ho & Peng (2001), which is typical for Seyfert 1 nuclei, however this assumption may not be valid for type 2 objects..
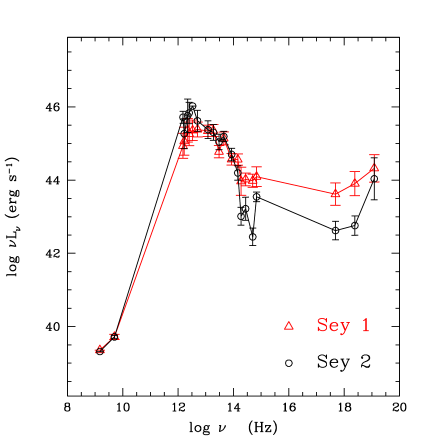
A comparison of the average spectral properties of the two classes of Seyferts show that: (i) in both cases the far and mid infrared emission appear to dominate the energy output, (ii) the near infrared, optical and X-ray emission up to 10 keV are significantly different in the two classes, type 2 objects showing lower luminosities. The results obtained are in agreement with the predictions of unified models in which Seyfert 2s are the obscured version of Seyfert 1s. Detailed models will be applied to our data in order to describe the spectral shapes and therefore put constraints on the main properties of the absorbing medium.
Acknowledgements.
This work has been carried on during the Ph.D. thesis of F. Panessa and it has been supported by the Consiglio Nazionale delle Ricerce (Italy).References
- (1) Alonso-Herrero, A., Quillen, A. C., Rieke, G. H., Ivanov, V. D., & Efstathiou, A. 2003, AJ, 126, 81
- (2) Ho, L. C. & Peng, C. Y. 2001, ApJ, 555, 650
- (3) Ho, L. C. & Ulvestad, J. S. 2001, ApJS, 133, 77
- (4) Ho, L. C., Filippenko, A. V., & Sargent, W. L. W. 1997, ApJS, 112, 315
- (5) Ho, L. C., Filippenko, A. V., & Sargent, W. L. 1995, ApJS, 98, 477
- (6) Maiolino, R., Salvati, M., Bassani, L., Dadina, M., della Ceca, R., Matt, G., Risaliti, G., & Zamorani, G. 1998, A&A, 338, 781
- (7) Maiolino, R., Rieke, G.H., 1995, ApJ 454, 95
- (8) Mas-Hesse, J. M., Rodriguez-Pascual, P. M., de Cordoba, L. S. F., & Mirabel, I. F. 1994, ApJS, 92, 599
- (9) Mulchaey J.S., Koratkar A., Ward M.J., Wilson A.S., Whittle M., Antonucci R.J., Kinney A.L., Hurt T., 1994, ApJ, 436, 586
- (10) Panessa, F. 2004, Ph.D. Thesis, University of Bologna (see http://duffy.bo.astro.it/marcella/PhD-Thesis/Panessa-Thesis.ps.gz)
- (11) Risaliti G., Maiolino R., Salvati M., 1999, ApJ, 522, 157
- (12) Sandage, A., Tammann, G. A., & Yahil, A. 1979, ApJ, 232, 352