XMM-Newton Observation of the Anomalous X-Ray Pulsar 4U 0142+61
We present results of an observation of the anomalous X-ray pulsar 4U 0142+61 with the EPIC cameras on XMM-Newton performed on 2003 January 24. The pulse phase averaged spectrum can be best described by the sum of a black body with a temperature of and a power law with photon index . The unabsorbed 2–10 keV flux is . No evidence for additional spectral features such as cyclotron lines is present. These results are consistent with those from an earlier Chandra observation in 2001 May. Phase resolved spectroscopy over the s period (MJD 52663.93) shows clear variations with pulse phase of , while shows a small variation of . We confirm earlier conclusions by Özel (2001) that the emission from AXPs is more likely to originate from neutron stars with one single and magnetically active region on the neutron star. The significantly different behavior of the soft and hard spectral components with pulse phase, however, cannot be fully reconciled with the present magnetar emission models.
Key Words.:
pulsars, individual: 4U 0142+61; neutron stars; pulsations1 Introduction
4U 0142+61 is a member of the small group of anomalous X-Ray pulsars (AXPs) which are characterized by spin periods in the range of 8–12 sec, associated with a relatively stable long term spin down (Gavriil & Kaspi 2002), very soft X-ray spectra well modeled by blackbody plus power law components with , a X-ray luminosity of –, low in comparison to High Mass X-Ray Binaries (HMXB) (Israel et al. 2002), and very faint optical counterparts. It is generally assumed that these objects are isolated neutron stars as no binary companion for any of these objects has been found up to now.
The X-ray luminosity of AXPs exceeds the energy available from the spin down of the neutron star, so some additional energy source is needed (van Paradijs et al. 1995). There are mainly two classes of models trying to explain the source of the missing energy. One class proposes that the AXPs are powered by accretion, either from debris of a disrupted HMXB after a common envelope phase (van Paradijs et al. 1995) or from a disk formed by the fallback material from a supernova explosion (Chatterjee & Hernquist 2000). The other class of models assumes a very strong magnetic field which can explain the spin down as magnetic dipole radiation while the X-ray luminosity is supplied by either the decay of the magnetic field (Thompson & Duncan 1995) or the cooling of the neutron star (Heyl & Hernquist 1997).
The brightest of the small sample of anomalous X-ray pulsars is 4U 0142+61, a source detected by Uhuru, which had its nature established during an EXOSAT campaign in which a s periodic variation was found (Israel et al. 1994). Subsequent X-ray observations manifested features usually attributed to AXPs such as a spectrum which is best fit by a 0.386(5) keV black body plus a power law with photon index , White et al. (1996). Long term period changes were discovered in subsequent ASCA and RXTE observations (Paul et al. 2000; Gavriil & Kaspi 2002), with the latter revealing a period of s and a period change of . Finally, an optical counterpart was detected which showed strong periodic variation (Kern & Martin 2002, see also Hulleman et al. 2004). A recent observation of 4U 0142+61 by Chandra confirmed the association of this optical counterpart with the X-ray source and also resulted in a further improvement of the X-ray spectral results (Patel et al. 2003; Juett et al. 2002).
In this Paper we report an observation of 4U 0142+61 with XMM-Newton. In Sect. 2 we describe the observation and data reduction. Lightcurve analysis and pulse phase averaged spectral analysis, presented in Sect. 3 and Sect. 4, confirm earlier Chandra and RXTE results. Phase resolved spectroscopy shows a variation of two different spectral components which are presented in Sect. 5 and discussed in Sect. 6.
2 Observations with XMM-Newton
The observation of 4U 0142+61 with XMM-Newton was performed on 2003 January 24 (XMM-Newton Revolution 573). This observation has an exposure time of 4.2 ksec with the EPIC-pn camera in small window mode and 5.8 ksec with both EPIC-MOS cameras in fast timing mode. The EPIC-pn detector is a back-illuminated charge coupled device (CCD) using pixels in small window mode, covering a area (Strüder et al. 2001). The two MOS cameras are front-illuminated CCDs detectors (Turner et al. 2001). In their timing mode, spatial information is preserved only along the -axis of the detector, but events are registered with a higher time resolution than in the EPIC-MOS imaging modes.
Standard data processing was performed with the XMM-Newton Scientific Analysis Software, version 5.4.1. For the EPIC-pn the source region was taken to be a circle of radius around the point source. The background was measured in two rectangular regions arranged at the corners of the readout window. For the MOS cameras, events in the raw interval were chosen for source events, background events were taken from the intervals and . No background flares were present during this observation. We checked the EPIC-pn data for evidence for pileup and found no indication for pattern pileup or pileup in diagonal pixel patterns at energies above 0.3 keV. For the MOS1/2 data pattern pileup is negligible in timing mode (Ehle et al. 2003).
We note that a second earlier XMM-Newton observation of 4U 0142+61 exists, which was performed on 2002 February 13 (revolution 399). For this 3.4 ksec long observation, only data from the EPIC-pn cameras are available (the MOS cameras were switched off) and the background was a factor of 10 higher than in the Rev. 573 observation, such that we decided to not use these data here.
The position of 4U 0142+61 was estimated by fitting a Gaussian to the point-spread function of the EPIC-pn data in both observations. The position obtained is , , which is consistent within the XMM error circle with the more accurate Chandra position of , (positional uncertainty ; Patel et al. 2003).
3 Timing analysis
For all instruments the lightcurve was searched for periods in the s domain using epoch folding (Leahy et al. 1983). Combining the results of the period search from all instruments of Rev. 573 (Epoch: MJD 52663.93) we found a period of s. This period agrees with the RXTE data of Gavriil & Kaspi (2002) which predict s, assuming a constant .
We estimate the uncertainty of the XMM-Newton period using a Monte-Carlo simulation: A synthetic lightcurve was constructed by taking the time stamps as in the measured light curve and associate them with the flux of the folded pulse profile at the corresponding phase (for the best period and ephemeris found from the observed data). From this template 1000 simulated lightcurves were constructed assuming the mean pulse profile and then randomizing the flux values using the appropriate Poisson distribution. For all simulated lightcurves the best periods were determined. The standard deviation of the distribution of those periods was taken as the uncertainty of the period found in the observed data.
For further timing and profile analysis we used a period of s. To compute pulse profiles all single events from all three EPIC detectors are added. Multiple events were not taken into account. The pulse profile in the energy range 0.3–10 keV is shown in Fig. 1. Its peak-to-peak pulsed fraction, defined as , is %.


In Fig. 2 we display the pulse profile and give the peak-to-peak pulse fractions for several energy bands. As was first noted by White et al. (1996) the pulse is double peaked at low energies. At higher energies the main pulse remains as a broad single peak centered at phase 0.9, while the secondary peak weakens and changes into a double peaked feature.
In our data we observe a slight phase shift of the main peak. Fitting a Gaussian distribution to this peak yields a centered phase value of 0.878(9) (0.3–1.3 keV), 0.891(5) (1.3–2.5 keV) and 0.92(1) (2.5-10 keV). The peak-to-peak pulsed fraction is not significantly energy dependent, with measured pulsed fractions of (0.3–1.3 keV), (1.3–2.5 keV), and (2.5–10 keV).
4 Spectra
For spectral analysis we used the single event data from the EPIC-pn camera and the MOS cameras of Rev. 573. Simultaneous fits were made with XSPEC version 11.2.0bl in the energy ranges of 0.5–9.5 keV (pn) and 0.5–8 keV (MOS), using a multiplicative constant to take into account the flux calibration uncertainty of the MOS cameras with respect to the EPIC-pn. To allow analysis the channels were rebinned to contain at least 50 counts per bin.
Several models were used to fit the phase averaged spectra: single component models (blackbody, bremsstrahlung, power law) and combinations of those, including the classical combination of a black body component plus a power law. All models include absorption due to the interstellar medium with hydrogen equivalent column density (using the XSPEC model phabs). Fit results of the different models are shown in Table 1.
| Model | (keV) | (keV) | (km) | |||||||
|---|---|---|---|---|---|---|---|---|---|---|
| PL | — | — | — | — | 0.84(4) | 0.85(4) | ||||
| BREMS | — | — | 6.79(2) | — | — | 0.85(4) | 0.85(4) | |||
| BB+BREMS | — | — | 0.85(4) | 0.85(4) | ||||||
| BB+PL | — | — | 428(40) | 0.85(4) | 0.85(4) |
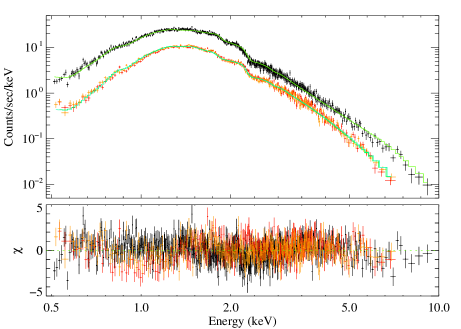
Single component models gave unacceptable results. The best fit is obtained for the black body plus bremsstrahlung model. The blackbody plus power law model (Fig. 3) gave almost the same but had a smoother residual at higher energies, and we will use this model in our further discussion. The residuals of this model show no indication for any line in the energy band covered by our observation. Using this model the unabsorbed 2–10 keV flux is . No further spectral features such as cyclotron lines were found in the spectral range of 0.5–10 keV.
Extending the fit to energies below 0.5 keV for the EPIC-pn data alone and refitting yields a deviation of 30% between the data and the model in 0.3–0.5 keV band. This deviation is larger than allowed by the uncertainties of the calibration (Kirsch 2003). Phase resolved spectroscopy shows this excess of the model in all phases (see Sect. 5), i.e., the excess flux is not caused by a possible continuum variability with pulse phase. The feature also is present for different absorption models and abundances and is also present in the double event spectrum of the EPIC-pn camera. We assume that the residual either comes from a higher galactic absorption than the absorption model or from unresolved calibration issues in this energy band. For the remainder of this paper, therefore, we will restrict ourselves to the energy band above 0.5 keV.
5 Phase resolved spectroscopy

To search for spectral variations with pulse phase we split the data into ten phase bins, rebin the spectra to contain at least 25 counts per bin, and model the EPIC data of each phase bin with a black body plus power law model. Fig. 4a shows the resulting pulse profile.
In a first step, all parameters were allowed to freely vary with pulse phase. We found that the column density did not show significant variation. To test this constancy we fit the subset of phase bins with the highest flux, constraining to be the same for these bins. In a second iteration, was allowed to vary with pulse phase. The -test shows a probability of 71% that does not vary. Therefore we considered to be a constant parameter with a value of in our subsequent analysis.
The results of our spectral analysis are shown in Figs. 4b and c as a function of pulse phase. The blackbody temperature is virtually constant, while the photon index shows a clear pulse phase dependence. Using the unabsorbed spectrum, we furthermore derive the contribution of the blackbody and the power law component to the total 0.5–10 keV flux as a function of pulse phase. The result is shown in Figs. 4d and e. Uncertainties are computed using a Monte-Carlo approach randomizing the input data sets. We compare these results with AXP emission models in the following section.
6 Discussion
In this paper we have shown that the comparatively short observation of 4U 0142+61 with XMM-Newton confirms the spectral and timing parameters from earlier observations. The best fit models are the standard black body plus power law and the black body plus bremsstrahlung model. The period agrees well with the high precision value derived from the long term timing campaign with RXTE (Gavriil & Kaspi 2002).
The flux of is slightly lower than the flux reported in the ASCA observations of Paul et al. (2000), ranging from . We consider this discrepancy as negligible because the authors of the ASCA observation note the possibility of a flux overestimation due to limited spectral resolution.
Pulse phase resolved spectroscopy allowed us to disentangle the different phase dependencies of the relevant parameters (Fig. 4): The blackbody temperature is constant with pulse phase, although taken at face value there is a 12% variation with phase and a slightly lower temperature at phase 0.3. The flux of both, black body and power law, follows the double peaked pulse profile (Fig. 4a), although but for the powerlaw flux variation the peak at phase is suppressed. This is reasonable if one takes into account the hardening of the power law at phase .
As has been pointed out, e.g., by Özel (2001) and Özel (2002), observed pulse profile variations in AXPs can be used to test emission models for magnetars. These models predict a fan beam plus pencil beam emission pattern and a resulting pulse profile variation that is strongly dependent on the characteristics of the emitting plasma. The observed pulsed fraction depends on the angle between the magnetic field axis and the rotation axis of the neutron star as well as on the angle between the observer’s line of sight and the rotational axis. As shown by Özel et al. (2001), the high pulsed fractions of most AXPs argue for the radiation to come from a single emitting region on the neutron star, e.g., caused by a region of enhanced magnetic activity on the neutron star (Özel 2002), although the parameters of 4U 0142+61 are still barely compatible with two emission regions (Özel et al. 2001). We can confirm this conclusion of a single emission region from the XMM-Newton data, which shows only a small change of the pulsed fraction with energy, which is in contrast to the strong energy dependence expected from models with two antipodal emission regions.
Using phase resolved X-ray spectroscopy, it is in principle possible to further constrain these emission models. In terms of the empirical spectral model applied here, magnetar models predict that the blackbody and powerlaw components should be coupled through resonant Compton heating of photons scattered at cyclotron resonances (see also Thompson et al. 2002). This coupling results in pulse profiles which are predicted to have essentially the same shape over the 1–10 keV energy range. In our observations, this predicted behaviour cannot be fully confirmed: Both, the energy resolved profiles as well as the decomposition of the pulse into a blackbody and a powerlaw component show only little correlation. For example, Pearson’s correlation coefficient, , of the component fluxes of the black body and the powerlaw is only . On the other hand, however, the similar variation of both model components suggest that there is a common flux contribution superimposed with an spectral variation of the powerlaw. This would explain the decrease of the pulse at phase with higher energies.
In summary, in this paper we were able to show that phase resolved spectroscopy adds power to constrain existing models and allows in principle to test different hypotheses describing the physical geometry of the system. Further and longer observations and further modeling are required, however, until these tests will yield a conclusive and selfconsistent answer on the emission process at work.
Acknowledgements.
We acknowledge the support through DLR grants 50 OX 0002 and 50 OG 9601. This work is based on observations obtained with XMM-Newton, an ESA science mission with instruments and contributions directly funded by ESA Member States and the USA (NASA).References
- Chatterjee & Hernquist (2000) Chatterjee, P. & Hernquist, L. 2000, ApJ, 543, 368
- Ehle et al. (2003) Ehle, M., Breifellner, M., Riestra, R. G., et al. 2003, XMM-Neton User’s Handbook, 2nd edn., ESA
- Gavriil & Kaspi (2002) Gavriil, F. P. & Kaspi, V. M. 2002, ApJ, 567, 1067
- Heyl & Hernquist (1997) Heyl, J. S. & Hernquist, L. 1997, ApJ, 489, L67
- Hulleman et al. (2004) Hulleman, F., van Kerkwijk, M. H., & Kulkarni, S. R. 2004, A&A, 416, 1037
- Israel et al. (2002) Israel, G., Mereghetti, S., & Stella, L. 2002, Mem. Soc. Astron. Ital., 73, 465
- Israel et al. (1994) Israel, G. L., Mereghetti, S., & Stella, L. 1994, ApJ, 433, L25
- Juett et al. (2002) Juett, A. M., Marshall, H. L., Chakrabarty, D., & Schulz, N. S. 2002, ApJ, 568, L31
- Kern & Martin (2002) Kern, B. & Martin, C. 2002, Nat, 417, 527
- Kirsch (2003) Kirsch, M. 2003, EPIC status of calibration and data analysis, Tech. Rep. 2.1, XMM-Newton, Science Operation Centre, xMM-SOC-CAL-TN-0018
- Leahy et al. (1983) Leahy, D. A., Darbro, W., Elsner, R. F., et al. 1983, ApJ, 266, 160
- Özel (2001) Özel, F. 2001, ApJ, 563, 276
- Özel (2002) —. 2002, ApJ, 575, 397
- Özel et al. (2001) Özel, F., Psaltis, D., & Kaspi, V. M. 2001, ApJ, 563, 255
- Patel et al. (2003) Patel, S. K., Kouveliotou, C., Woods, P., et al. 2003, ApJ, 587, 367
- Paul et al. (2000) Paul, B., Kawasaki, M., Dotani, T., & Nagase, F. 2000, ApJ, 537, 319
- Strüder et al. (2001) Strüder, L., Briel, U., Dennerl, K., et al. 2001, A&A, 365L, 18
- Thompson & Duncan (1995) Thompson, C. & Duncan, R. C. 1995, MNRAS, 275, 255
- Thompson et al. (2002) Thompson, C., Lyutikov, M., & Kulkarni, S. R. 2002, ApJ, 574, 332
- Turner et al. (2001) Turner, M. J. L., Abbey, A., Arnaud, M., et al. 2001, A&A, 365L, 27
- van Paradijs et al. (1995) van Paradijs, J., Taam, R. E., & van den Heuvel, E. P. J. 1995, A&A, 299, L41
- White et al. (1996) White, N. E., Angelini, L., Ebisawa, K., Tanaka, Y., & Ghosh, P. 1996, ApJ, 463, L83