A Wide-Field H i Study of the NGC 1566 Group††thanks: The observations were obtained with the Australia Telescope which is funded by the Commonwealth of Australia for operations as a National Facility managed by CSIRO.
Abstract
We report on neutral hydrogen observations of a field around the NGC 1566 galaxy group with the multibeam narrow-band system on the 64-m Parkes telescope. We detected thirteen H i sources in the field, including two galaxies not previously known to be members of the group, bringing the total number of confirmed galaxies in this group to 26. Each of the H i galaxies can be associated with an optically catalogued galaxy. No ’intergalactic H i clouds’ were found to an H i mass limit of . We have estimated the expected H i content of the late-type galaxies in this group and find the total detected H i is consistent with our expectations. However, while no global H i deficiency is inferred for this group, two galaxies exhibit individual H i deficiencies. Further observations are needed to determine the gas removal mechanisms in these galaxies.
keywords:
surveys, radio lines: galaxies, galaxies: individual (NGC 1566, NGC 1533, NGC 1549, NGC 1553), galaxies: clusters: general.1 Introduction
 |
The majority of galaxies in the Universe reside in galaxy groups (e.g. Tully 1987). However the physical processes operating in groups are poorly understood, and no detailed census of their contents is available. Studies of neutral hydrogen in groups have previously concentrated almost exclusively on Hickson Compact Groups (e.g. Shostak, Allen & Sullivan 1984; Verdes-Montenegro et al. 2001), as they require small observing regions. Studies of loose groups, which are more extended, are much fewer in number. The advent of the multibeam receiver on the Parkes telescope (Staveley-Smith et al. 1996) has made the study of loose groups feasible, and the success of the instrument has been shown with new group members being found in H i surveys of optically well studied groups. For example, ten new members were found in the Centaurus A group as part of the H i Parkes All Sky Survey, HIPASS (Banks et al. 1999) and new dwarf galaxies were found in H i surveys of the NGC 5044 and NGC 1052 groups (McKay et al. 2004). Several new galaxy groups were identified in the HIPASS Bright Galaxy Catalogue (BGC, Koribalski et al. 2004).
H i surveys of groups can reveal the effects of tidal interactions in these environments (Haynes, Giovanelli & Chincarini 1984). One of the best examples of this is the VLA survey of the M81 group by Yun et al. (1994), where the H i distribution encompasses the major galaxies in the group with many streams and tidal tails. Further tidal tails were observed when the M81 group was observed during the H i Jodrell All Sky Survey, HIJASS (Boyce et al. 2001). Blind H i surveys of groups can turn up unexpected results. For example, Barnes & Webster (2001) imaged the H i environment in five nearby galaxy groups, leading to the discovery of a ring of H i gas encircling the compact core of the loose group LGG 138. H i surveys can also uncover information about galaxy formation and evolution in groups. This was the case when a large bridge of H i was discovered with Australia Telescope Compact Array (ATCA) mapping of the NGC 6221/6215 galaxy group (Koribalski & Dickey 2004).
Cold Dark Matter theory predicts many more low-mass galaxies surrounding large galaxies than are actually observed in groups (e.g. Moore et al. 1999, Klypin et al. 1999). Searches for these low-mass satellites have been made in H i in several nearby groups such as Centaurus A and Sculptor (de Blok et al. 2002), NGC 5798, 5962, 5970, 6278, 6500 and 6574 to a limit of (Zwaan 2001), and NGC 1808 (Dahlem et al. 2001). More recently, Pisano et al. (2004) surveyed three groups (LGG 93, LGG 180 & LGG 478), similar in size and structure to the Local Group, for low-mass H i clouds (to an H i mass sensitivity of ). No population of H i rich satellites with little, or no optical emission were uncovered in any of the above surveys, leading to the conclusion that massive H i clouds are rare in the group environment. However, to date, no H i surveys have been deep enough to rule out a population of low-mass ( ) H i clouds.
Pointed H i surveys of groups and clusters of galaxies have generally found a trend for galaxies to be H i deficient as a function of distance from their centre. Verdes-Montenegro et al. (2001) found in a homogeneous survey of 48 Hickson Compact Groups (HCGs) that they contained only 40% of the expected H i mass, based on the optical properties of the individual galaxies. Solanes et al. (2001) analysed the H i properties of 18 clusters, and found that two-thirds of their sample were H i deficient in the central regions (within the Abell radius). However, a recent study of the H i content of compact groups of galaxies (Stevens et al. 2004) has found no strong evidence for an H i deficiency in their sample (15 groups). Their study highlights the large uncertainties inherent in determining the expected H i mass of a galaxy based on its optical properties.
We are conducting wide-field H i observations as part of the Group Evolution Multiwavelength Study (GEMS) (Osmond & Ponman 2004, hereafter OP04; McKay et al. 2004), containing groups selected to have existing ROSAT PSPC X-ray observations. OP04 detail the selection criteria and X-ray properties of the groups. Seventeen of these groups in the southern hemisphere were surveyed for H i with the multibeam narrow-band system on the 64-m Parkes telescope. The main aims of this H i survey are to provide a census of the H i gas in groups, to find new group members and possible intergalactic H i clouds, and to make a direct comparison between hot and cold gas in the group environment for the first time. Here we report on our H i results for the NGC 1566 group.
1.1 The NGC 1566 Galaxy Group
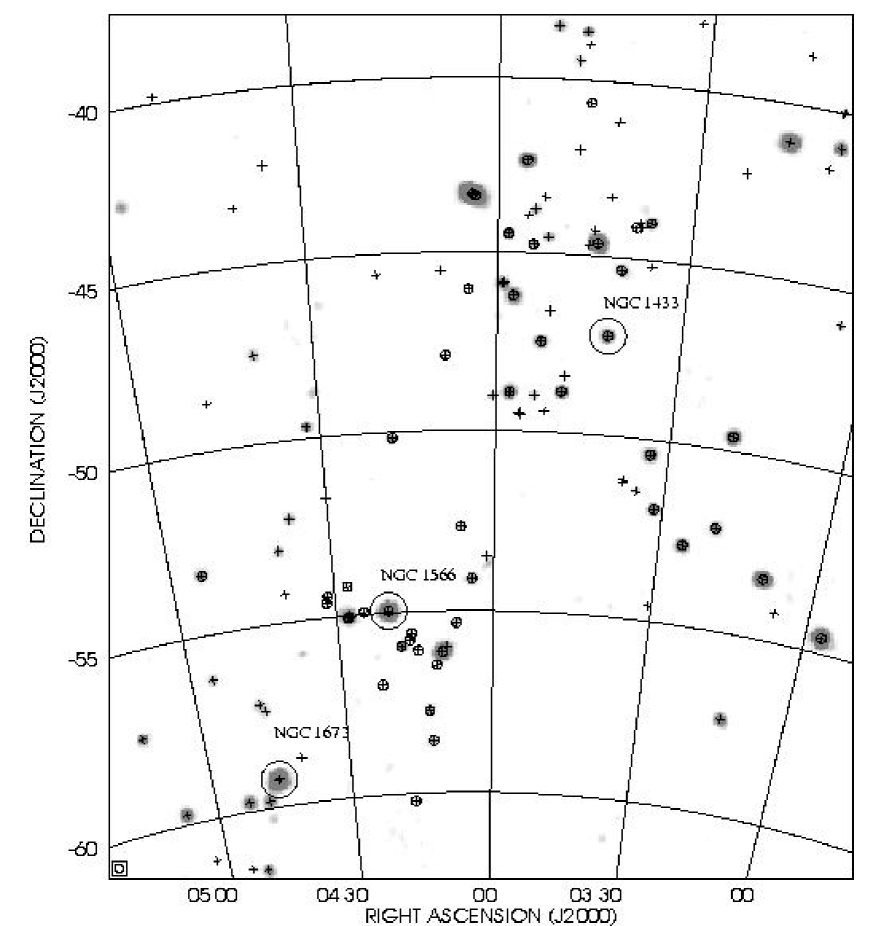
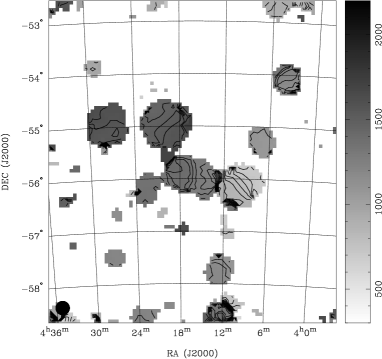
NGC 1566 is the brightest spiral member of a nearby group of galaxies in Dorado at a distance of about 21 Mpc (OP04). This distance, and an Ho = 70 km s-1 Mpc-1 is used throughout the paper. The Dorado group (see Fig. 1) consists of at least 46 galaxies (Maia et al. 1989) and covers a velocity range from 500 to 2000 km s-1. It is part of the Fornax Wall which connects the NGC 1672, NGC 1566 and NGC 1433 galaxy groups.
Figure 1 shows the H i distribution of the Dorado group. The positions of known optical galaxies are marked. This map was derived from the HIPASS111http://www.atnf.csiro.au/research/multibeam data cubes which have a velocity resolution of 18 km s-1 (see Barnes et al. 2001). The AIPS task momnt was used with Hanning smoothing over five channels (65 km s-1), five pixels (20′) and a flux density cutoff, after smoothing, of 20 mJy beam-1 per channel. The H i distribution of the region shows three distinct groupings of galaxies around the galaxies NGC 1433, NGC 1672 and NGC 1566. These three groups are at similar velocities and thus are part of the larger complex.
The NGC 1566 group has been the subject of several optical studies. Huchra & Geller (1982) catalogue 18 members in the group (which they call HG3). The group catalog by Garcia (1993) lists 6 members, and they derive a group recession velocity of 1292 km s-1 and a velocity dispersion of 99 km s-1. Ferguson & Sandage (1990), Morshidi-Esslinger et al. (1999) and Carrasco et al. (2001) surveyed various areas of the Dorado group in the optical and cataloged large numbers of mostly low luminosity dwarf galaxies as potential members. The LEDA database lists 24 galaxies with known velocities that lie within the NGC 1566 group, while the NASA Extragalactic Database (NED) lists 22 previously catalogued galaxies in the region.
Several members of the NGC 1566 group have been previously mapped in H i at the ATCA. Walsh (2004) studied the H i dynamics of the spiral galaxy NGC 1566 itself, finding a nearly circular H i envelope, and a total dynamical mass of . Many other observations have been made of this object, including CO (Bajaja et al. 1995), H (Pence, Taylor & Atherton, 1990), H i (Reif et al. 1982), and X-ray and radio continuum (Ehle et al. 1996). NGC 1533 is a nearby, early-type galaxy with two small companions, IC 2038/9. Recent ATCA observations obtained by Ryan-Weber, Webster & Bekki (2002) reveal an asymmetric H i ring surrounding the optical galaxy, with only a small amount of H i associated with IC 2038 and none with IC 2039. The interacting pair of galaxies NGC 1596/1602 has recently been mapped in H i at the ATCA (Chung et al. 2004).
OP04 studied the X-ray properties of the NGC 1566 group using ROSAT PSPC observations. They found galaxy halo emission around NGC 1566 itself, (log = 40.41 erg s-1, see their Table 4), but no group-scale emission. This suggests that the group is relatively young and not yet virialised. The NGC 1566 group centre and radius, as defined in the GEMS sample (see OP04, their Table 1), is (J2000) = 006, –54° 56′ 17″ and = 0.47 Mpc, where is the radius at 500 times the critical density of the Universe at the current epoch. OP04 derive a group velocity of km s-1 and a velocity dispersion of km s-1, based on the nine group members within and . The total -band luminosity of the NGC 1566 group based on these nine members is L⊙.
In this paper we present our H i survey of the NGC 1566 group. In Section 2 we summarize the observations and data reduction, along with the source detection and optical identification. In Section 3 we give the results from the H i survey. Discussion of the results is provided in Section 4, including the optical properties and H i content of the group, X-ray properties, and dynamics. Finally we present our conclusions in Section 5.
2 Observations and data reduction
| Gridded beam size | 155 |
|---|---|
| Total observing time | 18.5 hr |
| Velocity range | 400 – 2080 km s-1 |
| Channel width | 1.65 km s-1 |
| Velocity resolution | 2.6 km s-1 |
| rms noise per channel | 18.8 mJy |
| No. | (J2000) | Speak | rms | Order | Box | |||||
|---|---|---|---|---|---|---|---|---|---|---|
| [], [° ′ ″] | [km s-1] | [km s-1] | [km s-1] | [Jy] | [Jy km s-1] | [Jy] | [] | |||
| (1) | (2) | (3) | (4) | (5) | (6) | (7) | (8) | (9) | (10) | (11) |
| 1 | 4:12:11,58:34:17 | 1466 3 | 55 6 | 102 9 | 0.1060.009 | 5.7 0.7 | 0.008 | 3 | 5 | 5.9 0.7 |
| 2 | 4:10:51,56:30:32 | 1310 7 | 104 14 | 129 21 | 0.0280.007 | 2.0 0.6 | 0.006 | 3 | 5 | 2.1 0.6 |
| 3 | 4:12:39,57:45:50 | 1176 3 | 189 6 | 214 9 | 0.0760.008 | 8.7 0.9 | 0.004 | 3 | 5 | 9.0 0.9 |
| 4 | 4:27:25,57:27:21 | 1215 7 | 75 14 | 137 21 | 0.0480.007 | 3.2 0.6 | 0.005 | 3 | 5 | 3.3 0.6 |
| 5 | 4:09:42,56:06:55 | 796 3 | 247 6 | 324 9 | 0.3820.020 | 73.7 2.9 | 0.012 | 3 | 13 | 76.5 3.0 |
| 6 | 4:22:42,56:16:59 | 1350 4 | 52 8 | 76 12 | 0.0490.007 | 2.4 0.5 | 0.005 | 7 | 5 | 2.5 0.6 |
| 7 | 4:14:40,56:04:25 | 1298 5 | 189 10 | 343 15 | 0.1400.010 | 23.2 1.3 | 0.011 | 3 | 13 | 24.1 1.4 |
| 8 | 4:17:56,55:57:06 | 1370 2 | 193 4 | 218 6 | 0.1240.009 | 16.4 1.1 | 0.004 | 3 | 5 | 17.1 1.2 |
| 9 | 4:07:10,55:18:01 | 1068 3 | 99 6 | 119 9 | 0.0730.008 | 5.9 0.7 | 0.005 | 3 | 5 | 6.1 0.8 |
| 10 | 4:19:53,54:56:46 | 1502 1 | 200 2 | 223 3 | 1.0400.052 | 148.1 6.4 | 0.009 | 3 | 13 | 153.9 6.7 |
| 11 | 4:27:45,55:01:08 | 1572 3 | 93 6 | 174 9 | 0.2830.016 | 28.1 1.6 | 0.009 | 3 | 11 | 29.2 1.7 |
| 12 | 4:03:56,54:05:04 | 1180 2 | 357 4 | 381 6 | 0.1010.009 | 15.9 1.1 | 0.004 | 3 | 5 | 16.5 1.2 |
| 13 | 4:05:42,52:41:01 | 902 2 | 88 4 | 103 6 | 0.0790.008 | 4.8 0.6 | 0.007 | 3 | 5 | 5.0 0.7 |
Our observations of the NGC 1566 group follow the approach described in McKay et al. (2004). We scanned a field of dimensions using the Parkes 64 m radiotelescope with the 21 cm Multibeam Receiver [Staveley-Smith et al. 1996] installed at the prime focus. Observations were acquired in the periods 2002 January 11–18, 2002 March 8–9 and 2003 May 3–5. The field was centred at (J2000) = 04h16m00s, 553500. Scans were made at a rate of one degree per minute, along lines of equatorial latitude and longitude separated by 4 arcmin. A total of 198 scans were acquired.
Data were reduced using livedata, a component of the aips++ package. On input, raw correlator spectra were convolved with a Hanning filter to eliminate ringing from narrow and bright emission sources. Subsequent processing steps were based on those for HIPASS data [Barnes et al. 2001] and previous GEMS data [McKay et al. 2004], with changes made to improve dynamic range near bright sources, and to track the time evolution of the (source-free) sky at higher order. Bandpass correction was applied on a per-beam, per-scan basis by iteratively clipping the data and fitting a 2nd degree polynomial to the time series of each channel. Data acquired within 20 arcmin of known H i sources in the field (based on a first, quick process and search step) were masked during fitting to prevent contamination of the calculated bandpass. Each bandpass-removed spectrum was frame-shifted to the barycenter of the Earth-Sun system, and then baselined by subtracting a source-masked, iterative, clipped 2nd-degree polynomial fit, this time in the spectral domain.
Calibrated, processed spectra were imaged using the gridzilla component of aips++, which is described in Barnes et al. (2001). We used the wgtmed statistic, which calculates mesh pixel values by taking the weighted median of data within 6 arcmin of the centre of each pixel.222For comparison, HIPASS images use the gridzilla median statistic which is the median of weighted values The weight values were directly proportional to the canonical, Gaussian observing beam profile which has a FWHM of arcmin. We produced 2026 channel maps, centred on km s-1, with velocity widths of km s-1.
The gridded cube was smoothed in the spectral domain again with a Hanning filter three channels wide, and every second channel was discarded. The velocity resolution of the image was then measured, yielding a FWHM spectral resolution of km s-1. The channel separation in the final cube is 1.65 km s-1. The rms noise in the final cube is measured to be 18.8 mJy per channel. The final gridded beamsize is 15.5 arcminutes, and the pixel size is 4′ square. The final cube parameters are summarised in Table 1.
 |
2.1 Source Finding
The H i data cube was searched visually for sources using the kview visualisation program (Gooch 1995). Two of us (VAK & RCM) catalogued sources from the original cube, and also from two smoothed versions of the cube, with final velocity resolution of 3.3 km s-1 and 6.6 km s-1. The rms in the smoothed cubes was 11 mJy beam-1 and 8 mJy beam-1 respectively. To determine the detection limit for sources in the cube, and as an extra check for the searching, twenty fake point sources were injected randomly into the original cube. These sources had a range of peak flux density between 1030 mJy, and velocity width of 50500 km s-1. Two fake-injected cubes were made, to ensure if one of the randomly placed fake sources lay upon a real H i signal, the other cube would likely have it unobscured. Both the unsmoothed, and two smoothed versions were searched for sources, as with the original datacube. From the recovery rate of fake sources, we have determined our survey to be complete to a peak flux density limit of 58 mJy () in the unsmoothed cube. While we did detect a number of sources below this limit, the sources with the lowest peak flux density were detected in the smoothed cubes only. No relationship with velocity width was seen with the detectability of these fake sources. Assuming a galaxy velocity width of 100 km s-1 and a Gaussian H i profile, this translates to an H i mass limit of ( for a velocity width of 300 km s-1).
 |
 |
2.2 Derivation of the HI parameters
Once the source list was made, the H i parameters for each detection were derived using miriad routines (Sault et al 1995) on the smoothed cube (velocity resolution 6.6 km s-1). A zeroth order moment map (moment) was made for the velocity range of emission of each detection. The central point of emission was then determined by using imfit to fit a 2 dimensional Gaussian to this moment map. This central position was then used in the task mbspect to make a spectrum of the source.
A spectrum for each source was produced using a box size of 5 pixels in width (20 arcmin), assuming a point source. The 20% and 50% velocity widths (taken as the maximum width fit in mbspect), integrated flux density (robust moment 0) and peak flux density for each source were also determined with mbspect. The heliocentric velocity for a source was determined to be the centre point of the 20% velocity width (in the optical convention).
The integrated flux density was also measured for a box size of 7 pixels to determine if any extended emission surrounded the detection. Four of the galaxies were found to have extended emission. These four sources were fitted in a similar way to above, but in this case, the flux within the box was summed rather than assuming a point source, and the box size was iteratively increased until the total flux density was constant. The final parameters for all galaxies detected in H i are given in Table 2, including the fit parameters for the spectra. The H i mass of each detection was determined using = , where is the integrated H i flux density in Jy km s-1 (see Table 2), and D is the distance to the group in Mpc (21 Mpc for the NGC 1566 group).
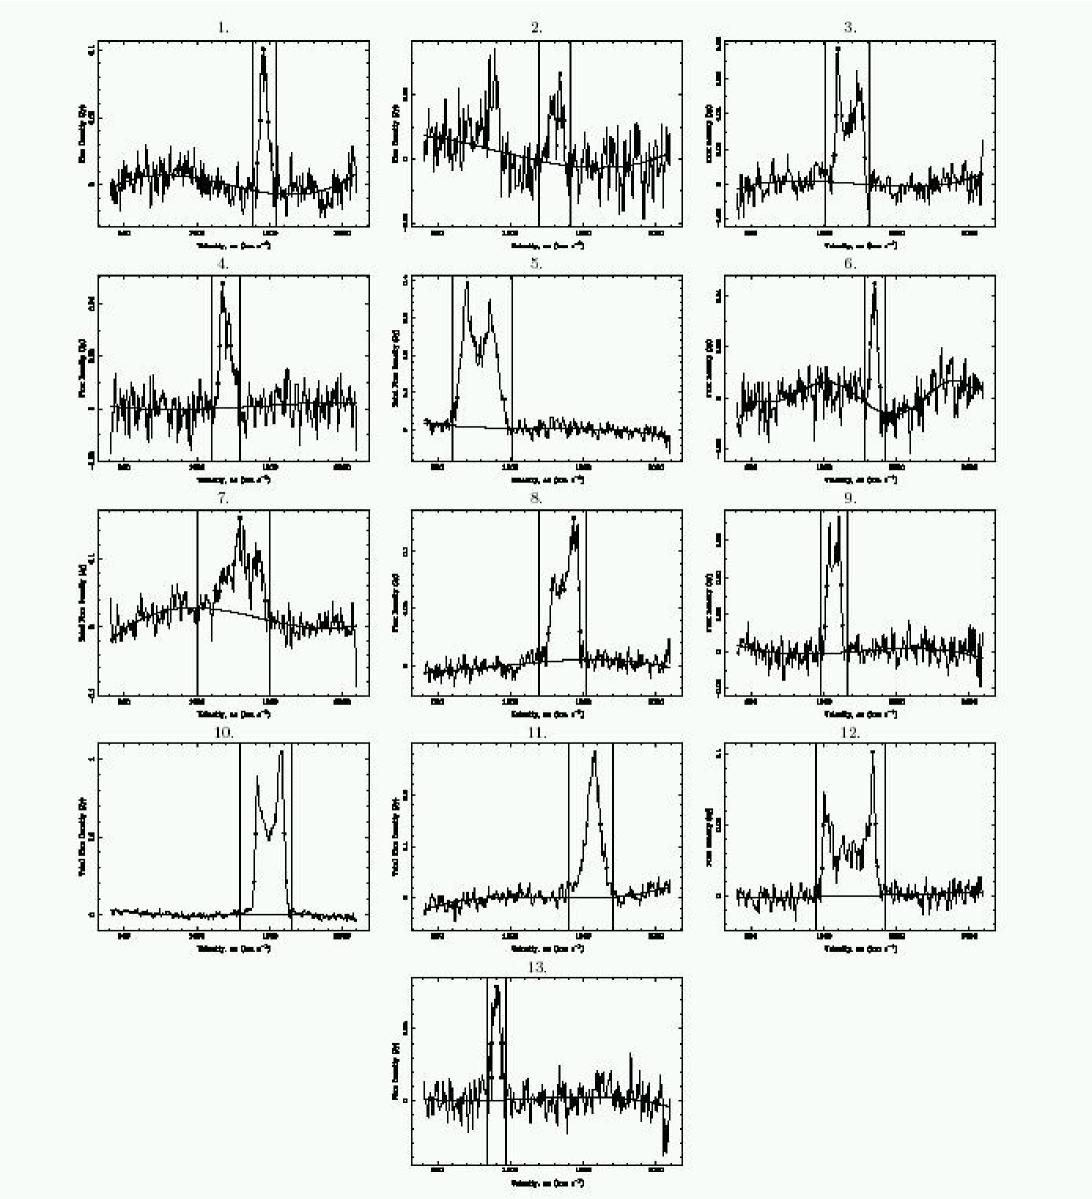
H i spectra for each of the galaxies are shown in Figure 2. These spectra show the fitted baseline, the region excluded from the baseline fit with the vertical lines, and the 20% and 50% velocity widths are shown by the crosses (minimum) and circles (maximum). The peak flux density is shown with a filled circle.
Uncertainties on the derived parameters were calculated according to Koribalski et al. (2004). Detections with low H i flux have large uncertainties in the determined velocity, as do detections with asymmetric profiles. The uncertainty on the peak flux density is always greater than the rms noise of the fitted cube. Positional uncertainties are not quoted. However, the positional uncertainty of the H i detections can be calculated as the gridded beamsize divided by the signal-to-noise (Koribalski et al. 2004).
2.3 Optical Identification of the H i Detections
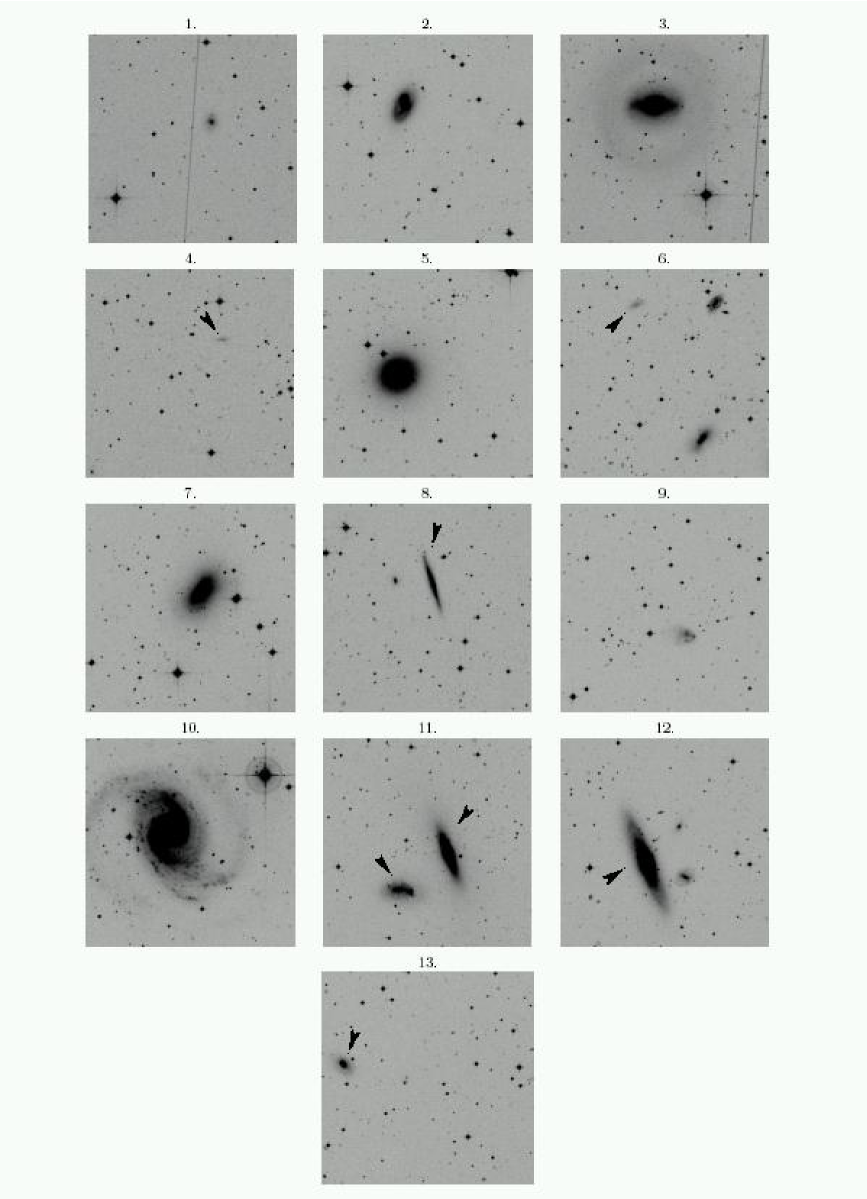
Optical identification of the H i detections was made using the NASA Extragalactic Database (NED). A 6 arcmin region around the central point of the H i emission was searched for previously catalogued galaxies of either the same redshift or unknown redshift in NED. Table 3 gives the identifications for the H i detections, with their previously determined velocities. Eleven H i sources in the NGC 1566 group had matching optical counterparts. Of these, two H i sources (#5 and #11) correspond to catalogued galaxy pairs. The remaining two H i detections had no previously catalogued galaxy of known redshift nearby, and further high resolution observations were necessary to determine the optical counterparts to these sources (see Section 3 for details). Optical images for each detection were downloaded from the Digital Sky Survey333The Digital Sky Survey, provided by the Space Science Institute, based on photographic data from the UK Schmidt Telescope. for each of the galaxies. These can be seen in Figure 3. The DSS images are 10 arcminutes square, and are in -band. A variety of galaxy types can be seen from bright spirals and elliptical galaxies to small, faint dwarf galaxies. The optical characteristics for all galaxies are given in Table 3.
3 Results
3.1 H i Properties of the NGC 1566 Group
 |
 |
The H i distribution for the NGC 1566 group is shown in Figure 4(a), and the mean H i velocity field is shown in Figure 4(b). These were derived from the narrow-band data cubes. After Hanning smoothing the data to the same spectral resolution as HIPASS, we used the AIPS task momnt (same smoothing parameters as for Figure 1) to derive these H i moment maps. Because of varying baseline curvature (see Fig. 2) these moment maps are not as sensitive as the individual H i spectra. We used a flux density cutoff of 10 mJy beam-1.
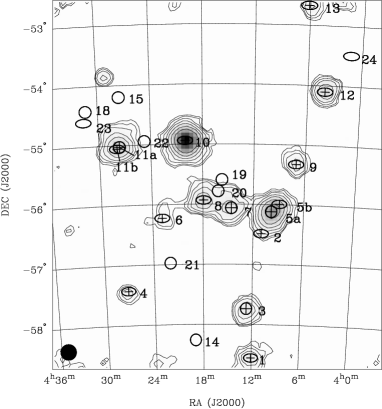
We detected 13 sources in the H i datacube, compared with 24 optical galaxies with known velocities in the region from LEDA. Two of the H i sources correspond to interacting galaxy pairs. We also determined the redshift for two galaxies previously not known to be group members, thus taking the number of known members for this group to 26. The spatial distribution of all known galaxies in the NGC 1566 group is over-plotted on the H i distribution in Figure 4a. The crossed symbols are those detected in H i and open symbols were not detected in our survey. The ovals represent late-type galaxies, and the circles are E/S0 galaxies. The H i distribution shows an apparent connected feature encompassing galaxies #2, #5a, #5b , #6, #7, #8 and #20. However, except for around the interacting system of NGC 1533/IC 2038, it is likely that the this apparent feature is due to smearing of the beam in the H i dataset, and higher resolution H i observations of the region are needed determine the nature of the H i distribution.
Nine known members of the NGC 1566 group were not detected in our H i survey (to an H i mass limit of ), and two further members were outside the survey region. We detected four E/S0 galaxies in H i but did not detect seven other early-type galaxies previously determined to be in the group. There was one irregular and one Sa galaxy not detected in H i but all other known spiral/late-type galaxies were detected in H i. NGC 1553 has previously been reported as detected in H i (de Vaucouleurs et al. 1991), however the resolution of our Parkes data is too coarse to determine a separate detection for this galaxy.
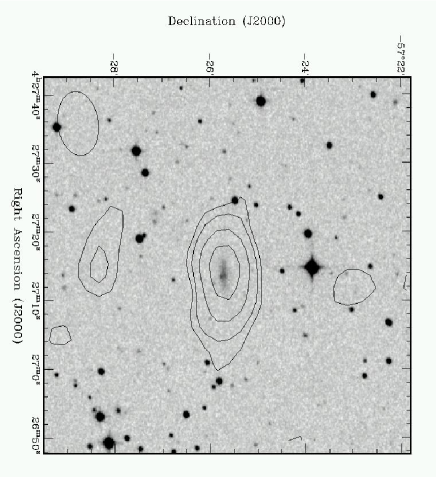
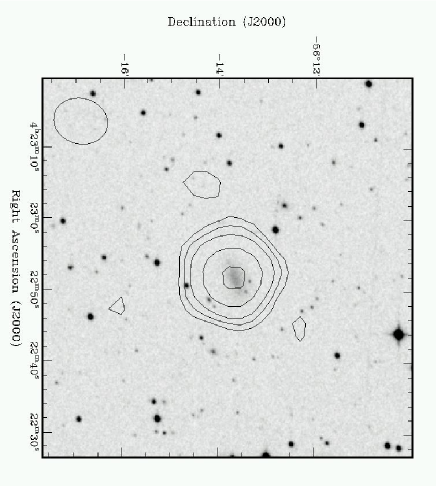
The two new group members were observed at the Australia Telescope Compact Array from 2004 March 3-7. The data were reduced using standard MIRIAD routines, and the resulting H i distributions are shown in Figure 5. Both of the H i detections correspond to previously catalogued low surface brightness irregular galaxies with blue luminosities around . These two galaxies are LSBG F157-081 & APMBGC 157+016+068 (as named in NED), and both have no previous known redshift. The H i mass (as determined from the Parkes data) for the two galaxies is and respectively. Both of these new group members were unresolved in the ATCA H i maps.
The H i mass of the sources we detected in the Parkes data range from to (see Figure 6). The highest H i mass galaxy was NGC 1566 itself. This galaxy is extended in the Parkes beam. We detect an integrated H i flux density of Jy km s-1, which is consistent with previously measured values. The HIPASS Bright Galaxy Catalogue (BGC; Koribalski et al. 2004) measured Jy km s-1, as do Mathewson & Ford (1996). Walsh (2004) measured Jy km s-1 and from Parkes and the ATCA respectively for NGC 1566. The total H i mass we detected in the NGC 1566 group is 3.5 , thus the galaxy NGC 1566 itself accounts for nearly half the H i in the group. We found that over half the galaxies in this group have H i masses less than .
 |
 |
3.2 Optical Properties of the NGC 1566 group
The total -band magnitudes for all known members in the NGC 1566 group are listed in Table 3. Total luminosities were determined from these magnitudes (after the magnitudes were corrected for Galactic extinction (Schlegel et al. 1998)), and are also listed in this table. The highest luminosity galaxy in the NGC 1566 group is NGC 1553, with a luminosity of . NGC 1553 is an S0 galaxy that was undetected in our H i survey. The second brightest galaxy in the group is NGC 1566 with . The two lowest luminosity galaxies are the two new members detected in our H i survey, LSBG F157-081 and APMBGC 157+016+068, with luminosities of 9 and 1.3 respectively.
The H i mass to -band luminosity ratio (/) for the galaxies in the NGC 1566 group varies from for the early type galaxies NGC 1553 and NGC 1549, to 3.7 for the dwarf irregular galaxy LSBG F157-081. The total -band luminosity for the group is 1.8 , compared to the total H i mass of the group of 3.5 . This gives an overall / of 0.19 /. The two new group members have / of 3.7 and 1.9, which confirms H i surveys are a good way of detecting gas-rich, low luminosity group members.
Using the -band magnitudes, we have constructed a luminosity histogram for this group. This is shown in Figure 6. Shown is the total luminosity distribution for the group, and that for only those galaxies detected in H i (NB: only single H i detections are included in the second sample). We find that the H i detected galaxies span the full range of the optical luminosity distribution, and have a similar shape to the total luminosity distribution. Similar to the H i mass distribution for this group, half of the galaxies in the group have . The optical galaxy numbers drop off towards of , which corresponds to the optical limit for previous redshift surveys of the region.
| Galaxy No. | Galaxy Name | Velocity | Morphology | -band magnitude | / | |
| (1) | (2) | (3) | (4) | (5) | (6) | (7) |
| 1 | IC 20491 | 1086 | Sd | 14.56 | 6.6 | 0.9 |
| 2 | NGC 1536 | 1565 | Sc pec | 13.29 | 21.3 | 0.1 |
| 3 | NGC 1543 | 1094 | S0 | 10.67 | 237.9 | 0.04 |
| 4 | LSBG F157–081 | Irr | 16.72 | 0.9 | 3.7 | |
| 5a | NGC 1533 | 668 | S0 | 11.74 | 88.8 | |
| 5b | IC 2038 | 712 | Sd pec | 14.82 | 5.2 | |
| 6 | APMBGC 157+016+068 | Irr | 16.32 | 1.3 | 1.9 | |
| 7 | NGC 1546 | 1160 | S0 | 12.31 | 52.5 | 0.5 |
| 8 | IC 2058 | 1268 | Sc | 13.90 | 12.1 | 1.4 |
| 9 | IC 2032 | 1070 | Im | 14.78 | 5.4 | 1.1 |
| 10 | NGC 1566 | 1449 | Sbc | 10.19 | 370.2 | 0.4 |
| 11a | NGC 1596 | 1465 | S0 | 12.01 | 69.2 | |
| 11b | NGC 1602 | 1731 | Im | 13.79 | 13.4 | |
| 12 | NGC 1515 | 1216 | Sbc | 11.96 | 68.5 | 0.2 |
| 13 | NGC 1522 | 1012 | pec | 14.08 | 10.3 | 0.5 |
| 14 | ESO 118-0192 | 1133 | S0 pec | 14.90 | 4.8 | |
| 15 | ESO 157-030 | 1341 | E4 | 14.30 | 8.4 | |
| 16 | ESO 157-0473,4 | 1733 | S0/a pec | 15.52 | 2.7 | |
| 17 | ESO 157-0493 | 1729 | Sbc | 14.37 | 7.9 | |
| 18 | IC 2085 | 1010 | S0 pec | 14.26 | 8.7 | |
| 19 | NGC 1549 | 1214 | E0-1 | 10.48 | 283.4 | |
| 20 | NGC 15535 | 1239 | S0 | 10.10 | 402.2 | |
| 21 | NGC 1574 | 925 | S0 | 11.17 | 150.1 | |
| 22 | NGC 1581 | 1527 | S0 | 13.36 | 20.0 | |
| 23 | NGC 1617 | 1063 | Sa | 11.35 | 127.2 | |
| 24 | PGC 429411 | 1135 | Irr | 16.19 | 1.5 |
4 Discussion
4.1 H i Content and Deficiency
H i observations of galaxies in groups and clusters have shown some galaxies to be H i deficient near the centre of the group or cluster (Solanes et al. 2001; Verdes-Montenegro et al. 2001; Giovanelli & Haynes 1985). In order to determine whether the H i content of a galaxy in a group or cluster is deficient, normal or over-abundant, a good estimate of the expected H i is needed. The expected H i mass of isolated galaxies has been studied in the past using either the optical morphology and optical diameter of the galaxies (Solanes et al. 1996; Chamaraux et al. 1986; Haynes & Giovanelli 1984 [hereafter HG84]) or using blue magnitude and optical morphology (HG84). HG84 show that the H i content is more closely tied to the galaxy’s optical extent and morphological type, thus we use this method in the following analysis.
Optical properties for most previously catalogued galaxies in the HIPASS BGC (Koribalski et al. 2004) were obtained from LEDA, including morphological type, optical diameters and magnitudes (Koribalski et al. 2004). Following Solanes et al. (1996), we made a linear regression fit for optical diameter and H i mass to nearly 800 BGC galaxies. The galaxies were divided into morphological type from Sb to Irr, and the resulting linear regression coefficients, and (such that , where is the optical diameter of the galaxy in kpc) for each morphological type are listed in Table 4. The scatter in the H i masses, , and the number galaxies at each morphological type, N, are also given in Table 4. We use the morphology and optical diameter of the NGC 1566 group galaxies, and the coefficients given in Table 4, to determine their expected H i mass, . There are very small numbers of early-type galaxies in the BGC, thus there is a large error on calculating the expected H i mass for galaxies of optical morphology earlier than Sb. In particular, it is known that elliptical galaxies are rarely detected in H i (Sadler et al. 2001), and we do not discuss these galaxies further in this section.
| Type | N | |||
|---|---|---|---|---|
| Sb | 8.39 | 1.02 | 0.24 | 85 |
| Sbc | 8.39 | 1.05 | 0.29 | 130 |
| Sc | 8.30 | 0.99 | 0.27 | 134 |
| Scd | 7.80 | 1.38 | 0.24 | 88 |
| Sd | 7.12 | 1.97 | 0.26 | 75 |
| Sm | 7.70 | 1.45 | 0.28 | 84 |
| Irr | 7.29 | 1.9 | 0.33 | 141 |
We believe that the H i estimates from the BGC for late-type galaxies, especially Sd-Irr are more accurate than previous estimates. Low surface brightness late-type galaxies can be easily missed in optical surveys, and thus these potentially H i-rich galaxies will not have been included in a targeted H i survey. As late-type galaxies have a high detection rate in H i, we expect to have a more complete sample than optically based pointed H i surveys. Indeed, the latest H i estimate for late-type galaxies in the literature was HG84 who have a sample size of just 7 for irregular galaxies, whereas there are 141 in the BGC. We must bear in mind that we have no indication of how many late-type galaxies were not detected in the survey, thus the upper limit to the H i mass of undetected galaxies is not included in the linear regression fit.
We have calculated the expected H i mass for each galaxy in the NGC 1566 group, including previously catalogued members of known redshift that were not detected in our H i survey. To reduce the uncertainty in the calculation of expected H i mass, we limit our comparison to non-interacting galaxies of type Sb or later. Nine galaxies meet this criteria, including eight galaxies detected in our H i survey, and the undetected irregular galaxy PGC 429411. For comparison we calculate the expected H i mass using both the coefficients in Table 4, and those given in HG84. Figure 7 shows the expected H i mass versus the detected H i mass for the eight galaxies detected in our survey. The vertical error bars represent the scatter in the expected H i mass of a given H i mass and optical diameter for the BGC and HG84 samples. This figure shows that the expected H i mass from HG84 is always lower than that from the BGC.
The expected H i mass for most of the galaxies is consistent with what was observed, and considering the group as a whole, the NGC 1566 group does not appear to be H i deficient. Two galaxies have a slightly higher detected H i mass than was expected, and a further two galaxies display a marked H i deficiency. These latter galaxies are the Sbc spiral NGC 1515 and the peculiar Sc spiral NGC 1536, with times less H i detected than expected. While NGC 1515 is relatively isolated, NGC 1536 is situated spatially near the interacting galaxy pair of NGC 1533/IC 2038. However there is a large velocity difference between the pair and NGC 1536 of nearly 500 km s-1. The expected H i mass for the undetected irregular galaxy PGC 429411 is . As this H i mass lies near our detection limit for the H i survey, we are unable to tell whether this galaxy is H i deficient, or contains H i within the normal range.

4.2 Group Distribution and Dynamics

To study the dynamical state of the NGC 1566 group, we now derive the virial radius and velocity dispersion of the group members. The virial radius can be calculated using X-ray emission where the latter exists in the intra-group medium. The ROSAT PSPC data for the NGC 1566 group, along with other GEMS groups, are presented in OP04. The X-ray data cover a circular region of 2 degrees in diameter. OP04 find X-ray emission that is consistent with coming from NGC 1566 itself, i.e. no evidence for extended emission from the intra-group environment.
OP04 derived an radius of 470 kpc based on the X-ray temperature of 0.70 0.11 keV. However, the X-ray emission in the NGC 1566 group is dominated by hot gas in the halo of NGC 1566 itself, which reaches the background level at a radius of 29 kpc. So the temperature-based should be treated with some caution.
An alternative method for calculating is to use the group’s velocity dispersion and the virial theorem (see OP04). The accuracy of this method improves with the number of reliable galaxy velocities. Based on only 9 galaxies, OP04 derive a velocity dispersion for the group of 184 47 km/s. This would translate into an radius of 250 kpc.
A better estimate of the dispersion for the group uses all known group members. Velocities were taken from the literature for the optically known galaxies not detected in our H i survey. Without removing any spatial or velocity outliers, we use a biweight estimator with bootstrap errors as per Beers et al. (1990). This gives the average velocity of the group as km s-1, and velocity dispersion of km s-1. This velocity dispersion gives a radius of 386 kpc, and thus a virial radius, , of 580 kpc for the NGC 1566 group ( 3/2 ).
Figure 8 shows the velocity distribution versus the distance from the centre of the group. The solid line and dashed lines show and respectively. For this plot, the galaxy #19, NGC 1549, was chosen to be the center position as it is the brightest elliptical in the NGC 1566 group, and has a velocity very close to the mean velocity of the group.
Eleven galaxies associated with the NGC 1566 group lie within the virial radius of 580 kpc. A further 12 galaxies are located between . As such a large number of galaxies lie beyond the virial radius, it is possible this group is young and not yet virialised. There has been recent work on the evolution of galaxies lying outside the virial radius of groups and clusters. Simulations have shown that up to half of the galaxies that lie beyond the virial radius of a cluster may have traveled through the cluster center (Gill, Knebe & Gibson 2004; Ghigna et al. 1998). Thus the evolutionary history of these ’backsplash’ galaxies may have been influenced by this encounter, and mass loss of up to 40% or greater might be expected. Observationally, there is some evidence of H i stripped galaxies not only in the centres of clusters (e.g. Solanes et al. 2001), but also nearer the edges of clusters (Kenney, van Gorkom & Vollmer 2004; Vogt et al. 2004; Vollmer 2003). By determining the H i content of the galaxies in the GEMS groups we will be able to see if this trend continues in the less dense group environment. We have found two H i deficient galaxies in the NGC 1566 group, NGC 1536 and NGC 1515, which lie near or beyond the virial radius of the group. High resolution H i observations of these two H i deficient galaxies combined with H measurements (e.g. Vogt et al. 2004) will provide further information to the past history of these galaxies, particularly whether their gas removal mechanism is due to tidal interactions, ram pressure stripping, or a combination of the two.
5 Conclusions
We have conducted a blind H i survey of a region of 5.5° 5.5° in the NGC 1566 group. Thirteen galaxies were detected in the H i datacube, including two LSB dwarf galaxies that had no previously known redshifts (LSBG F157-081 & APMBGC 157+016+068), which are new group members. There are now 26 known members in the NGC 1566 group. Two H i detections have two or more optical counterparts, and are previously known interacting systems that are confused within our beamsize of 15.5 arcmin (NGC 1533/IC 2038, and NGC 1602/NGC 1596). No isolated H i clouds were detected in our survey to a limit of .
The total H i mass detected in the group was , and the galaxy NGC 1566 itself contains nearly half of the H i mass of this group, with = .
We calculate the virial radius of this group to be 580 kpc, and find over half the galaxies we associate with the group to lie beyond this radius. Thus it is possible that this is a young, non-virialised group. The total H i contained in the late-type galaxies of this group appears to be consistent with the expected H i content based on their optical diameter and morphology. However there are two cases in which a spiral galaxy appears to be 5-10 times more deficient than expected - these are NGC 1536 and NGC 1515. Further observations are needed of these two galaxies to determine their gas removal mechanisms.
Acknowledgments
Thanks to C. Mundell, N. McKay and S. Brough for help with the Parkes observations, and to R. Allen for assistance with the ATCA observations. We are grateful to D. J. Pisano and R. Braun for useful discussions relating to the data reduction, in particular ideas for source masking during bandpass estimation to improve dynamic range near bright sources. J. Osmond and T. Ponman are acknowledged for helpful discussions. We acknowledge the Parkes telescope staff and thank them for their assistance in the observations. Many thanks to M. Calabretta for continuing support of livedata. Thankyou to the anonymous referee for helpful comments.
This research has made extensive use of the NASA/IPAC Extragalactic Database (NED) which is operated by the Jet Propulsion Laboratory, Caltech, under contract with the National Aeronautics and Space Administration. The Digitized Sky Survey was produced by the Space Telescope Science Institute (STScI) and is based on photographic data from the UK Schmidt Telescope, the Royal Observatory Edinburgh, the UK Science and Engineering Research Council, and the Anglo-Australian Observatory. VAK acknowledges the support of an ARC/CSIRO Linkage Postdoctoral Fellowship.
References
- [1995] Bajaja, E., Wielebinski, R., Reuter, H.-P., Harnett, J. I., Hummel, E. 1995, A&AS, 114, 147
- [Banks et al. 1999] Banks, G. D., Disney, M. J., Knezek, P. M. et al. 1999, ApJ, 524, 612
- [Barnes et al. 2001] Barnes, D. G., Staveley-Smith, L., de Blok, W. J. G. et al. 2001, MNRAS, 322, 486
- [Barnes & Webster 2001] Barnes, D. G., Webster, R. L. 2001, MNRAS, 324, 859
- [1990] Beers, T. C., Flynn, K., Gebhardt, K., 1990, AJ, 100, 32
- [2002] de Blok, W. J. G., Zwaan, M. A., Dijkstra, M., Briggs, F. H., Freeman, K. C. 2002, A&A 382, 43
- [Boyce et al. 2001] Boyce, P.J., Minchin, R. F., Kilborn, V. A. et al. 2001, ApJL, 560, 127
- [1993] Carrasco E.R., Mendes de Oliveira C., Infante L., Bolte M. 2001, AJ 121, 148
- [1986] Chamaraux, P., Balkowski, C., Fontanelli, P. 1986, A&A, 1986, 165
- [2004] Chung A. et al. 2004, in preparation
- [2001] Dahlem, M., Ehle, M., Ryder, S. D. 2001, A&A 373, 485
- [1996] Ehle, M., Beck, R., Haynes, R. F. et al. 1996, A&A, 306, 73
- [1990] Ferguson H.C., Sandage A. 1989, AJ 100, 1
- [1993] Garcia A.M. 1993, A&AS 100, 47
- [1995] Gooch, R. 1995, in ASP Conf. Se. 77, Astronomical Data Analysis Software and Systems IV, ed R. A. Shaw, H. E. Payne, J. E. Haynes (San Fransisco: ASP), 144
- [1998] Ghigna, S., Moore, B., Governato, F. et al. 1998, MNRAS, 300, 146
- [2004] Gill, S. P. D., Knebe, A., Gibson, B. K. 2004, MNRAS, submitted
- [1985] Giovanelli, R. & Haynes, M. P. 1985, ApJ, 292, 404
- [1984] Haynes M. P. & Giovanelli, R. 1984, AJ, 89, 758
- [1984] Haynes, M. P., Giovanelli, R., Chincarini, G. L. 1984, ARAA, 22, 445
- [1982] Huchra, J. P., Geller, M. J. 1982, ApJ, 257, 423
- [1998] Katgert, P., Mazure, A., den Hartog, R., et al. 1998, A&A Suppl. Ser. 129, 399
- [2004] Kenney, J. D. P., van Gorkom, J. H., Vollmer, B. 2004, AJ, 127, 3375
- [1999] Klypin, A., Kravstov, A., Valenzuela, O., Prada, F. 1999, ApJ, 522, 82
- [2004] Koribalski, B. et al. in preparation
- [2004] Koribalski, B. & Dickey, J. M. 2004, MNRAS, 348, 1255
- [2004] Koribalski B. et al. 2004, AJ, 128, 16
- [1989] Lauberts, A. & Valentijn, E. A. 1989, in “The Surface Photometry Catalogue of the ESO-Uppsala Galaxies”, Garching Bei Munchen: European Southern Observatory
- [1996] Loveday, J., Peterson, B. A., Maddox, S. J., Efstathiou, G. 1996, ApJS, 107, 201
- [1990] Maddox, S. J., Sutherland, W. J., Efstathiou, G., Loveday, J. 1990, MNRAS, 243, 692
- [1989] Maia M.A.G., Da Costa L.N., Latham D.W 1989, ApJS 69, 809
- [1996] Mathewson D.S., Ford V.L. 1996, ApJS 107, 97
- [McKay et al. 2004] McKay, N. F., Mundell, C. G., Brough, S. et al. 2004, MNRAS, in press
- [1999] Moore, B., Ghigna, S., Governato, F. et al. 1999, ApJ, 524, 19
- [1999] Morshidi-Esslinger Z., Davies J.I., Smith R.M. 1999, MNRAS 304, 297
- [2004] Osmond, J.P.F., Ponman T.J. 2004, MNRAS, 350, 1511
- [1990] Pence, W. D., Taylor, K., Atherton, P. 1990, ApJ, 357, 415
- [2004] Pisano, D. J., Barnes, D. G., Gibson, B. K. et al. 2004, ApJL, 610, 17
- [1982] Reif K., Mebold, U., Goss, W.M., van Woerden, H., Siegman, B. 1982, A&A 50, 451
- [2003] Ryan-Weber, E., Webster, R., Bekki, K. 2003, in “The IGM/Galaxy Connection:The Distribution of Baryons at Z=0”, ASSL Conference Proceedings, Vol. 281, Edited by J. L. Rosenberg and M. E. Putman
- [2001] Sadler, E. M., 2001, in “Gas and Galaxy evolution”, ASP Conf. Se., 240, eds J. E. Hibbard, M. P. Rupen & J. H. van Gorkom, 445
- [Sault et al. 1995] Sault, R. J., Teuben, P. J., Wright, M. C. H. 1995, in ASP Conf. Se. 77, Astronomical Data Analysis Software and Systems IV, ed R. A. Shaw, H. E. Payne, & J. E. Haynes (San Francisco: ASP), 433
- [2000] Saunders, W., Sutherland, W. J., Maddox, S. J. 2000, MNRAS, 317, 55
- [1998] Schlegel D.J., Finkbeiner D.P., Davis M. 1998, ApJ 500, 525
- [1984] Shostak, G. S., Allen, R. J., Sullivan, W. T iii 1984, A&A, 139, 15
- [2001] Solanes, J. M, Manrique, A., Garcia-Gomez, C., et al. 2001, ApJ, 548, 97
- [1996] Solanes, J. M, Giovanelli, R., Haynes, M. P. 1996, ApJ 461, 609
- [Staveley-Smith et al. 1996] Staveley-Smith, L. et al. 1996, PASA, 13, 243
- [2004] Stevens, J. B., Webster, R. L, Barnes, D. G., Pisano, D. J., Drinkwater, M. J. 2004, PASA, in press
- [1987] Tully, R. B. 1987, ApJ, 321, 280
- [1991] de Vaucouleurs G., de Vaucouleurs A., Corwin Jr. H.G., Buta R.J., Paturel G., Fouqué P. 1991, “Third Reference Catalogue of Bright Galaxies” (New York: Springer Verlag), [RC3]
- [2001] Verdes-Montenegro, L., Yun, M. S., Williams, B. A., Huchtmeier, W. K., Del Olmo, A., Perea, J. 2001, A&A, 377, 812
- [2004] Vogt, N. P., Haynes, M. P., Giovanelli, R., Herter, T. 2004, AJ, 127, 3300
- [2003] Vollmer, B. 2003, A&A, 398, 525
- [2004] Walsh, W. 2004, New Astronomy, submitted
- [1994] Yun, M. S., Ho, P. T. P., Lo, K. Y. 1994, Nature, 372, 530
- [2001] Zwaan, M. A. 2001, MNRAS 325, 1142