The Aquarius Superclusters
II. Spectroscopic and
Photometric Data11affiliation: Partly based on observations at
European Southern Observatory (ESO) at the ESO Schmidt, and
the 1.52m telescope under the ESO-ON agreement;
Observatório do Pico dos Dias, operated by the
Laboratório Nacional de Astrofísica (LNA); and Complejo Astronomico El
Leoncito (CASLEO), operated under agreement between the Consejo Nacional de
Investigaciones Científicas de la República Argentina and the National
Universities of La Plata, Córdoba and San Juan.
Abstract
We present spectroscopic and photometric data for 920 galaxies selected in 68 fields of the Aquarius Cluster Catalog. Typically the 15 brightest candidate members with magnitudes in the range 16 21 were selected for observations, and 71% turn out to be cluster members. Using the new redshift determinations we assign galaxies to groups and clusters, and by including data from the literature we calculate systemic velocities and velocity dispersions for 74 clusters, each with redshifts measured for at least 6 individual galaxies.
1 Introduction
Because of the large number of galaxies contained by superclusters, before the era of large-scale multi-object surveys like 2dFGRS (Colless et al., 2001) and SDSS (Strauss et al., 2002) much of what is known of the properties of these structures has relied mainly on pointed observations, where only a sub-sample of supercluster members is observed spectroscopically. Examples of superclusters that have been studied using this strategy are Pisces-Perseus (e.g., Wegner, Haynes & Giovanelli, 1993), Hydra-Centaurus (e.g., da Costa et al., 1986, 1987), Coma-A1367 (e.g., Gregory & Thompson, 1978), Hercules (e.g., Barmby & Huchra, 1998), Shapley (e.g., Quintana, Carrasco & Reisenegger, 2000) and Corona Borealis (e.g., Postman, Geller & Huchra, 1988).
In Caretta et al. (2002), hereafter Paper I, we presented a list of candidates clusters and groups in the Aquarius region, comprising the area of sky limited by , and . Of the 102 candidates, 39 were new detections. We also presented mean redshifts for 31 previously unobserved clusters and improved redshifts for a further 35. About half of the observed candidates are single concentrations of galaxies, while the remainder are superposition of two or more poor clusters or groups along the line of sight. Using a percolation analysis on the data we found two superclusters of galaxies in Aquarius, one located at 0.086, and another at 0.112. These results differ from Batuski et al. (1999) who claimed finding a single structure of 110 h-1 Mpc oriented along the line of sight. More recent work by Smith et al. (2004), aimed at measuring the redshift distribution of weak lensing sources, probed a part of this region of sky using the Two Degree Field system. They detect 48 clusters in the region, of which 22 are in common with paper I sources.
In this paper we present the spectroscopic and photometric data of our survey. In section 2 we describe the photometric catalogs, the target selection and the spectroscopic procedure, from observations to redshift estimation. The spectroscopic and photometric data for the galaxies are described in section 3, while the catalog of mean radial velocities and velocity dispersions for the clusters is presented in section 4.
2 The Data
2.1 Photometric Catalog
The selection of galaxies for spectroscopic observations is derived from two sources: the COSMOS/UKST Southern Sky Catalog (SSC, Yentis et al., 1992), for astronomical coordinates, magnitudes and other photometric and shape parameters; and a catalog created from the digitization using the APM machine of band films obtained with 1.0m Schmidt telescope of ESO (see also Paper I). The catalog of spectroscopic candidates was limited to 20.2, where the completeness is about 85% (Caretta, Maia & Willmer, 2000). This magnitude limit is roughly the faintest that can be attained within reasonable integration times with 2 m class telescopes, and is faint enough that the luminosity function is probed to at 0.2. More than 90% of the galaxies in the SSC have counterparts in the catalog (20,687 galaxies), and we estimate that the final completeness of our photometric catalog is above 75% at = 20.2. The and magnitudes are both uncertain to 0.2 mag, while the SSC positions used in this work are accurate to better than 1 arcsec.
2.2 Target selection
Since our goal was to detect the presence of superclusters of galaxies in Aquarius, the observational strategy was designed to select preferentially targets with a greater likelihood of being members of clusters or groups belonging to the superclusters. This was done by identifying significant overdensities in the projected distribution of galaxies. In the later runs, once the -band data became available, an additional selection criterion was used, which took into account the proportion of red galaxies, under the assumption that most of these would be early-types. This means that our redshift catalog has not sampled the region uniformly and is biased towards red galaxies.
As described in Paper I, the galaxies were selected from a catalog of 102 potential clusters or groups of galaxies. For 68 of these, we selected galaxies located in square fields of centered on the surface density peaks within the Abell radius. These typically contained all galaxies in the clusters core, with additional objects that could be part of lower density regions of the supercluster.
A total of 94 square fields were observed, and in cases where previous measurements existed in the literature, our observations would supplement the existing redshifts so that at least 10 galaxies would be available to provide a robust velocity dispersion estimate. The average surface density of galaxies for the entire Aquarius region is 0.1 gal arcmin-2 to 20.2; the mean surface density of the fields selected for observations ranged from 0.13 to 0.58 gal arcmin-2. The galaxies selected for observations span from 16.0 to 21.0, usually among the 15 brightest galaxies in the field. Obvious foreground galaxies were excluded, so that typically 10 galaxies were observed per field, which implies in a sampling rate of 34%.
Whenever possible, the slit was rotated so that two or more galaxies were observed simultaneously. As a result of this strategy, there are 27 additional serendipitous galaxies fainter than 20.2 in our catalog.
2.3 Observational Procedure
We carried out 25 observing runs between 1994 and 2000, using three telescopes: the 1.52m of La Silla Observatory (ESO, Chile); the 1.60m of Observatório do Pico dos Dias (OPD/LNA, Brazil) and the 2.15m of Complejo Astronomico El Leoncito (CASLEO, Argentina). In both 1.52m and 1.60m telescopes we used Boller & Chivens spectrographs, while the 2.15m telescope had a REOSC spectrograph. All spectrographs were mounted at the Cassegrain focus. The log of the observing runs is shown in Table 1, which also presents the instrumental configuration. In Table 2 we present the details about the detector characteristics for the three used instrumental set ups.
For all observations, we covered the wavelength range ( 4000-7700 Å), using 300 l/mm diffraction gratings for 1k pixels CCDs and 600 l/mm gratings for the 2k detectors. This range was chosen in order to enclose most of the main absorption and emission optical lines for galaxies from = 0.0 to 0.2. It contains, in absorption, the Caii K and H lines, the G band, H, Mgi, Ca+Fe and Nai D band. The emission lines include [Oii], H, [Oiii] (at 4958.9 and 5006.8 Å), [Oi], [Nii] (6548.1 and 6583.6 Å), H and [Sii] (6716.4 and 6730.8 Å).
Integration times ranged from 20 to 120 min, depending on the magnitude and surface brightness of the objects. Longer exposures were divided in multiples of 20 min for an efficient removal of cosmic rays events. Line comparison lamps (He-Ar, He-Ar+Ne, He-Ar+Fe or Fe-Ar) were obtained immediately before or after each exposure. Sequences of bias, domeflats and dark exposures were obtained every night, and also some twilight sky flat-fields for each run. Observations were done typically in dark and grey time.
2.4 Data Reduction
The data reduction followed a standard procedure using iraf111The Image Reduction and Analysis Facility (IRAF) is distributed by the National Optical Astronomy Observatories.. This involved removal of bias; subtraction of dark current (only necessary in the first few observing runs); division by flat-field and, in a few rare cases, correcting for illumination using twilight flats; removal of cosmic rays; extraction of the 1-D spectrum; and sky-subtraction. In the process of wavelength calibration and linearization, we used arc lamp spectra extracted using the same apertures as the object frames. The wavelength solutions used seventh- or eighth-order legendre polynomials and the final fits typically used more than 40 lines with rms 0.4Å, 0.15Å and 0.09Å, respectively for CASLEO, OPD and ESO. In the cases of galaxies for which multiple exposures were taken, these were co-added after linearizing.
2.5 Redshift Determination
Redshifts were measured using the cross-correlation (Tonry & Davis, 1979) and emission lines analyses, both available in the rvsao package (Kurtz & Mink, 1998). In the cross-correlation we used a set of 15 high-signal to noise template spectra, most derived from spectra in the Southern Sky Redshift Survey (SSRS, da Costa et al., 1998) database. The position, height and width of the highest peak for each template was obtained by fitting a parabola. The significance value of this peak is estimated comparing its height relative to typical noise peaks, and is measured by the “R” parameter. In general, most of the templates give estimates within a velocity interval of about 200 km s-1, and for the final cross-correlation velocity we took the one with the highest signal “R” value.
Whenever emission-lines are present, they are fit by Gaussians, and a final emission velocity is obtained by weighting the redshift measured for each individual line by its error. Some spectra have both cross-correlation and emission-line redshifts. In these cases, for a difference between absorption and emission velocities less than 500 km/s, we considered a combined velocity (mean weighted by the respective errors). The average absorption-emission difference was +48 km s-1, with a rms of 170 km s-1, as shown in Figure 1.

The rvsao package also estimates internal uncertainties () for the redshift measurements. In the case of cross-correlation redshifts, these are related to the “R” parameter, while for emission-line redshifts, the error is estimated by a combination of the line centering error with the dispersion between the measurements of the different lines. For galaxies with both cross-correlation and emission-line redshifts the final internal errors are calculated in quadrature. The distribution, average and median values of these errors and of the “R” parameter are shown in Figures 2 and 3.
All spectra were visually inpected in order to validate the redshift and also to assign a redshift quality. The criteria for defining these quality flags are summarized below:
-
•
[A] excellent, absorption and/or emission lines are well defined and the “R” parameter (signal-to-noise ratio of the correlation peak) much greater than 3;
-
•
[B] good, absorption and/or emission lines confirmed by visual inspection or similar radial velocities for most of the templates but small “R” (between 2 and 4);
-
•
[C] marginal, “R” greater than 2, but with features either in absorption and/or emission too weak to be firmely confirmed;
-
•
[D] failed redshift, “R” 3 without any identifiable spectral feature.
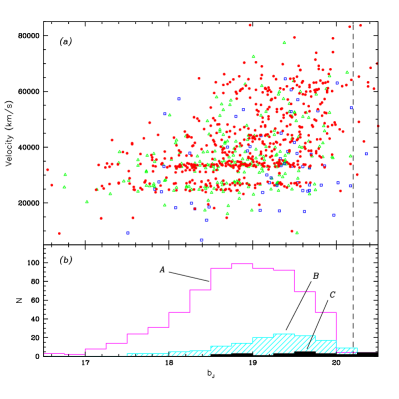
The fractions of spectra in each of these classes are 74%, 15%, 3% and 8%, respectively for A, B, C and D. In all subsequent analyses only galaxies with redshift qualities of “C” or better will be considered. Typical examples for each of these redshift qualities are shown in Figure 4, for spectra with only absorption-lines; Figure 5, for galaxies with emission lines only; and Figure 6, for galaxies with both emission and absorption. Figure 7a shows the c-magnitude diagram where solid circles represent galaxies with cross-correlation velocities only, open triangles galaxies with emission-line velocities only and open squares galaxies with both. The distribution of galaxy velocities in Aquarius clearly shows two concentrations, one at c 26,000 and another at c 33,500, corresponding to the superclusters described in Paper I. The bottom panel of Figure 7 shows the distribution of redshift quality as a function of magnitude. It is clear that as fainter magnitudes are being probed the number of quality “A” redfshifts (mainly due to cross-correlation) decreases dramatically.


2.6 Redshift Uncertainties
A first check of the reliability of the bulk of our data is done by separating it in sets coming from the three distinct telescopes: C215, O160 and E152 (see tables 1 and 2). Internal velocity errors for all the observed galaxies in each telescope are presented on Table 3, which reveals that ESO data are slightly better (smaller errors), since higher resolution gratings (600 l/mm) were used in this set up. CASLEO data, on the other hand, have slightly higher internal errors, probably due to the noisest CCD used.
Another internal evaluation of redshift uncertainties is done using the radial velocity standard galaxies, observed at least once in every observing night. These are listed on Table 4. Considering only the runs with more than 4 observations of such objects we could estimate the stability in the velocities measured from each telescope. For ESO we have six runs (with 6 to 12 observations each), that give a mean dispersion of 25 km s-1. For OPD we have also six runs (with 4 to 6 observations each) and 30 km s-1. For CASLEO we have only one object in one run, and 28 km s-1. This shows that all the three instrumental set ups produce similar internal dispersions, of about 25-30 km s-1, for the radial velocity standards. Since they are the best signal to noise data, their dispersion may be considered as a lower limit for our internal uncertainties.
We also used the standard galaxy measured velocities for external comparison, in order to estimate possible zero points between the instrumental set ups used. Column 6 of Table 4 lists the mean velocity differences between ESO and NED velocities, which give, on mean, +1538 km s-1 (for 6 galaxies). Similarly, column 11 show these differences between OPD and NED velocities (also for 6 galaxies), +4570 km s-1 on mean, and column 16 for CASLEO and NED (for only one galaxy), 31 km s-1. The same results are found using mean NED velocities (column 23). Nevertheless, it may be noted that NED velocities are not necessarly the best ones for comparison since they come from different sources ( is not systematic for a single instrumental set up).


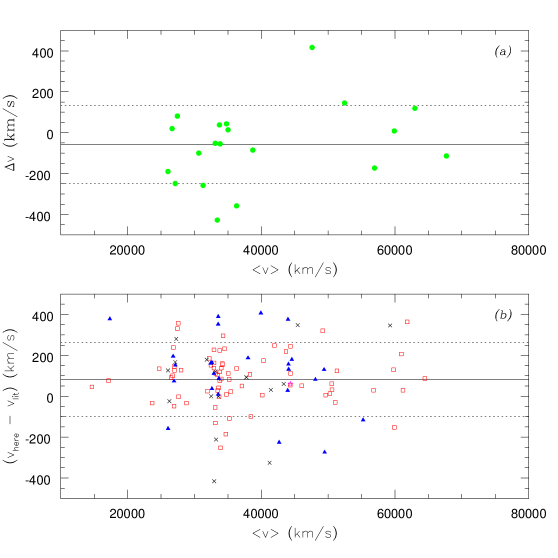
A further estimate of the redshift uncertainties can be made using galaxies that have more than one measurement carried out by ourselves, as well as comparing our measurements with those available in the literature. For a total of 20 galaxies we obtained spectra in different observing runs. From these measurements, shown in Figure 8a, we find a dispersion of 191 km s-1. Since the number of objects is very small, the dispersion may be overestimated. In Figure 8b we show the comparison for 118 galaxies of our database with redshifts also available on the literature. In this case, we find a zero-point shift of +81 km s-1 and standard deviation of 181 km s-1. Most of these galaxies were observed as part of the 2dFGRS (Colless et al., 2001), represented by the symbols other than crosses. When the 97 2dFGRS galaxies are considered the mean difference is +91156 km s-1. The best estimation of spread in 2dFGRS itself, as measured by the authors, comes from their comparison with Las Campanas Redshift Survey (LCRS, Shectman et al., 1996) data, with gives 109 km s-1. Considering equally distributed errors for the two sources, the 2dFGRS error may be about 77 km s-1. By subtracting quadratically this error to the above measured dispersion, this gives an estimation of the overall error of our data of 136 km s-1. If we now separate the data by instrumental set up (indicated by the different symbols in Figure 8), we find a mean difference of +93226 km s-1 for OPD data (26 galaxies) and +90123 km s-1 for ESO data (70 galaxies). For CASLEO the estimation is not possible due to the small number of objects. Thus, both OPD and ESO data have the same zero point related to 2dFGRS data, but the dispersion of OPD data is somewhat higher than ESO data one. Note that the number of galaxies in OPD data is about one third of ESO one, what may be effecting in the large dispersion measured. Since ESO data represent 63% of our overall sample, OPD 34%, and CASLEO only 3%, we can estimate the typical uncertainty in our measured radial velocities by the the weighted mean of ESO and OPD dispersions, 150 km s-1, which is consistent with all the results above.

3 The Aquarius Galaxy Catalog
A total of 920 new galaxy redshifts, with quality grades “C” or better, were measured in the direction of 72 cluster and group candidates, 68 of which within the bounds of the region considered in this work. In addition, we find 2851 redshifts in the literature for the same area of sky, most (2378) coming from the 2dFGRS, but which only contains galaxies located on the southern part of Aquarius region ().
Our new measurements are listed in Table 5, where we show, in column (1), a sequential number for galaxy identification; in columns (2) and (3), the equatorial coordinates (J2000.0); and bJ and R magnitudes in columns (4) and (5), respectively. When a galaxy is assigned to a group or cluster, column (6) gives the name of the cluster/group; whenever these are assigned to different systems along the same line of sight, suffixes A, B, C are appended to the group name; suffixes 1 and 2 are assigned to the clusters A2538 and A3985, which are only marginally separated in the redshift space. Columns (7) and (8) list the heliocentric velocity and velocity error of the galaxy. The codes on column (9) indicate the type of redshift (x = cross-correlation, e = emission lines, and c = combined cross-correlation and emission lines redshift), the quality grade and the value of the “R” parameter. The observing run, as listed on Table 1, during which the galaxy spectrum was taken, is shown on column (10).
4 Cluster Systemic Velocities and Velocity Dispersions
Combining the data from the Aquarius Galaxy Catalog with the 2851 redshifts from the literature we re-determine the redshifts and velocity dispersions for several of the clusters and groups within the surveyed region. Currently there are 81 candidates of the Aquarius Cluster Catalog with redshifts for galaxies inside their estimated Abell radius, 9 more than published in Paper I. As described in Paper I, about half of the observed candidates show more than one significant peak along the line of sight to the depth of our survey. About 120 peaks were found, ranging from rich clusters to small groups. Here we present radial velocities and velocity dispersions for the systems with at least six measured velocities.
The member galaxies were selected inside a projected circle of 1.5 Mpc radius (H0 = 75 km s-1 Mpc-1 hereafter) of the system center. For most of the systems, the center is defined as being coincident with the position of the brightest cluster galaxies (BCG: a cD galaxy, a giant elliptical or a central group of early-type galaxies), since these massive objects tend to be preferentially located close to the bottom of the potential well, as an effect of dynamical friction (Bird, 1994). For systems without apparent dominant galaxies, the mean position of the members was used. Comparing the centers derived from the BCGs with those measured from the overall distribution of galaxies, and with centers measured from X-rays we find that the uncertainty of the centers is estimated to be 0.1 Mpc. This comparison was done for 12 clusters, namely A2521, A2534, A2536, A2540, A2550, A2554, A2555, A2556, A2566, A2577, A2580 and A2606.
In the cases of galaxies with more than one measurement, these were averaged, unless the redshift quality was poor, in which case only the best measurement was used. The redshift extent of the individual groups and clusters was defined using the gaps method (e.g., Zabludoff, Huchra & Geller, 1990; Katgert et al., 1996), initially selecting galaxies whose separation from their neighboring members was less than 1500 km s-1. This value was chosen based on the characteristic projected density of the sample. Smaller gaps, weighted by their location with respect to the middle of the cluster velocities distribution, were calculated during a second step of robust estimation of parameters and used iteratively to exclude remaining interlopers.
The final systemic velocity and velocity dispersion were calculated through robust estimation of the biweighted center and scale (Beers, Flynn & Gebhardt, 1990). The results for 74 Aquarius clusters are presented in Table 6. Column (1) lists the AqrCC number of the observed candidate, while column (2) shows another identification. Equatorial coordinates of system center are shown in columns (3) and (4). Column (5) indicates if the chosen projected center was the BCG(s) position or the geometric mean of members positions. The number of galaxies identified as members from the Aquarius Galaxy Catalog is shown in column (6), while the number of such redshifts from the literature is in column (7). Column (8) gives the reference for literature redshifts. The total number of member galaxies whose velocities were used to calculate the systemic velocity is in column (9). Note that, since there are repeated observations from both this work and from the literature, the total number of members with redshifts can be smaller than the sum of the numbers from the two sources. Columns (10) and (11) show, respectively, the system velocity and velocity dispersion, both with 68% bootstrap confidence level uncertainty limits.
Comparing the current data with the one on Paper I, for 25 cluster the estimates remained unchanged, other 30 had their systemic velocities upgraded due to inclusion of 2dFGRS velocities or more robust calculations, and 3 new ones were added. Major differences are presented by A2538 and A3985 that were splitted in redshift space and APM895 and APM894 which are now considered a single system. Another improvement was the estimation of velocity dispersions for the clusters. Concerning to the work of Smith et al. (2004), they have 12 clusters in common with Table 6 ones, most of which with a larger number of galaxies observed by they. From these, 11 have similar redshifts to the ones here. The only one with a slightly discrepant value is A2540, for which we have measured galaxies only in the core of the cluster, and their value may be more representative. Comparing the velocity dispersions of the two sources one finds that 11 of the 12 clusters in common have higher values in their estimation. This may also be due to the sampling of larger areas and to a less restrictive criteria for defining cluster members they used. So, two effects may be playing role on this difference: our data underestimate whole system velocity dispersions and/or their data may be overestimated by residual interlopers. The cluster A2554, on the other hand, has higher velocity dispersion in our data by 188 km s-1. Since Smith et al. (2004) used almost two times the number of member galaxies we used, and a larger area, this could indicate that this cluster has a declining velocity dispersion profile on the outskirts (not common but possible). The velocity dispersion profile of A2554 has been calculated by Fadda et al. (1996), and do not show evidence of a declining profile. The overall velocity dispersion calculated by these authors is similar to our value (840 km s-1, for 28 member galaxies).
Finally, one should note that two clusters in our sample, A2540 and A2547, have estimated velocity dispersions much smaller than their uncertainty limits. For such clusters all the observed member galaxies (9 and 15, respectively) have close radial velocities, which low probability of happen gave the high estimated uncertainty limits. Such velocity dispersion must be used with care. If we consider the velocity dispersion differences (excluding A2540 and A2554) between our and Smith et al. (2004) data, we find a mean difference of 215 km s-1, that may be considered as the maximum underestimation for the whole cluster velocity dispersions of our measurements restricted to a few more than the cluster cores.
5 Summary
We presented photometry and spectroscopic redshifts for a sample of 920 galaxies in the Aquarius region, most of which selected as candidate members of potential groups and clusters in the region.
We described the target selection and observational procedures as well the redshifts estimation and error analysis. The results are presented in two separated tables, one is the Aquarius Galaxy (radial velocity and photometric) Catalog and the other is the cluster systemic velocity and velocity dispersion list.
The strategy of priorizing red galaxies was successful since 85% of the observed galaxies provided a cross-correlation redshift (92% of the final catalog), and 71% of the galaxies were confirmed as cluster or group members.
The two main superclusters in the region, at 0.086 and 0.112, are clearly seen in the distribution of galaxy redshifts.
From the 81 candidates of AqrCC with observations up to date, we selected 58, that present clusters with at least six members with redshifts (a total of 74 clusters due to superposition along the line of sight), to have their systemic velocities and velocity dispersions calculated. The other 23 observed candidates are 14 with less than six members with redshifts (but indicated by their member galaxies in the Aquarius Galaxy Catalog), 4 that were observed but not confirmed as clusters or groups, and 5 that appear in Smith et al. (2004).
The systemic velocities presented here are updates to the cluster catalog of Paper I, with the addition of cluster velocity dispersions, but essentially the conclusions reached in that paper remain unchanged.
References
- Alonso et al. (1999) Alonso, M.V., Valotto, C., Lambas, D.G., & Muriel, H. 1999. MNRAS, 308, 618
- Alonso et al. (2003) Alonso, M.V., Bernardi, M., da Costa, L.N., Wegner, G., Willmer, C.N.A., Pellegrini, P.S. & Maia, M.A.G. 2003. AJ, 125, 2307
- Barmby & Huchra (1998) Barmby, P., & Huchra, J.P. 1998. AJ, 115, 6
- Batuski et al. (1995) Batuski, D.J., Maurogordato, S., Balkowski, C., & Olowin, R.P. 1995. A&A, 294, 677
- Batuski et al. (1999) Batuski, D.J., Miller, C.J., Slinglend, K.A., Balkowski, C., Maurogordato, S., Cayatte, V., Felenbock, P., & Olowin, R. 1999. ApJ, 520, 491
- Beers, Flynn & Gebhardt (1990) Beers, T.C., Flynn, K., & Gebhardt, K. 1990. AJ, 100, 32
- Bird (1994) Bird, C.M. 1994. AJ, 107, 1637
- Caretta, Maia & Willmer (2000) Caretta, C.A., Maia, M.A.G., & Willmer, C.N.A. 2000. AJ, 119, 524
- Caretta et al. (2002) Caretta, C.A., Maia, M.A.G., Kawasaki, W., & Willmer, C.N.A. 2002. AJ, 123, 1200 (Paper I)
- Ciardullo, Ford & Harms (1985) Ciardullo, R., Ford, H., & Harms, R. 1985. ApJ, 293, 69
- Colless & Hewett (1987) Colless, M., & Hewett, P. 1987. MNRAS, 224, 453
- Colless et al. (2001) Colless, M., et al. (The Two Degree Field Galaxy Redshift Survey Team) 2001. MNRAS, 328, 1039
- Collins et al. (1995) Collins, C.A., Guzzo, L., Nichol, R.C., & Lumsden, S.L. 1995. MNRAS, 274, 1071
- da Costa et al. (1986) da Costa, L.N., Pellegrini, P. S., Willmer, C.N.A., Nunes, M. A., Chincarini, G., & Cowan, J. J. 1986. AJ, 91, 6
- da Costa et al. (1987) da Costa, L.N., Willmer, C.N.A., Pellegrini, P.S., & Chincarini, G. 1987. AJ, 93, 1338
- da Costa et al. (1998) da Costa, L.N., Willmer, C.N.A., Pellegrini, P.S.S., Chaves, O.L., Rité, C., Maia, M.A.G., Geller, M.J., Latham, D.W., Kurtz, M.J., Huchra, J.P., Ramella, M., Fairall, A.P., Smith, C., & Lípari, S. 1998. AJ, 116, 1
- Dalton et al. (1994) Dalton, G.B., Efstathiou, G., Maddox, S.J., & Sutherland, W.J. 1994. MNRAS, 269, 151
- Fadda et al. (1996) Fadda, D., Girardi, M., Giuricin, G., Mardirossian, F, & Mezzetti, M. 1996. ApJ, 473, 670
- Gregory & Thompson (1978) Gregory, S.A., & Thompson, L.A. 1978. ApJ, 222, 784
- Kaldare et al. (2003) Kaldare, R., Colless, M., Raychaudhury, S. & Peterson, B.A. 2003. MNRAS, 339, 652
- Kapahi et al. (1998) Kapahi, V.K., Athreya, R.M., Breugel, W.V., McCarthy, P.J., & Subrahmanya, C.R. 1998. ApJS, 118, 275
- Katgert et al. (1996) Katgert, P., Mazure, A., Perea, J., den Hartog, R., Moles, M., Le Fèvre, O., Dubath, P., Focardi, P., Rhee, G., Jones, B., Escalera, E., Biviano, A., Gerbal, D., & Giuricin, G. 1996. A&A, 310, 8
- Kowalski, Ulmer & Cruddace (1983) Kowalski, M.P., Ulmer, M.P., & Cruddace, R.G. 1983. ApJ, 268, 540
- Kurtz & Mink (1998) Kurtz, M.J., & Mink, D.J. 1998. PASP, 110, 934
- Longhetti et al. (1998) Longhetti, M., Rampazzo, R., Bressan, A., & Chiosi, C. 1998. A&AS, 130, 267
- Loveday (1996) Loveday, J. 1996. MNRAS, 278, 1025
- Owen, Ledlow & Keel (1995) Owen, F.N., Ledlow, M.J., & Keel, W.C. 1995. AJ, 109, 14
- Postman, Geller & Huchra (1988) Postman, M., Geller, M.J., & Huchra, J.P. 1988. AJ, 95, 267
- Quintana & Ramírez (1995) Quintana, H. & Ramírez, A. 1995. ApJS, 96, 343
- Quintana, Carrasco & Reisenegger (2000) Quintana, H., Carrasco, E.R., & Reisenegger, A. 2000. AJ, 120, 511
- Ramella, Focardi & Geller (1996) Ramella, M., Focardi, P., & Geller, M.J. 1996. A&A, 312, 745
- Ratcliffe et al. (1998) Ratcliffe, A., Shanks, T., Parker, Q.A., Broadbent, A., Watson, F.G., Oates, A.P., Collins, C.A., & Fong, R. 1998. MNRAS, 300, 417
- Shectman et al. (1996) Shectman, S.A., Landy, S.D., Oemler, A., Tucker, D.L., Lin, H., Kirshner, R.P., & Schechter, P.L. 1996. ApJ, 470, 172
- Schneider, Gunn & Hoessel (1983) Schneider, D.P., Gunn, J.E., & Hoessel, J.G. 1983. ApJ, 264, 337
- Smith et al. (2004) Smith, R.E., Dahle, H., Maddox, S.J., Lilje, P.B. 2004, preprint (astro-ph/0401641)
- Strauss et al. (2002) Strauss, M.A., et al. (The Sloan Digital Sky Survey Team) 2002. AJ, 124, 1810
- Tonry & Davis (1979) Tonry, J., & Davis, M. 1979. AJ, 84, 1511
- Valentijn & Casertano (1988) Valentijn, E.A., & Casertano, S. 1988. A&A, 206, 27
- Wegner, Haynes & Giovanelli (1993) Wegner, G., Haynes, M.P., & Giovanelli, R. 1993. AJ, 105, 1251
- Yentis et al. (1992) Yentis, D. J., Cruddace, R. G., Gursky, H., Stuart, B. V., Wallin, J. F., MacGillivray, H. T., & Collins, C. A. 1992. In Digitised Optical Sky Surveys, eds. H. T. MacGillivray & E. B. Thomson (Kluwer: Dordrecht), p. 67
- Zabludoff, Huchra & Geller (1990) Zabludoff, A.I., Huchra, J.P., & Geller, M.J. 1990. ApJS, 74, 1
| Run | Telescope∗∗ Instrumental set up: C215 = CASLEO 2.15m + REOSC; O160 = OPD 1.60m + B&C; and E152 = ESO 1.52m + B&C | Date | Grating | Slit | Detector†† Details on table 2 | Disp. | Resol. | Range | Targets‡‡ Number of pointed “targets” and final number of observed “objects” with successful redshift measurement (due to multiobjects on the slit). | Objects‡‡ Number of pointed “targets” and final number of observed “objects” with successful redshift measurement (due to multiobjects on the slit). |
|---|---|---|---|---|---|---|---|---|---|---|
| (l/mm) | (m) | # | (Å/pix) | (Å) | ||||||
| (1) | (2) | (3) | (4) | (5) | (6) | (7) | (8) | (9) | (10) | (11) |
| 1 | C215 | sep94 | 316 | 500 | Tek | 3.2 | 18 | 4760-7980 | 9 | 9 |
| 2 | O160 | oct94 | 300 | 600 | 048 | 4.1 | 14 | 4200-8260 | 9 | 11 |
| 3 | O160 | aug95 | 300 | 450 | 048 | 4.1 | 12 | 4360-8420 | 35 | 39 |
| 4 | O160 | aug96 | 600/300 | 500/400 | 101 | 4.3 | 11 | 3560-8120 | 18 | 19 |
| 5 | C215 | sep96 | 300 | 400 | Tek | 3.2 | 16 | 4200-7660 | 35 | 38 |
| 6 | E152 | nov96 | 600 | 419 | 039 | 1.9 | 4 | 3972-7838 | 37 | 42 |
| 7 | E152 | jun97 | 600 | 419 | 039 | 1.9 | 4 | 3800-7700 | 15 | 16 |
| 8 | O160 | aug97 | 300 | 400 | 101 | 4.3 | 11 | 3650-8050 | 13 | 14 |
| 9 | E152 | aug97 | 600 | 419 | 039 | 1.9 | 4 | 3600-7500 | 53 | 117 |
| 10 | O160 | oct97 | 300 | 400 | 101 | 4.3 | 11 | 3700-8100 | 17 | 25 |
| 11 | E152 | oct97 | 600 | 400 | 039 | 1.9 | 4 | 3639-7537 | 12 | 29 |
| 12 | E152 | jun98 | 600 | 400 | 039 | 1.9 | 4 | 3634-7518 | 2 | 6 |
| 13 | E152 | aug98 | 600 | 400 | 039 | 1.9 | 4 | 3640-7520 | 52 | 121 |
| 14 | O160 | aug98 | 300 | 400 | 106 | 4.3 | 11 | 3700-8100 | 23 | 36 |
| 15 | E152 | oct98 | 600 | 400 | 039 | 1.9 | 4 | 3515-7514 | 4 | 9 |
| 16 | O160 | aug99 | 300 | 350 | 106 | 4.3 | 10 | 3700-8100 | 19 | 36 |
| 17 | E152 | aug99 | 600 | 400 | 039 | 1.9 | 4 | 3680-7560 | 2 | 5 |
| 18 | O160 | sep99 | 300 | 350 | 106 | 4.3 | 10 | 3750-8150 | 28 | 46 |
| 19 | E152 | oct99 | 600 | 400/350 | 038 | 1.9 | 4 | 3300-8650 | 16 | 33 |
| 20 | E152 | dec99 | 600 | 400 | 038 | 1.9 | 4 | 3400-8500 | 36 | 80 |
| 21 | O160 | aug00 | 300 | 250 | 106 | 4.3 | 8 | 3700-8100 | 36 | 67 |
| 22 | E152 | sep00 | 600 | 400 | 038 | 1.9 | 4 | 3370-8492 | 34 | 68 |
| 23 | O160 | sep00 | 300 | 250 | 106 | 4.3 | 8 | 3700-8100 | 9 | 19 |
| 24 | O160 | oct00 | 300 | 250 | 106 | 4.3 | 8 | 3700-8100 | 6 | 15 |
| 25 | E152 | nov00 | 600 | 250 | 038 | 1.9 | 3 | 3350-8450 | 43 | 93 |
| CCD | Origin | Dimensions | Pixel | Gain | Noise | Scale | Efficiency | Telescope |
|---|---|---|---|---|---|---|---|---|
| Nr. | (pixels) | (m) | (ADU) | ( rms) | (4000-8000) | |||
| (1) | (2) | (3) | (4) | (5) | (6) | (7) | (8) | (9) |
| Tek | 10241024 | 24 | 2.0 | 7.4 | 3.96”/100m | 95-70% | C215 | |
| #48 | EEV | 7701152 | 22.5 | 3.3 | 6.6 | 1.04”/100m | 15-45% | O160 |
| #101 | SITe | 10241024 | 24 | 5.0 | 5.5 | 1.04”/100m | 40-65% | O160 |
| #106 | SITe | 10241024 | 24 | 5.0 | 4.1 | 1.25”/100m | 55-75% | O160 |
| #39 | Loral | 20482048 | 15 | 1.2 | 5.0 | 0.82”/100m | 75-95% | E152 |
| #38 | Loral | 2688512 | 15 | 1.6 | 7.1 | 0.82”/100m | 75-90% | E152 |
| Telescope | N | [] | ||
|---|---|---|---|---|
| E152 | 581 | 58 | 44 | 48 |
| O160 | 310 | 66 | 39 | 57 |
| C215 | 29 | 87 | 52 | 75 |
| all data | 920 | 62 | 43 | 51 |
| Galaxy | This work | NED | ||||||||||||||||||||||||||||
|---|---|---|---|---|---|---|---|---|---|---|---|---|---|---|---|---|---|---|---|---|---|---|---|---|---|---|---|---|---|---|
| E152 | O160 | C215 | all data | Small Error †† Velocity on NED with the smallest error. | all data | |||||||||||||||||||||||||
| Nr | No | Nr | No | Nr | No | No | Ref.§§ Reference to the smallest error NED velocity: (1) Third Reference Catalogue of Bright Galaxies (RC3), 1991 (version 3.9); (2) Longhetti et al. (1998); (3) Ramella, Focardi & Geller (1996); (4) Kaldare et al. (2003): (5) Alonso et al. (2003). | Nv | ||||||||||||||||||||||
| (1) | (2) | (3) | (4) | (5) | (6) | (7) | (8) | (9) | (10) | (11) | (12) | (13) | (14) | (15) | (16) | (17) | (18) | (19) | (20) | (21) | (22) | (23) | (24) | (25) | ||||||
| NGC 7507 | 1594 | 20 | 3 | 12 | +28 | 1616 | 43 | 1 | 3 | +50 | … | … | … | … | … | 1605 | 25 | 15 | +39 | 156615 | 1 | 1577 | 29 | 10 | ||||||
| NGC 1316 | 1752 | 21 | 2 | 18 | 8 | … | … | … | … | … | … | … | … | … | … | 1760 | 11 | 18 | +0 | 176010 | 2 | 1795 | 54 | 14 | ||||||
| NGC 6958 | 2738 | 29 | 7 | 18 | +25 | … | … | … | … | … | … | … | … | … | … | 2735 | 30 | 18 | +22 | 271313 | 1 | 2687 | 53 | 7 | ||||||
| NGC 6868 | 2926 | 12 | 4 | 10 | +72 | 2913 | 12 | 1 | 7 | +59 | … | … | … | … | … | 2917 | 43 | 17 | +63 | 285415 | 3 | 2843 | 47 | 8 | ||||||
| NGC 5419 | … | … | … | … | … | 4196 | 62 | 3 | 12 | +70 | … | … | … | … | … | 4173 | 57 | 12 | +47 | 412615 | 4 | 4136 | 77 | 7 | ||||||
| NGC 6721 | 4435 | 13 | 2 | 11 | +14 | 4486 | 44 | 7 | 43 | +65 | 4390 | 28 | 1 | 7 | -31 | 4455 | 59 | 61 | +34 | 442125 | 1 | 4421 | 47 | 5 | ||||||
| NGC 6841 | 5845 | 23 | 3 | 6 | 41 | 5798 | 9 | 1 | 4 | 88 | … | … | … | … | … | 5828 | 30 | 10 | 58 | 5886 | 5 | … | … | 1 | ||||||
| NGC 0641 | … | … | … | … | … | 6437 | 28 | 4 | 9 | +114 | … | … | … | … | … | 6438 | 29 | 9 | +115 | 632317 | 1 | 6328 | 59 | 7 | ||||||
| Averages | +15 | +45 | -31 | +33 | ||||||||||||||||||||||||||
| Gal | Coordinates (J2000.0) | Cluster | c | Error | Code∗∗ Codes are for: type of spectrum (x = cross-correlation, e = emission lines, c = combined absorption and emission lines); quality flag (A,B or C); and “R” parameter. | Run†† Refers to Table 1. | |||
|---|---|---|---|---|---|---|---|---|---|
| Nr. | mag. | mag. | name | () | () | ||||
| (1) | (2) | (3) | (4) | (5) | (6) | (7) | (8) | (9) | (10) |
| 1 | 22h57m53.61s | -214657.6 | 18.44 | A2509B | 23915 | 55 | x,A, 6.21 | 21 | |
| 2 | 22 57 56.77 | -21 50 01.9 | 18.09 | A2509B | 25503 | 56 | c,A, 2.89 | 21 | |
| 3 | 22 57 57.54 | -21 46 37.9 | 19.12 | A2509B | 23762 | 70 | e,A, 0.00 | 21 | |
| 4 | 22 58 02.21 | -21 53 58.2 | 18.65 | A2509B | 24007 | 71 | c,A, 4.00 | 12 | |
| 5 | 22 58 02.58 | -21 53 51.1 | 18.62 | A2509C | 40169 | 19 | x,A,14.59 | 12 | |
| 6 | 22 58 02.96 | -21 54 01.4 | 19.62 | A2509C | 40132 | 26 | x,A,10.44 | 12 | |
| 7 | 22 58 03.09 | -21 53 45.1 | 19.80 | A2509C | 40253 | 56 | c,B, 4.18 | 12 | |
| 8 | 22 58 05.22 | -21 54 29.5 | 19.55 | A2509A | 69163 | 34 | x,A, 8.00 | 12 | |
| 9 | 22 58 06.56 | -21 54 45.6 | 19.36 | A2509A | 69774 | 31 | x,A,10.78 | 12 | |
| 10 | 22 58 07.41 | -21 48 34.1 | 18.51 | A2509B | 23640 | 129 | c,B, 2.39 | 21 | |
| 11 | 22 58 08.06 | -21 55 02.7 | 63541 | 77 | e,B, 2.46 | 12 | |||
| 12 | 22 58 15.34 | -21 56 19.6 | A2509B | 23787 | 63 | c,A, 3.31 | 21 | ||
| 13 | 22 58 16.57 | -23 33 44.9 | 18.48 | Aqr005 | 35160 | 34 | x,A, 9.72 | 22 | |
| 14 | 22 58 20.84 | -23 33 38.5 | 19.24 | Aqr005 | 35449 | 38 | x,A, 8.57 | 22 | |
| 15 | 22 58 21.16 | -23 36 47.6 | 17.83 | Aqr005 | 34775 | 39 | c,A, 7.00 | 22 | |
| 16 | 22 58 21.34 | -21 52 48.8 | 19.81 | 55460 | 63 | x,A, 4.23 | 21 | ||
| 17 | 22 58 26.71 | -23 37 57.4 | 18.82 | Aqr005 | 34847 | 44 | x,A, 7.65 | 22 | |
| 18 | 22 58 27.06 | -21 54 18.2 | 18.85 | A2509C | 40372 | 57 | c,A, 3.98 | 21 | |
| 19 | 22 58 30.50 | -23 39 09.4 | 18.03 | Aqr005 | 35541 | 43 | c,A, 6.47 | 22 | |
| 20 | 22 58 30.62 | -23 42 33.2 | 18.72 | Aqr005 | 35100 | 33 | x,A,11.31 | 22 | |
Note. — The complete version of this table is in the electronic edition of the journal. The printed edition contains only a sample.
| AqrCC | Other | Coordinates (J2000.0) | Observed Galaxies | ||||||||
|---|---|---|---|---|---|---|---|---|---|---|---|
| Name | Center∗∗ Type of projected center: (B#) position of the brightest cluster galaxy (# is the number of giant ellipticals considered as BCGs of the cluster, ? means BCG is not surely defined); (G) geometric mean of the positions of galaxies confirmed as cluster members. | Ref.†† References of the galaxy velocities from the literature: (1) Kowalski, Ulmer & Cruddace (1983); (2) Schneider, Gunn & Hoessel (1983); (3) Ciardullo, Ford & Harms (1985); (4) Colless & Hewett (1987); (5) Valentijn & Casertano (1988); (6) Dalton et al. (1994); (7) Batuski et al. (1995); (8) Collins et al. (1995); (9) Owen, Ledlow & Keel (1995); (10) Quintana & Ramírez (1995); (11) Loveday (1996); (12) Kapahi et al. (1998); (13) Ratcliffe et al. (1998); (14) Alonso et al. (1999); (15) Batuski et al. (1999); (16) Colless et al. (2001). | (km s-1) | (km s-1) | |||||||
| (1) | (2) | (3) | (4) | (5) | (6) | (7) | (8) | (9) | (10) | (11) | |
| 001 | Aqr001-A | 22h57m14.6s | -24∘58′20 | G | … | 7 | 13,16 | 7 | 26542 | 184 | |
| 001 | Aqr001-B | 22 58 16.7 | -25 00 56 | G | … | 12 | 16 | 12 | 27348 | 114 | |
| 005 | Aqr005 | 22 58 32.0 | -23 37 37 | B? | 11 | 7 | 16 | 15 | 35406 | 393 | |
| 004 | A3949 | 22 58 52.1 | -19 57 17 | G | 7 | … | … | 7 | 47358 | 207 | |
| 009 | A2518-D | 23 00 31.9 | -24 19 41 | G | … | 6 | 16 | 6 | 35143 | 383 | |
| 009 | A2518-C | 23 00 44.7 | -24 06 22 | G | … | 7 | 16 | 7 | 32953 | 57 | |
| 009 | A2518 | 23 00 47.0 | -24 09 02 | B2 | 6 | 15 | 3,16 | 17 | 40471 | 547 | |
| 009 | A2518-B | 23 00 57.8 | -24 12 08 | G | 4 | 5 | 16 | 7 | 27595 | 199 | |
| 010 | A2521 | 23 02 11.4 | -22 01 24 | B2 | 14 | 5 | 2,3,5 | 17 | 40883 | 248 | |
| 012 | A2526 | 23 04 34.9 | -24 04 11 | B2 | 6 | 4 | 16 | 8 | 60985 | 376 | |
| 014 | A2527 | 23 05 20.6 | -25 20 19 | B2 | 8 | 4 | 16 | 10 | 48691 | 648 | |
| 015 | A2528 | 23 05 36.0 | -21 23 03 | B | 11 | 1 | 3 | 12 | 28475 | 458 | |
| 016 | A2531 | 23 06 56.0 | -21 39 47 | B | 6 | 1 | 3 | 7 | 51873 | 560 | |
| 017 | A2534 | 23 07 41.5 | -22 42 39 | B | 15 | 1 | 3 | 16 | 60348 | 126 | |
| 019 | Aqr019-C | 23 07 42.4 | -25 27 12 | G | … | 8 | 16 | 8 | 34635 | 571 | |
| 018 | A2536 | 23 07 46.7 | -22 27 31 | B | 7 | 1 | 3 | 6 | 59811 | 981 | |
| 018 | A2536-B | 23 07 49.9 | -22 29 09 | G | 9 | … | … | 8 | 52575 | 353 | |
| 019 | Aqr019-A | 23 08 03.1 | -25 41 01 | G | … | 9 | 16 | 9 | 30860 | 313 | |
| 020 | A2538-2 | 23 08 28.5 | -19 51 20 | G | … | 23 | 3,4,9 | 23 | 25512 | 374 | |
| 020 | A2538-1 | 23 08 34.1 | -19 52 34 | B2 | … | 21 | 4,9 | 21 | 24099 | 465 | |
| 019 | Aqr019-B | 23 08 42.3 | -25 30 47 | G | … | 6 | 16 | 6 | 33017 | 274 | |
| 022 | Aqr022 | 23 09 03.6 | -20 45 15 | G | 5 | 1 | 15 | 6 | 24739 | 152 | |
| 023 | A2540 | 23 09 25.1 | -22 10 19 | B | 8 | 1 | 3 | 9 | 38875 | 38 | |
| 024 | Aqr024 | 23 09 54.5 | -21 31 30 | B | 7 | … | … | 7 | 33250 | 600 | |
| 026 | A2542 | 23 10 06.2 | -24 29 09 | B2 | 4 | 6 | 16 | 6 | 50560 | 454 | |
| 027 | Aqr027-C | 23 10 06.9 | -24 44 19 | G | 1 | 6 | 16 | 6 | 36060 | 715 | |
| 025 | A2541 | 23 10 07.2 | -22 59 05 | B2 | 17 | 2 | 8 | 17 | 34032 | 991 | |
| 027 | Aqr027-B | 23 10 13.1 | -24 46 35 | G | 2 | 9 | 16 | 10 | 32625 | 785 | |
| 028 | A2546 | 23 10 38.7 | -22 38 54 | B2 | 22 | 1 | 3 | 22 | 33903 | 784 | |
| 027 | Aqr027 | 23 10 39.9 | -24 45 13 | B2 | 5 | 3 | 16 | 6 | 59786 | 465 | |
| 029 | A2547 | 23 10 46.7 | -21 08 07 | B2 | 12 | 5 | 3,12,15 | 15 | 45483 | 80 | |
| 031 | A2548 | 23 11 15.8 | -20 25 05 | B | 6 | 4 | 3,15 | 9 | 33105 | 180 | |
| 033 | A2550 | 23 11 35.8 | -21 44 47 | B | 5 | 2 | 3,15 | 6 | 36752 | 517 | |
| 035 | A2554 | 23 12 19.9 | -21 30 10 | B | 4 | 31 | 3,4,15 | 32 | 33243 | 868 | |
| 036 | A2553 | 23 12 24.8 | -24 57 12 | B2 | … | 13 | 10,16 | 13 | 44081 | 686 | |
| 037 | A2555 | 23 12 51.3 | -22 15 27 | B? | 9 | 2 | 15 | 11 | 33236 | 238 | |
| 038 | A2556 | 23 13 01.5 | -21 38 04 | B | 5 | 8 | 1,3,4,15 | 10 | 26109 | 352 | |
| 039 | S1099 | 23 13 10.9 | -23 09 29 | B2 | 12 | … | … | 12 | 33258 | 732 | |
| 040 | Aqr040 | 23 14 30.8 | -23 22 24 | B2 | 6 | 1 | 16 | 7 | 27274 | 122 | |
| 041 | A2565-A | 23 15 52.0 | -21 08 30 | G | 12 | … | … | 12 | 24727 | 359 | |
| 041 | A2565-B | 23 15 54.9 | -21 08 18 | G | 10 | 1 | 3 | 10 | 38365 | 325 | |
| 044 | A2566 | 23 16 05.0 | -20 27 48 | B | 10 | 2 | 3,9 | 11 | 24642 | 856 | |
| 042 | A3985-2 | 23 16 12.1 | -23 22 55 | G | 8 | 2 | 16 | 10 | 33940 | 181 | |
| 042 | A3985-1 | 23 16 15.1 | -23 23 36 | B | 10 | 5 | 16 | 12 | 31855 | 482 | |
| 045 | Aqr045-A | 23 16 20.9 | -25 00 29 | G | … | 9 | 16 | 9 | 15436 | 329 | |
| 045 | Aqr045-B | 23 16 32.1 | -24 57 14 | G | … | 7 | 16 | 7 | 33000 | 513 | |
| 046 | A2568 | 23 17 11.8 | -22 14 23 | B? | 5 | 1 | 3 | 6 | 41875 | 327 | |
| 047 | ED275 | 23 17 33.7 | -25 20 30 | B2 | 6 | 9 | 16 | 12 | 43329 | 670 | |
| 051 | A2576 | 23 19 43.9 | -22 27 52 | B? | … | 10 | 7 | 10 | 56253 | 750 | |
| 052 | S1113 | 23 20 01.8 | -24 08 46 | B? | 9 | 10 | 16 | 14 | 44005 | 367 | |
| 055 | A2577 | 23 20 46.7 | -22 59 30 | B | 6 | 1 | 10 | 7 | 37363 | 176 | |
| 057 | A2579 | 23 21 15.6 | -21 35 04 | B | 4 | 6 | 10,15 | 10 | 33409 | 394 | |
| 061 | A2580 | 23 21 26.3 | -23 12 26 | B | 19 | … | … | 17 | 26687 | 661 | |
| 059 | A3997 | 23 21 33.7 | -24 08 52 | B3 | 8 | 5 | 16 | 11 | 44280 | 391 | |
| 063 | A2583 | 23 22 14.7 | -20 26 08 | B? | 8 | … | … | 8 | 34388 | 659 | |
| 065 | A2586 | 23 23 24.3 | -20 22 35 | B | 11 | … | … | 11 | 43420 | 828 | |
| 066 | A2587 | 23 23 32.4 | -22 25 21 | B | 6 | … | … | 6 | 64750 | 673 | |
| 067 | ED291 | 23 24 13.2 | -22 31 12 | G | 15 | 1 | 15 | 15 | 36690 | 378 | |
| 070 | A2596 | 23 25 05.6 | -23 23 49 | B2 | 21 | 10 | 13,15,16 | 27 | 26719 | 496 | |
| 069 | A2595 | 23 25 06.2 | -20 32 37 | B? | 5 | … | … | 5 | 54091 | 545 | |
| 073 | APM895/894 | 23 26 14.1 | -24 06 30 | B | 16 | 36 | 11,14,15,16 | 35 | 33463 | 549 | |
| 075 | A2600 | 23 26 31.9 | -22 25 47 | G | 6 | 3 | 15 | 9 | 36268 | 570 | |
| 074 | A2599-B | 23 26 38.1 | -23 46 04 | B | 9 | 9 | 14,15,16 | 13 | 37841 | 585 | |
| 074 | A2599-A | 23 26 54.5 | -23 51 46 | G | 9 | 26 | 6,8,14,15,16 | 22 | 26943 | 456 | |
| 076 | A2601 | 23 27 01.8 | -24 30 04 | G | 4 | 4 | 15,16 | 7 | 63552 | 635 | |
| 075 | A2600-B | 23 27 11.2 | -22 18 55 | G | 2 | 7 | 15 | 9 | 18305 | 363 | |
| 078 | ED300-B | 23 27 45.4 | -25 05 42 | G | 1 | 11 | 16 | 11 | 26436 | 449 | |
| 077 | A2603 | 23 27 56.8 | -25 22 37 | B | 7 | 3 | … | 6 | 63218 | 396 | |
| 078 | ED300 | 23 28 16.2 | -24 56 43 | B | 12 | 12 | 16 | 18 | 33480 | 585 | |
| 081 | A2605-A | 23 28 48.9 | -23 22 22 | B2 | 11 | 1 | 15 | 10 | 33589 | 545 | |
| 081 | A2605-B | 23 29 05.9 | -23 25 08 | B | 6 | … | … | 6 | 26621 | 266 | |
| 091 | A4014 | 23 32 25.7 | -25 28 50 | B2 | 11 | 16 | 16 | 22 | 33840 | 261 | |
| 099 | A2628 | 23 37 01.4 | -24 10 58 | G | … | 9 | 7 | 9 | 55468 | 810 | |
| 101 | A2629 | 23 37 47.2 | -22 54 42 | B? | 7 | … | … | 7 | 62038 | 986 | |