On the transmission- to reprocessing-dominated spectral state transitions in Seyfert 2 galaxies
Abstract
We present Chandra and XMM-Newton observations of a small sample (11 objects) of optically-selected Seyfert 2 galaxies, for which ASCA and BeppoSAX had suggested Compton-thick obscuration of the Active Nucleus (AGN). The main goal of this study is to estimate the rate of transitions between “transmission-” and “reprocessing-dominated” states. We discover one new transition in NGC 4939, with a possible additional candidate in NGC 5643. This indicates a typical occurrence rate of at least 0.02 years-1. These transitions could be due to large changes of the obscuring gas column density, or to a transient dimming of the AGN activity, the latter scenario being supported by detailed analysis of the best studied events. Independently of the ultimate mechanism, comparison of the observed spectral dynamics with Monte-Carlo simulations demonstrates that the obscuring gas is largely inhomogeneous, with multiple absorbing components possibly spread through the whole range of distances from the nucleus between a fraction of parsecs up to several hundreds parsecs. As a by-product of this study, we report the first measurement ever of the column density covering the AGN in NGC 3393 ( cm-2), and the discovery of soft X-ray extended emission, apparently aligned along the host galaxy main axis in NGC 5005. The latter object hosts most likely an historically misclassified low-luminosity Compton-thin AGN.
keywords:
galaxies:active – galaxies:nuclei – galaxies:Seyfert – X-rays:galaxies1 Introduction
In X-rays, obscured AGN may be classified into Compton-thin and Compton-thick, according to the column of absorbing matter covering the active nucleus. The threshold corresponds to a column density cm-2. The fact that Compton-thick Seyfert 2s are a substantial fraction of the whole population of Seyfert 2 galaxies, maybe as high as 50% (Risaliti et al. 1999), suggests that the covering fraction of the absorbing matter is large. If a single absorber covers a steady-state active nucleus, the classification of individual objects is not expected to be time-dependent. A review on the observational properties of Compton-thick Seyfert 2 galaxies has been recently published by Comastri (2004).
Bona fide Compton-thick Seyfert 2 galaxies are observed in X-rays also at energies lower than the photoelectric cut-off. This X-ray emission is probably due to reprocessing of the nuclear emission by Compton-thick matter surrounding the nucleus [Matt et al. 2000], and/or by hot plasma in the nuclear environment [Kinkhabwala et al. 2002]. We define hereafter reprocessing-dominated Seyfert 2 galaxies those, whose X-ray emission in the XMM-Newton energy band ( keV) is dominated by reprocessing111This definition is therefore conceptually different from (Compton) reflection-dominated Seyfert 2s, where the emission in the XMM-Newton energy band is dominated by Compton-reflection off the far inner side of the absorber. Nevertheless, almost all known “reprocessing-dominated” AGN are “Compton reflection-dominated”.. The common wisdom so far has been to identify reprocessing-dominated Seyferts with Compton-thick AGN. However, very recently transitions between “Compton-thin” and “Compton-thick” spectral states have been serendipitously discovered in a few X-ray bright Seyfert 2 galaxies (Matt et al. 2003b, and references therein). In UGC 4203, for instance (Guainazzi et al. 2001; Ohno et al. 2004), an XMM-Newton observation detected a bright (2–10 keV flux erg cm-2 s-1) AGN, with a low-energy photoelectric cutoff (corresponding to cm-2). In ASCA observations, performed about six years earlier, the weaker continuum and the huge Kα fluorescent iron line (Equivalent Width, keV) can be instead best explained if the spectrum is dominated by the Compton echo of an otherwise invisible nuclear emission. Such transitions have been observed in both directions, and are normally accompanied by substantial changes in the observed 2–10 keV flux.
This discovery stimulates some fundamental questions on the nature of reprocessing-dominated Seyfert 2 galaxies. These transitions could be due in principle to a change of the intervening absorption. Alternatively, Seyfert 2 X-ray spectral states dominated by reprocessing may represent phases of low- or totally absent activity in the life of an active nucleus, as observed, for instance, in NGC 4051 (Guainazzi et al. 1998), NGC 2992 (Gilli et al. 2000), and NGC 6300 (Guainazzi 2002). In these cases, the observed transitions require a change by at least one order of magnitude of the nuclear activity level.
Transitions between “Compton-thin” and “Compton-thick” spectral states have been observed in 4 Seyfert 2 galaxies so far (see Matt et al. 2003b, and references therein), out of about 40 objects for which multiple X-ray spectroscopic measurements are available (Bassani et al. 1999; Risaliti et al. 2001). However, the “parent sample” is neither homogeneous, nor complete, being substantially biased toward brighter (and therefore less absorbed) objects (see the discussion in Risaliti et al. 1999).
We are carrying on a XMM-Newton survey of an optically defined and complete - albeit small - sample of Seyfert galaxies, classified as Compton-thick according to observations prior to the launch of Chandra and XMM-Newton. The primary goal of this study is to determine the rate of “transmission-” (i.e. Compton-thin) to “reprocessing-dominated” transitions222Although in this paper we will refer to “transmission-” to “reprocessing-dominated” transitions, we search for transitions in both directions, and their typical timescale on the soundest possible statistical basis. This rate might be related to the duty-cycle of the Active Galactic Nuclei (AGN) phenomenon, at least in the local universe, if these transitions are due to large changes of the overall X-ray AGN energy output [Matt et al. 2003b]. The results of this survey are the main subject of this paper.
2 The sample
Our objects are extracted from the sample of Risaliti et al. (1999), which includes nearby Seyfert 2 galaxies with ASCA/BeppoSAX measurements of the X-ray column density. We have restricted our analysis to those objects, whose [Oiii] luminosity is erg s-1. As Risaliti et al. (1999) discuss, this choice minimizes any bias due to incompleteness. Out of the potential fourteen members of our sample, priority “A” or “B” XMM-Newton observing time has not been allocated to five of them (IC 2560; IRAS 07145; NGC 5135; IC 3639; UGC 2456). We complement the XMM-Newton observations with two objects observed by Chandra (IC 2560; NGC 5135), whose data are available in the public archive. The galaxies discussed in this paper are listed in Table 1.
| Object | z | b | a | XMM-Newton | Exposure time | Time spanc | |
|---|---|---|---|---|---|---|---|
| ( cm-2) | (cm-2) | Obs. date | pn/MOS or ACIS (ks) | (years) | |||
| NGC 1068 | 0.004 | 3.5 | 1580 | 29/30-Jul-2000 | 61.6/66.8 | 2.5 | |
| Circinus | 0.0015 | 56 | 697 | 6/7-Aug-2001 | 70.0/76.0 | 3.5 | |
| NGC 5643 | 0.004 | 8.3 | 69 | 8-Feb-2002 | 7.1/9.4 | 4.9 | |
| NGC 1386 | 0.003 | 1.4 | 66 | 29-Dec-2002 | 13.6/17.0 | 6.0 | |
| NGC 5135 | 0.014 | 4.6 | 61 | 4-Sep-2001d | 29.3 | 6.6 | |
| NGC 3393 | 0.013 | 6.0 | 32 | 5-Jul-2003 | 10.9/14.2 | 6.5 | |
| NGC 2273 | 0.006 | 7.0 | 28 | 5-Sep-2003 | 10.0/12.6 | 6.5 | |
| NGC 5005 | 0.003 | 1.1 | 20 | 13-Dec-2002 | 13.1/8.8 | 7.0 | |
| NGC 4939 | 0.010 | 3.4 | 11 | 03-Jan-2002 | 11.5/- | 5.0 | |
| IC 2560 | 0.010 | 6.5 | 29/30-Oct-2000d | 9.8 | 3.9 | ||
| NGC 4945 | 0.002 | 15.7 | 21-Jan-2001 | 19.2/22.2 | 1.5 |
aafter Risaliti et al. (1999); derived from ASCA or BeppoSAX observation
bin units of erg cm-2 s-1
cminimum distance between the ASCA/BeppoSAX and the Chandra/XMM-Newton observation
dChandra observation
EPIC spectra of four of the objects listed in Table 1 have already been individually published: NGC 1068 [Matt et al. 2004], the Circinus Galaxy [Molendi et al. 2003], NGC 5643 [Guainazzi et al. 2004a], NGC 4945 [Schurch et al. 2002]. The Chandra observation of IC 2560 is presented by Iwasawa et al. (2002); the Chandra observation of NGC 5135 is discussed by Levenson et al. (2002, 2004). For the remaining five sources (NGC 1386, NGC 3393, NGC 2273, NGC 5005, NGC 4939) we present here for the first time the results of their XMM-Newton observations.
The average distance between the Chandra/XMM-Newton observation and the latest ASCA/BeppoSAX one of the same object is 4.9 years.
In this paper: energies are quoted in the source reference frame; errors on the count rate are at the 1 level; uncertainties on the spectral parameters are at the 90% confidence level for one interesting parameter; upper limits are as well at the 90% confidence level; in the calculation of the luminosities, we adopted a Hubble constant of 70 km s-1 Mpc-1 [Bennett et al. 2003]. Preliminary results of this study are discussed by Guainazzi et al. (2004b).
3 Data reduction and analysis
XMM-Newton data described in this paper were reduced with SAS v5.4.1 [Jansen et al. 2001], using the most updated calibration files available at the moment the data reduction was performed. In this paper, only data from the EPIC cameras (MOS; Turner et al. 2001; pn, Strüder et al. 2001) will be discussed. X-ray images are generally point-like. Deviations from point-like shapes are apparent in NGC 1068 [Matt et al. 2004], the Circinus Galaxy [Molendi et al. 2003], NGC 4945 [Schurch et al. 2002], NGC 5005 (Sect. 5). Event lists from the two MOS cameras were merged before accumulation of any scientific products. Single to double (quadruple) events were used to accumulate pn (MOS) spectra. High-background particle flares were removed, by applying standard thresholds on the single-event, keV, s light curves: 1 counts s-1 and 0.35 counts s-1 for each pn and MOS camera, respectively. Source spectra were extracted from 40 circular regions around the X-ray nuclear source centroid, except for NGC 5643 [Guainazzi et al. 2004a], where a smaller region was chosen to avoid a serendipitous nearby bright source. Background scientific products were extracted from annuli around the source for the MOS, and circular regions in the same or nearby chips for the pn, at the same height in detector coordinate as the source location. No significant variations in any energy bands has been observed during the XMM-Newton observations presented here for the first time. Spectra were binned in order to oversample the intrinsic instrumental energy resolution by a factor 3, and to have at least 25 counts in each background-subtracted spectral channel. This ensures that the statistics can be used to evaluate the quality of the spectral fitting. pn (MOS) spectra were fitted in the 0.35–15 keV (0.5–10 keV) spectral range.
The residuals of fits against a power-law continuum modified by photoelectric absorption are shown in Fig. 1 for all the sources presented in this paper except NGC 4945 [Schurch et al. 2002].


Notwithstanding differences, and despite the large dynamical range in observed flux, the residuals exhibit a remarkably similar pattern. Two continuum components can be distinguished, joining at 2 keV (the only exception being the Circinus Galaxy, whose soft X-ray spectrum is heavily absorbed by intervening matter in the plane of our Galaxy). Spectra with the best statistics show emission-like features in the 0.5–1.5 keV energy range (the exceptions being in this case IC 2560, NGC 2273, and NGC 4939, which have the lowest signal-to-noise soft X-ray spectra). Above 2 keV spectra are flat, and exhibit almost ubiquitously intense emission line features around 6 keV (observer’s frame), the only exceptions being NGC 5005, and NGC 4939. The latter feature is most straightforwardly explained as iron Kα fluorescence. These lines can be better appreciated in Fig. 2, where we show


background-subtracted spectra in the energy range around the Kα iron line with a constant linear binning of about 50 eV.
In Sect. 4 observed spectra will be compared against composite “two-continuum” scenarios. In these scenarios, the soft X-ray spectrum can be accounted for by one of the possible model combinations:
-
•
emission from an optically thin, collisionally ionized plasma (mekal in Xspec, Mewe et al. 1985) with free elemental abundances (“thermal scenario” hereafter)
-
•
a power-law with free spectral index , plus as many unresolved emission lines as required according to a 90% confidence level F-test criterion (“scattering scenario”)
The hard X-ray continuum will be instead accounted for by one of the following models:
-
•
a power-law with free spectral index , covered by photoelectric absorption with column density (“transmission scenario”)
-
•
a “bare” (i.e. unabsorbed) Compton-reflection spectrum (pexrav in Xspec; Magdziarz & Zdziarski 1995) with solar abundances (“(Compton-)reflection scenario”)
These simple parameterizations yield adequate fits for all the spectra presented in this paper. One should, however, be aware of possible limitations inherent to this simple approach. High-resolution spectroscopy of nearby Seyfert 2 galaxies (among which NGC 1068; Kinkhabwala et al. 2002; Brinkman et al. 2002) has convincingly demonstrated that soft X-ray emission is dominated - at least in some cases - by emission lines, with negligible contribution by an underlying continuum. Blending of these emission lines in the EPIC spectra can mimic a continuum emission. This point is discussed in larger extent by Iwasawa et al (2002). As our primary concern in this paper is the characterization of the nuclear absorber, the uncertainties induced by a purely phenomenological modeling of the soft X-ray spectrum will not substantially affect the core results of our paper (Guainazzi et al. 2004a). In the above modeling, we exclude moreover the possibility that the reprocessed component dominating the hard X-ray spectrum in the “reflection scenario” is in turn absorbed - e.g. by the near side outer rim or atmosphere of the same matter, responsible for reprocessing. This possibility is discussed by Guainazzi et al. (2004a) with respect to the NGC 5643 case. In none of the other sources discussed in this paper we have found convincing evidence for this possibility. However, statistics is often not good enough to strictly rule it out.
4 XMM-Newton/Chandra results
In this Section we summarize the results of the XMM-Newton and Chandra (IC 2560 and NGC 5135) observations of the targets listed in Table 1.
4.1 NGC 1068
NGC 1068 is one of the X-ray brightest and best studied Compton-thick Seyfert 2 galaxies. Its Compton-thick nature had been suggested by the prominent and multi-component Kα emission line complex observed by ASCA (Ueno et al. 1994; Iwasawa et al. 1997), and finally confirmed by BeppoSAX [Matt et al. 1997a]. The column density of the absorber covering the active nucleus probably exceeds cm-2 [Matt et al. 1997a]. The soft X-rays are dominated by line emission following photoionization and photoexcitation by the active nucleus emission [Kinkhabwala et al. 2002], with little contribution from the circumnuclear starburst [Wilson et al. 1992].
The EPIC spectrum of the XMM-Newton observation is discussed by Matt et al. (2004). Several Fe and Ni emission lines allowed them to study in details the nature of the reflecting matter. Detection of iron Kα Compton-shoulder confirms that the neutral reflector is Compton-thick. It is likely to be the far side inner wall of the absorber. Iron (nickel) overabundance of a factor about 2 (4), for lower Z elements when compared to solar values was measured as well.
4.2 The Circinus Galaxy
The Circinus Galaxy hosts the closest known active nucleus. ASCA unveiled a reprocessing-dominated spectrum [Matt et al. 1996]. Detection of the nuclear emission in the PDS instrument on-board BeppoSAX [Matt et al. 1999] allowed to precisely measure the column density of the absorber covering the nucleus ( cm-2). In hard X-rays the nuclear emission is dominated by an unresolved bright core on scales pc [Sambruna et al. 2001]. The EPIC hard X-ray spectra are discussed by Molendi et al. (2003). Again, the measurement of iron Kα Compton-shoulder - previously discovered by Chandra [Bianchi et al. 2002] - allowed them to identify matter responsible for the Compton-reflection dominating below 10 keV with the Compton-thick absorber
4.3 NGC 5643
Maiolino et al. (1998) classified NGC 5643 as a Compton-thick ( cm-2) Seyfert 2 galaxy, whose 0.1–10 keV spectrum is dominated by free electron scattering. However, in a later XMM-Newton pointing Guainazzi et al. (2004a) measured a line-of-sight column density in this object, comprised between 0.6 and cm-2. The absorber may be directly covering the nuclear emission or its Compton-reflection. Comparison with previous BeppoSAX and ASCA observations unveiled dramatic changes in the 1–10 keV spectral shape, which can be parameterized as an observed photon index dynamical range accompanying a variation of the 2–10 keV flux by a factor 10. The extreme variability observed in the nuclear emission of this object indicates the revival of an AGN which was “switched-off” during the BeppoSAX observation. The interpretation of this large variation is, however, complicated by the fact that the large ASCA and BeppoSAX apertures (3′) encompass a bright serendipitous source (christened “NGC 5643 X-1” by Guainazzi et al. 2004a), apparently located in one of the wide spiral arm of this face-on galaxy. Understanding the spectral dynamics associated with the flux changes requires instruments capable of distinguishing the contribution of the two bright X-ray sources.
4.4 NGC 5135
We have reanalyzed the Chandra observation already discussed by Levenson et al. (2004). Our results are substantially coincident with theirs. The ACIS-S3 spectrum is best-fit in the “thermal+reflection” scenario. The soft X-ray spectrum requires two thermal components with and eV, plus an additional emission line with centroid energy keV. Above 2 keV the spectrum is Compton-reflection dominated, consistent with the AGN being obscured by a column density cm-2 (for an intrinsic photon index of 1.5 and a reflection fraction 0.5). The intensity of the Kα fluorescent emission line is photons cm-2 s-1, corresponding to an EW against the reflection continuum of keV. The absorption-corrected fluxes in the 0.5–2 and 2–10 keV energy bands are and erg cm-2 s-1, respectively.
4.5 NGC 1386
The results of the XMM-Newton observation of NGC 1386 are presented for the first time in this paper. Two of the baseline scenarios can be ruled out. The “scattering+reflection” scenario can be rejected, as it produces a rather bad . The “thermal+transmission” scenario yields a better fit (). However, it requires a rather flat AGN spectral index (). The two remaining scenarios yield comparably good fits: “scattering+transmission”: ; “thermal+reflection”: . In the former, the EW of the Kα iron line ( keV) is too large with respect to the expected values for transmission through a uniform shell of material encompassing the continuum source [Leahy & Creighton 1993], assuming the best-fit cm-2. In the latter, two thermal components are required to account for the bulk of the soft X-rays, alongside a Compton-reflection component plus iron Kα iron line dominating above about 2 keV. The best-fit parameters for the fits discussed in this Section are reported in Table 2.
| Hard X-ray continuum | Emission lines | Soft X-rays | ||||||||
| Source | Model | a | b | |||||||
| ( cm-2) | (keV) | (keV) | (keV) | () | ||||||
| NGC 1386 | TR | … | 133.4/94 | |||||||
| (0.12 keV) | ||||||||||
| NGC 3393 | TR | … | 55.8/43 | |||||||
| (0.14 keV) | ||||||||||
| NGC 2273 | TR | … | 55.2/51 | |||||||
| NGC 5005 | TT | 6.4c | … | 126.4/122 | ||||||
| (0.60 keV) | ||||||||||
| NGC 4939 | ST | 6.4c | … | … | 21.1/21 | |||||
| c | ||||||||||
acalculated assuming frozen to its best-fit value for Compton-reflection dominated spectra, and a reflection fraction
bin units of photons cm-2
cfrozen
Residuals against the best-fit models are shown in Fig. 3.


4.6 NGC 3393
NGC 3393 is the object in our sample with the lowest signal-to-noise in the hard X-ray band. The iron line is barely detectable above a very weak continuum, with , corresponding the the 98.3% confidence level, if one assumes that the line is predominantly neutral.. The scattering scenario yields . Thermal model for the soft X-ray spectra produces a significantly better fit. In the hard X-ray band, transmission- and reflection-dominated scenarios yield statistically comparable fits. In the former scenario the EW of the Kα iron line () is about one order-of-magnitude larger than expected from the measured column density [ cm-2, if ]. We conclude therefore that Compton-reflection dominance is the most plausible explanation for the hard X-ray spectrum in this object. The lower limit on the column density covering the active nucleus derived from the XMM-Newton observation [ cm-2 if (1.9)] strictly speaking does not rule out an - albeit extreme - Compton-thin absorber. Nonetheless, its ultimate nature is confirmed by a reanalysis of the BeppoSAX observation (cf. Sect. 5). An emission line with centroid energy keV is required at the 95.1% confidence level (). This line may correspond to Kα fluorescence of Si, which is expected to be produced by Compton-reflected spectra. However, its EW against the reflected continuum is 5 keV, too large to be produced by the same Compton-reflection responsible for the iron emission [Matt et al. 1997b].
4.7 NGC 2273
For NGC 2273 the family of models where hard X-rays are accounted for by an absorbed power-law yield an unacceptably flat intrinsic spectral index (–0.5), as well as an unacceptably large EW of the iron Kα iron line (–3.6 keV) with respect to the measured column density (– cm-2). Compton-reflection domination is a viable alternative. Modeling the soft X-rays with the “thermal” or the “scattering” scenario makes very little difference on the properties of the hard X-ray continuum or of the Kα iron line, although in the latter scenario the photon index best-fit value is closer to standard values for AGN ( versus 1.2, respectively). In Table 2 we list the results obtained with the former.
4.8 NGC 5005
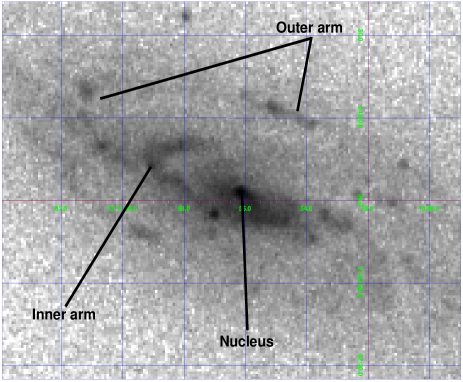
The XMM-Newton observation shows that the X-ray emission is extended, and apparently elongated along a direction close to the main axis of the host galaxy, or coincident with an inner spiral arm, visible in the simultaneous OM UVW1 filter (2500-4000) image (Fig. 4).
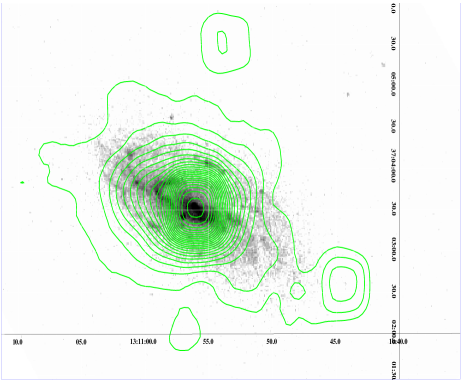
Although the diffuse emission is mostly associated with soft X-rays, the statistics is not good enough to estimate a threshold energy, above which the X-ray emission is no longer extended. Assuming that the diffuse emission is due to shocked gas in regions of intense star formation, we have considered only models where at least part of the soft X-rays are due to a thermal component. Hard X-ray Compton-dominance is unlikely. A fit where the hard X-ray emission is due to a “bare” Compton-reflection yields a very steep intrinsic spectral index (). Moreover, no iron Kα fluorescent line is detected, and the upper limit on the EW of a 6.4 keV narrow Gaussian profile is rather strict ( eV). Transmission through a moderate absorber ( cm-2) is a viable alternative. The soft X-rays can be accounted for by the combination of two thermal components () or of one thermal component and a scattered power-law (). In Tab. 2 we show the results obtained in the former scenario. In the latter, , and cm-2.
4.9 NGC 4939
NGC 4939 was serendipitously located in the pn field of view of an observation of SAX J1305.2-1020. Its spectrum is the only one in our sample, which clearly exhibits a soft photoelectric cut-off (cf. Fig. 1). Indeed, the “transmission” scenario accounts well for the hard X-rays, with cm-2. Modeling the soft X-rays with a single thermal component ( keV) or a steep power-law () yields fits of equivalent statistical quality: , and 21.1/21, respectively. The best-fit parameters and results for the latter are shown in Table 2. An emission line is additionally required at the 94.0% confidence level only (). Its centroid energy is inconsistent with emission from neutral iron: keV. If, following Maiolino et al. (1998; cf. Sect. 5 as well), we interpret this shift of the centroid energy as due to a blend of neutral and a H-like transitions, the 90% upper limits on the EW of either component are 70 eV and 210 eV, respectively.
4.10 NGC 4945
The XMM-Newton observation of NGC 4945 is discussed by Schurch et al. (2002). The galaxy core has a complex morphology. It is dominated by reprocessing, as the nucleus is covered by a thick absorber ( cm-2; Done et al. 1996). Compton-reflection from the inner side of an edge-on torus leaves its imprinting in the hard X-ray spectrum through a 1.6 keV EW Kα emission line, consistent with previous findings (Guainazzi et al. 2000a; Madejski et al. 2000). In soft X-rays, multi-temperature emission from a nuclear starburst dominates, a two temperature model yielding 0.9 keV and 6.9 keV. The hard X-ray emission exhibits a resolved morphology, suggesting that part of the gas in the starburst region is exposed to the AGN radiation as well.
4.11 IC 2560
IC 2560 has not been observed by XMM-Newton. The results of a Chandra observation of this target are discussed by Iwasawa et al. (2002). A model constituted by a two-component thermal emission plus a Compton reflection dominated spectrum (with ) is an adequate description of the spectrum (). The EW of the Kα iron line is keV. In principle, a statistically equivalent fit is obtained if the “bare” Compton-reflection component is substituted by an absorbed power-law (). However, in this scenario the Kα iron line EW ( keV) is almost two orders of magnitude too large than expected in transmission from the measured column density ( cm-2). The Chandra observation therefore supports the interpretation of the IC 2560 ASCA spectrum as hard X-ray reprocessing-dominated [Risaliti et al. 2000], against the interpretation of the same data in terms of a Compton-thin absorber covering the nuclear emission given by Ishihara et al. (2001)
4.12 Fluxes and luminosities
In Table 3 we present the
| Source | 0.5–2 keV | 2–10 keV |
|---|---|---|
| NGC 1386 | ||
| NGC 3393 | ||
| NGC 2273 | ||
| NGC 5005 | ||
| NGC 4939 |
observed fluxes in the 0.5–2 keV and 2–10 keV energy ranges for all the sources in Table 2. The corresponding luminosity corrected for Galactic absorption in the soft X-ray band ranges between to erg s-1 (cf. Fig. 10). In the hard X-ray band, the determination of the intrinsic AGN luminosity is impossible for all cases where only lower limits on the nuclear absorbing column density exist. For Compton-thick sources they are anyhow plagued by large uncertainties. For the two sources which are Compton-thin in XMM-Newton observations, the 2–10 keV luminosity is erg s-1 (NGC 4939), and erg s-1 (NGC 5005), respectively.
5 Comparison with ASCA/BeppoSAX results
In this Section we compare the results of the Chandra and XMM-Newton observations described in Sect. 4 with prior ASCA and BeppoSAX measurements. All the spectra described in this Section were extracted from calibrated and linearized event lists available in the public archive, and reanalyzed by us. Whenever more than one observation was available for a given source, we have considered the latest (in no case significant spectral variability was observed across different ASCA/BeppoSAX observations, with the only exception of NGC 1068 (Guainazzi et al. 2000b; Colbert et al. 2002). This exception does not substantially affect any of the results discussed in this paper.
Variability in the soft (0.5–2 keV) and hard (2–10 keV) X-ray flux is generally restricted to a factor of 3 [Guainazzi et al. 2004b]. The intensities (but not the EWs: see Sect. 6 below) of the Kα iron lines are consistent with a factor as well. The only exception is NGC 3393 (cf. Table 2, and Table 4), where a delay in the response of a variable primary continuum probably occurs.
In the following, some additional details are given
on the analysis of the ASCA/BeppoSAX observations,
whenever our analysis reaches
further or different conclusions with respect to what published
in the literature, or shown by the XMM-Newton observations.
NGC 5135: the absorption-corrected 0.5-2 keV flux during
the January 1995 ASCA observation was erg cm-2 s-1. At face value this is one
order of magnitude larger than measured by Chandra 6.6 years
later. However, the difference is at the 1- level only,
if the statistical uncertainties are taken into account.
The other spectral parameters are consistent with the Chandra
results, with large errors.
NGC 3393: NGC 3393 is one of the few targets in our sample, which was
detected by the PDS instrument on board BeppoSAX above 15 keV
(count rate: s-1). The BeppoSAX observation
is discussed by Maiolino et al. (1998). They interpret the
BeppoSAX spectrum as due to a Compton-thick source,
with a column density cm-2.
The overall poor statistics of the BeppoSAX observation
prevented them from applying more complex models.
However, the PDS data points
in their Fig. 1 lay systematically above the extrapolation
of the best-fit model in the 2–10 keV band.
We have first applied the best model of the XMM-Newton observation to the BeppoSAX spectra. As NGC 3393 is undetected by the LECS instrument below 2 keV, we kept the parameters of the thermal components and of the keV emission line frozen to the XMM-Newton best-fit values, as the contribution of these components is negligible in the MECS-PDS energy bandpass. The best-fit intrinsic spectral index face value turns out to be . Although the quality of the fit is acceptable (), this flat index - still consistent with the XMM-Newton results within the large statistical uncertainties - is suggestive of additional spectral complexity. If is fixed to the XMM-Newton best-fit value (1.6), the PDS counts are largely underpredicted (Fig. 5).

The difference is even larger if more typical values are used. We conclude that the flux in the PDS band is dominated by the nuclear emission piercing through a Compton-thick absorber, with cm-2. Adding an absorbed power-law to the XMM-Newton best-fit model yields an improvement in the quality of the fit at the 96.7% confidence level (), with cm-2, and a slightly steeper intrinsic spectral index. The best-fit parameters are shown in Table 4. These results confirm that
| ( cm-2) | |
|---|---|
| Fe Kα line: | |
| (keV) | |
| a | |
| (keV) | |
| 13.6/15 | |
ain units of photons cm-2
the column density covering the NGC 3393 nucleus is indeed
Compton-thick, although not large enough to fully suppress
the nuclear emission.
NGC 4939: NGC 4939 was classified as a Compton-reflection
dominated Compton-thick AGN by Maiolino et al. (1998),
on the basis of the very flat spectral index obtained
in the “transmission-scenario”, and the fact that
this model underpredicts the emission in the PDS band
(13-200 keV count rate: s-1).
We have reanalyzed the same data, obtaining results which are
basically consistent with theirs. The EW of a single
Gaussian profile accounting for the observed iron
emission line ( eV) is indeed too large
with respect to the measured column density in
the transmission scenario ( cm-2).
A fit where
hard X-rays are dominated by a “bare” Compton-reflection
is excellent (; Table 5).
| ( cm-2)a | |
|---|---|
| 0.5–2 keV fluxb | |
| 2–10 keV fluxb | |
| Fe Kα lines: | |
| c | |
| (eV) | |
| c | |
| (eV) | |
| 45.4/55 | |
aassuming
bin units of erg cm-2 s-1
cin units of photons cm-2
The reflection-dominated state is confirmed by the large EW of the neutral component of the iron Kα fluorescent line ( eV). The H-like component exhibits a comparable EW. The combination of hard X-ray continuum and iron emission line EW points to a transition between a “reprocessing-” and a “transmission-dominated” state occurring between the January 1997 BeppoSAX and the March 2001 XMM-Newton observation. A comparison between the 3–10 keV spectral energy distribution, based on the best-fit BeppoSAX and XMM-Newton models, is shown in Fig. 6.

It is interesting to observe that the soft ( keV) X-ray
flux decreased by a factor 3.5
between the BeppoSAX and the XMM-Newton observation.
This supports our interpretation of the soft X-ray emission
in this object as due to scattering of the primary nuclear
continuum, which was mirroring a previous phase of
strong AGN activity during the BeppoSAX observation.
NGC 5005:
NGC 5005 was declared Compton-thick by Risaliti et al.
(1999) on the basis of the low
X-ray versus O[iii] luminosity ratio, although no evidence for either
a flat hard X-ray spectrum or for a Kα iron
line was observed in the ASCA spectrum. The upper limit
of the EW of the latter feature (900 eV) was
still consistent
with heavy obscuration. None of the criteria adopted
to classify this source as a Compton-thick object
resists scrutiny after the XMM-Newton
observation. The upper limit on the Kα iron line
EW is strict ( eV).
The application of the best-fit XMM-Newton model
(cf. Tab. 2) to the ASCA
yields a good fit (), showing that
the ASCA data have not enough statistics to
distinguish a “transmission- ” from a “reprocessing-dominated”
scenario on the basis of the X-ray continuum shape.
Literature measurements of the O[iii] flux - once
corrected for optical reddening using the prescription
in Bassani et al. (1999) - span
a rather large interval, between 0.3 and erg cm-2 s-1 (Shuder & Osterbrock 1981;
Dahari & De Robertis 1988; Ho et al. 1997; Risaliti et al. 1999).
This interval is consistent with 2–10 keV
versus O[iii] ratio values observed in
Compton-thin as well as Compton-thick Seyfert 2s (Fig. 7).

We therefore conclude that NGC 5005 is most likely a mis-classified Compton-thin Seyfert 2.
6 Discussion
6.1 How much do we know of Compton-thick Seyfert 2 galaxies?
The safest way to identify a Compton-thick Seyfert 2 galaxy, and describe - even at the simplest phenomenological level - the basic X-ray properties of its nuclear emission is to detect the primary continuum piercing through the Compton-thick absorber. This requires measurement above 10 keV, which have been possible so far only on the 10 objects detected by the PDS instrument on-board BeppoSAX. For all the remaining known 40 Compton-thick Seyfert 2 [Comastri 2004] the classification relies on indirect evidence, such as the flatness of the hard X-ray continuum, the EW of the Kα iron fluorescent emission line(s), or anomalous low values of the ratio between the flux in the 2–10 keV energy band and in other wavelengths.
Waiting for an X-ray detector of better keV sensitivity than the PDS, the robustness of the criteria used to identify Compton-thick objects can be tested with the improved sensitivity that the XMM-Newton optics offer. In our sample, the Compton-thick nature is confirmed for all objects, except NGC 5005 ( cm-2), and - marginally - NGC 5643 (Guainazzi et al. 2004a; – cm-2), apart from NGC 4939, obviously. This is a potentially important result, as it underlines the perspective to extend the search for Compton-thick objects at higher redshift [Fabian et al. 2002]. Although classification of an individual object may be subject to uncertainties even when large EW iron lines are detected, the method is robust.
6.2 The moderately unstable temper of heavily obscured AGN
The scope of this paper is comparing the X-ray spectral properties of a complete, unbiased sample of Compton-thick Seyfert 2 galaxies observed with Chandra and XMM-Newton with prior measurements. The main scientific goal is to estimate the rate of transitions between “transmission- ” and “reprocessing-dominated” spectral states.
These transitions were serendipitously discovered on a few nearby active nuclei, once a larger database of X-ray observations allowed us some knowledge of the X-ray history of a wider sample of AGN. These transitions affect Seyfert 2 galaxies (NGC 2992; Gilli et al. 2000; NGC 1365; Iyomoto et al. 1997, Risaliti et al. 2000; UGC 4203, Guainazzi et al. 2001; NGC 6300 Guainazzi 2002), as well as other AGN (NGC 4051; Guainazzi et al. 1998, Uttley et al. 1999; PG 2112+059; Gallagher et al. 2004). It has been claimed that variability of the absorbing column density by a factor on timescales year is common in obscured AGN [Risaliti et al. 2002]. In one of the best-monitored cases (NGC 3227; Lamer et al. 2003), the symmetric profile of the absorption light curve clearly suggests an interpretation in terms of line-of-sight crossing by an individual cloud. The transitions we are discussing in this paper, however, represent a different phenomenology, whereby the apparent variation of the absorbing column density is of at least one order-of-magnitude, and the state corresponding to the lower X-ray flux is fully reprocessing-dominated.
The main conclusion of this study is summarized in Fig. 8, where we use the Kα iron line EW - measured by BeppoSAX/ASCA and Chandra/XMM-Newton - as a hallmark for bona fide Compton-thick AGN. Only “narrow” or “unresolved” components corresponding to neutral or mildly ionized iron transitions have been used in the calculation of the EWs shown in Fig. 8. We do not consider
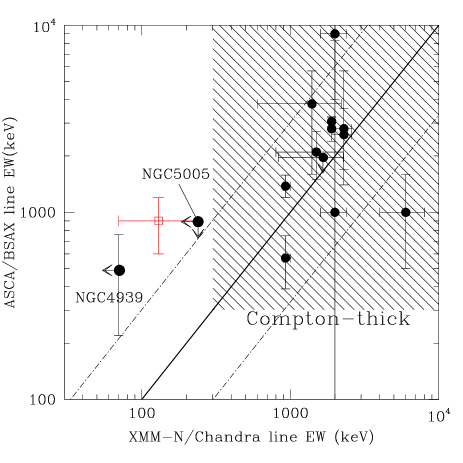
the contribution of Compton-shoulder, which is likely to be in most cases [Matt 2002]. The locus corresponding to “Compton-thick” objects is conservatively bordered by the line eV, corresponding to the brightest emission line produced by transmission through a Compton-thin screen, covering a 2 solid angle [Leahy & Creighton 1993]. Out of the 10 Compton-thick Seyferts discussed in this paper, we find evidence for only one transition: NGC 4939. This implies that a typical timescale for these transitions should be 50 years, on the basis of the average separation between the ASCA/BeppoSAX and the closest Chandra/XMM-Newton observations. Of course, given the size of our sample, this has to be regarded as no more than an order-of-magnitude estimate. However, it is consistent with previous determinations, based on inhomogeneous and incomplete samples.
The origin of the spectral changes occurring when an AGN transforms its appearance from a “transmission-” to a “reprocessing-dominated” state is still not fully elucidated. In principle, high-quality, high-resolution measurements, following the onset of the variability or the AGN recovery after a prolonged “off-state” should be decisive.
In NGC 6300 and NGC 2992 we have the strongest evidence that transitions from transmission- to reprocessing-dominated states are due to a change of the optical path through which the nucleus is being observed, due to a temporary interruption of the nuclear activity. In NGC 6300 this is suggested by the very large Compton-reflection continuum observed by BeppoSAX [Guainazzi 2002]. In NGC 2992, the history of the X-ray emission is comparatively well sampled. The X-ray flux decreased by about a factor of 20 from the first HEAO-1 detection in the early 80s, up to the 1994 ASCA observation, just to experience a factor 15 recovery by 1999 [Gilli et al. 2000]. To these two cases, we might add the large dynamical range of the NGC 5643 AGN X-ray output [Guainazzi et al. 2004b], a promising transition candidate. Unfortunately our knowledge of the X-ray history of NGC 4939, and UGC 4203 is too poor, for us to be able to draw any final conclusions on this issue. Recently Ohno et al. (2004) proposed a change by a factor of the absorber column density as the most likely explanation in the latter. On the other hand, multiple X-ray observations of optically defined samples of unobscured AGN have not detected a significant rate of large historical X-ray flux variations (compare, for instance, Laor et al. 1997, George et al. 1998, and Porquet et al. 2004). When one is dealing with X-ray unobscured AGN a bias toward brightest, less obscured object, may prevent us from discovering the fraction of X-ray unobscured counterparts to our “transient” Compton-thick Seyferts. However, this may as well suggest an alternative interpretation in terms of changes in the properties of line-of-sight gas. This scenario will be investigated in the next Section.
6.3 The recovery of fossil AGN as probe of the circumnuclear medium
“Transmission-” to “reprocessing-dominated” transitions can be used to probe some properties of the gas in the nuclear environment in highly obscured AGN. The method - based on Monte-Carlo simulations - is described by Matt et al. (2003b). The application of this method to the five known transitions is summarized in Fig. 9,

where we show the 2–4 keV versus 4–10 keV flux softness ratio for the Compton-reflection component in the reprocessing-dominated state against the measured column density in the transmission-dominated state. The solid line represents the expected correlation according to simulations. In the ASCA observation of NGC 2992, and possibly in UGC 4203, the spectrum observed during a reprocessing-dominated state is too hard to be due to Compton-reflection by matter with the same column density as measured by the soft photoelectric cut-off during transmission-dominated states. A similar argument can be applied to NGC 6300, on the basis of its X-ray spectrum above 10 keV (Guainazzi 2002; Matt et al. 2003b). The gas responsible for line-of-sight absorption should be therefore different in density from the gas responsible for reflection, the latter being most likely located at the far inner side of the molecular “torus”. This may be explained by a largely inhomogeneous compact (i.e., 1 pc) nuclear absorber [Ohno et al. 2004], or by Compton-thin absorption occurring on much larger scales than the nuclear “torus”, e.g. in dusty regions associated with starburst formation [Weaver 2001], or with the host galaxy (Maiolino & Rieke 1995; Malkan et al. 1998). An extension of the Seyfert Unified scenario, which encompasses the latter possibility is discussed by Matt (2000). It is also noteworthy that in 3 out of 5 cases the SR in Fig. 9 is softer then expected by a pure Compton-reflection spectrum even in the reprocessing-dominated states. This suggest a still not-negligible contamination by a softer component, e.g. a not fully “switched-off” AGN continuum. This possibility is confirmed by a detailed spectral analysis of the BeppoSAX observation of NGC 2992, the X-ray brightest among the objects displayed in Fig. 9, where the recovery of the AGN is witnessed by a comparatively small value of the normalization ratio between the reflected and the transmitted component [)] with respect to a bare Compton-reflection dominated state.
In summary, the spectral properties of “transmission-” to “reprocessing-dominated” transitions indicate that obscuring matter in AGN is far from being homogeneous in space or time. Yet, one cannot discard the idea of a compact but inhomogeneous pc-scale “torus” [Antonucci 1993], or disk outflow [Elvis 2000]. Such inhomogeneities might be the ultimate responsible for these transitions. However, the fact that photoionized- or starburst-dominated soft X-ray emission in several Seyfert 2 galaxies is absorbed as well (Iwasawa & Comastri 1998; Matt et al. 2001; 2003a), alongside our knowledge of the X-ray history in NGC 6300 and, above all, NGC 2992, suggests that an important contribution to X-ray obscuration comes from matter associated to the host galaxy, beyond the innermost pc around the central engine.
6.4 The origin of the soft X-ray emission
Our program was not specifically tuned to investigate the origin of the soft X-ray emission in our sample. The answers that we get from the data on this issue are therefore inevitably ambiguous in almost all cases. The only exception is NGC 5005 (the only non Compton-thick source in the sample). In this case, the soft X-ray emission is clearly extended on scales comparable with the optical size of the galaxy, and roughly aligned with its main axis, or with an inner arm UV structure. For all the other cases, the two proposed scenarios are equally viable on the basis of the EPIC data alone. Whenever high-resolution spectroscopic data are available, soft X-rays appear to be dominated by emission lines following photoionization and photoexcitation by the primary AGN emission (Kinkhabwala et al. 2002; Sambruna et al. 2001; Bianchi et al. 2001), with little or no contribution by nuclear starbursts. On the other hand, the 0.5–4.5 keV X-ray luminosities are generally consistent with the correlation with the Far InfraRed (FIR) luminosity empirically determined by David et al. (1992) on a large sample of starburst-dominated galaxies (Turner et al. 1997; Maiolino et al. 1998; Fig. 10), the only discrepant objects being NGC 4939, and NGC 4945.

This, however, holds as well to objects (such as the Circinus Galaxy), for which it is unlikely that soft X-rays are dominated by starburst. On the other hand, high-resolution imaging of NGC 4945 with Chandra shows that soft X-rays are likely to be dominated by thermal emission from starbursts, alongside a starburst mass-loaded superwind [Schurch et al. 2002]. While we refer to Guainazzi et al. (2004a) for a more detailed discussion on this point, we conclude for the time being that a throughout determination of the physical properties of the plasma dominating the soft X-rays in obscured AGN requires deep exposures with high-resolution detector, which are currently possible only on a limited number of objects.
7 Conclusions
The main result of this paper is the estimate of the occurrence rate of “transmission-” to “reprocessing-dominated” state transitions, on the most unbiased and complete existing sample of Compton-thick Seyfert 2 galaxies (cf. Fig. 8). We have discovered 1 (new) transition out of a sample of 10 bona-fide Compton-thick objects, with an average time span between pre- and post XMM-Newton and Chandra launch observations of about 5 years. The statistics is still too small to determine anything more accurate than an order-of-magnitude estimate for the occurrence rate. Bearing this caveat in mind, it seems that once or twice every century we might be forced to change our X-ray absorption classification for each highly obscured AGN.
With respect to the mechanism responsible for these transitions, our results are consistent with the discussion in Matt et al. (2003b). Although an explanation in terms of varying line-of-sight column density cannot be ruled out, the fact that in the best studied cases these transitions are associated with large (10) fluctuations of the AGN X-ray output suggests that they are due to a change of the optical path through which we observe the nucleus. For the transition specifically discussed in this paper - NGC 4939 - the factor of 2 variation of the observed 2–10 keV band flux hides a larger variation of the AGN intrinsic power, as its true luminosity in the reprocessing-dominated state is unknown. If this is the correct interpretation, the transition occurrence rate translates immediately into a duty-cycle of the AGN phenomenon in the local universe.
Independently of the ultimate mechanism responsible for these transitions, comparison of their spectral properties with Monte-Carlo simulations demonstrates that obscuring gas in absorbed AGN cannot be distributed in a space- or time- homogeneous structure. Again, a compact but inhomogeneous “torus” cannot be ruled out. However, there is mounting evidence that gas in regions of intense star formation and dust in the host galaxy play a major role, and might be ultimately responsible for the bulk of Compton-thin X-ray absorption in AGN.
Acknowledgments
This paper is based on observations obtained with XMM-Newton, an ESA science mission with instruments and contributions directly funded by ESA Member States and the USA (NASA). This research has made use of data obtained through the High Energy Astrophysics Science Archive Research Center Online Service, provided by the NASA/Goddard Space Flight Center and of the NASA/IPAC Extragalactic Database (NED) which is operated by the Jet Propulsion Laboratory, California Institute of Technology, under contract with the National Aeronautics and Space Administration. GM acknowledges financial support from MIUR grant COFIN-03-02-23. Careful reading, and insightful suggestions by an anonymous referee are gratefully acknowledged.
References
- [Antonucci 1993] Antonucci R., 1993, ARA&A 31, 473
- [Bennett et al. 2003] Bennett C.L., et al., 2003, ApJS, 148, 1
- [Bianchi et al. 2002] Bianchi S., Matt G., Fiore F., Fabian A.C., Iwasawa K., Nicastro F., 2002, A&A, 396, 793
- [Bianchi et al. 2001] Bianchi S., Matt G., Iwasawa K., 2001, 322, 669
- [Brinkman et al. 2002] Brinkman A.C., Kaastra J.C., van der Meer R.J.L., Kinkhabwala A., Behar E., Kahn S., Paerels F.B.S., Sako M., 2002, A&A, 396, 761
- [Colbert et al. 2002] Colbert E.J.M., Weaver K.A., Krolik J.H., Mulchaey J.S., Mushotzky R.F., 2002, ApJ, 581, 182
- [Comastri 2004] Comastri A., in “Supermassive Black Holes in the Distant Universe, Ed. Barger A.J,, Kluwer Academic Press (astroph/0403693)
- [Dahari & De Robertis 1988] Dahari O., De Robertis M.E., 1988, ApJSS, 67, 249
- [David et al. 1992] David L.P., Jones C., Forman W., 1992, ApJ, 388, 82
- [Done et al. 1996] Done C. Madejski G.M., Smith D.A., 1996, ApJ, 463, L63
- [Elvis 2000] Elvis M., 2000, ApJ, 545, 63
- [Fabian et al. 2002] Fabian A.C., Wilman R.J., Crawford C.S., 2002, MNRAS, 329, L18
- [Gallagher et al. 2004] Gallagher S.C., Brandt W.N., Wills B.J., Charlton J.C., Chartas G., Laor A., 2004, ApJ, 603, 425
- [George et al. 1998] George I.M., Turner T.J., Netzer H., Nandra K., Mushotzky R.F., Yaqoob T., 1998, ApJS, 114, 73
- [Gilli et al. 2000] Gilli R., Maiolino R., Marconi A., Risaliti G., Dadina M., Weaver K.A., Colbert E.J.M., 2000, A&A 355, 485
- [Guainazzi 2002] Guainazzi M., 2002, MNRAS, 329, L13
- [Guainazzi et al. 1998] Guainazzi M., et al., 1998, MNRAS 301, L1
- [Guainazzi et al. 2000a] Guainazzi M., Matt G., Brandt W.N., Antonelli L.A., Barr P., Bassani L., 2000a, A&A, 356, 463
- [Guainazzi et al. 2001] Guainazzi M., Matt G., Fiore F., Perola G.C., 2001, A&A, 388, 787
- [Guainazzi et al. 2000b] Guainazzi M., Molendi S., Vignati P., Matt G., Iwasawa K., 2000b, NewA, 5, 235
- [Guainazzi et al. 2004a] Guainazzi M., Rodriguez-Pascual P., Fabian A.C., Iwasawa K., Matt G., 2004a, MNRAS, submitted
- [Guainazzi et al. 2004b] Guainazzi M., Rodriguez-Pascual P., Fabian A.C., Iwasawa K., Matt G., Fiore F., 2004b, Proceedings of the Conference “Multiwavelength AGN Surveys”, in press (astroph/0404031)
- [Ho et al. 1997] Ho L.C., Filippenko A.V., Sargent W.L.W., 1997, ApJS 112, 315
- [Kinkhabwala et al. 2002] Kinkhabwala A., et al., 2002, ApJ, 575, 732
- [Jansen et al. 2001] Jansen F., Lumb D., Altieri B., et al., 2001, A&A 365, L1
- [Ishihara et al. 2001] Ishihara Y., Makai N., Itomoto N., Makishima K., Diamonds P., Hall P., 2001, PASJ, 53, 215
- [Iyomoto et al. 1997] Iyomoto N., Makishima K., Fukazawa Y., Tashiro M., Ishisaki Y., 1997, PASJ 49, 425
- [Iwasawa & Comastri 1998] Iwasawa K., Comastri A., 1998, MNRAS, 297, 1219
- [Iwasawa et al. 1997] Iwasawa K., Fabian A.C., Matt G., 1997, MNRAS, 289, 443
- [Iwasawa et al. 2002] Iwasawa K., Maloney P.R., Fabian A.C., 2002, MNRAS, 336, L71
- [Iwasawa et al. 2003] Iwasawa K., Wilson A.S., Fabian A.C., Young A.J., 2003, MNRAS, 345, 369
- [Lamer et al. 2003] Lamer G., Uttley P., McHardy I.M., 2003, MNRAS, 342, L41
- [Laor et al. 1997] Laor A., Fiore F., Elvis M., Wilkes B.J., McDowell J.C., 1997, ApJ, 477, 93
- [Leahy & Creighton 1993] Leahy D.A., Creighton J., 1993, MNRAS 263, 314
- [Levenson et al. 2002] Levenson N.A., Krolik J.H., ycki P.T., Heckman T.M., Weaver K.A., Awaki H., Terashima Y., 2002, ApJ, 573, L81
- [Levenson et al. 2004] Levenson N.A., Weaver K.A., Heckman T.M., Awaki H., Terashima Y., 2004, ApJ, 602, 135
- [Madejski et al. 2000] Madejski G., Zycki P., Done C., Valinia A., Blanco P. Rothschild R., Turek B., 2000, ApJ, 535, L87
- [Magdziarz & Zdziarski 1995] Magdziarz P.& Zdziarski A.A., 1995, MNRAS 273, 837
- [Maiolino & Rieke 1995] Maiolino R., Rieke G.H., 1995, ApJ 454, 95
- [Maiolino et al. 1998] Maiolino R., Salvati M., Bassani L., Dadina M., della Ceca R., Matt G., Risaliti G., Zamorani G., 1998, A&A 338, 781
- [Malkan et al. 1998] Malkan M.A., Gorijn V., Tam R., 1998, ApJS, 117, 25
- [Matt 2000] Matt G., 2000, A&A, 335, L31
- [Matt 2002] Matt G., 2002, MNRAS, 337, 147
- [Matt et al. 1996] Matt G., et al., 1996, MNRAS 281, L69
- [Matt et al. 1997a] Matt G., et al., 1997a, A&A, 325, L13
- [Matt et al. 1999] Matt G., et al., 1999, A&A 341, L39
- [Matt et al. 2003a] Matt G., Bianchi S., Guainazzi M., Brandt W.M., Fabian A.C., Iwasawa K., Perola G.C., 2003a, A&A, 399, 519
- [Matt et al. 2004] Matt G., Bianchi S., Guainazzi M., Molendi S., 2004, A&A, 414, 155
- [Matt et al. 2000] Matt G., Fabian A.C., Guainazzi M., Iwasawa K., Bassani L., Malaguti G., 2000, MNRAS 318, 173
- [Matt et al. 1997b] Matt G., Fabian A.C., Reynolds C., 1997b, MNRAS, 289, 175
- [Matt et al. 2003b] Matt G., Guainazzi M., Maiolino R., 2003b, MNRAS, 342, 422
- [Matt et al. 2001] Matt G., Guainazzi M., Perola G.C., Fiore F., Nicastro F., Cappi M., Piro L., 2001, A&A, 377, L31
- [Mewe et al. 1985] Mewe R., Gronenschild E.H.B.M., van der Oord G.H.J., 1985, A&AS, 62, 197
- [Molendi et al. 2003] Molendi S., Bianchi S., Matt G., 2003, MNRAS, 343, L1
- [Ohno et al. 2004] Ohno M., Fukazawa, Iyomoto N., 2004, PASJ, 56, 425
- [Porquet et al. 2004] Porquet D., Reeves J.N., O’Brien P., Brinkmann W., 2004, A&A, 422, 85
- [Risaliti et al. 2002] Risaliti G., Elvis M., Nicastro F., 2001, ApJ, 571, 234
- [Risaliti et al. 2000] Risaliti G., Maiolino R., Bassani L., 2000, A&A 356, 33
- [Risaliti et al. 1999] Risaliti G., Maiolino R., Salvati M., 1999, ApJ 522, 157
- [Sambruna et al. 2001] Sambruna R., Netzer H., Kaspi S., Brandt W.N., Chartas G., Garmire G.P., Nousek J.A., Weaver K.A., 2001, ApJ, 546, L13
- [Schurch et al. 2002] Schurch N.J., Roberts T.P., Warwick R., 2002, MNRAS, 335, 24
- [Shuder & Osterbrock 1981] Shuder J.M., Osterbrock D.E., 1981, ApJ, 250, 55
- [Stauffer 1982] Stauffer J.R., 1982, ApJ, 262, 66
- [Strüder et al. 2001] Strüder L., et al., 2001, A&A 365, L18
- [Turner et al. 1997] Turner T.J., George I.M., Nandra K., Mushotzky R.F., 1997, ApJS, 113, 23
- [Turner et al. 2001] Turner M.J.L., et al., 2001, A&A 365, L27
- [Ueno et al. 1994] Ueno S., Mushotzky R.F., Koyama K., et al., 1994, PASJ, 46, L71
- [Uttley et al. 1999] Uttley P., McHardy I., Papadakis I.E., Guainazzi M., Fruscione A., 1999, MNRAS 307, L6
- [Weaver 2001] Weaver K., 2001, ASP Conference Series, vol. 249, 389
- [Wilson et al. 1992] Wilson A.S., Elvis M., Lawrence A., Bland-Hawthorn J., 1992, ApJ, 391, L75