Is Double Reionization Physically Plausible?
Abstract
Recent observations of quasars and the cosmic microwave background imply a complex history to cosmic reionization. Such a history requires some form of feedback to extend reionization over a long time interval, but the nature of the feedback and how rapidly it operates remain highly uncertain. Here we focus on one aspect of this complexity: which physical processes can cause the global ionized fraction to evolve non-monotonically with cosmic time? We consider a range of mechanisms and conclude that double reionization is much less likely than a long, but still monotonic, ionization history. We first examine how galactic winds affect the transition from metal-free to normal star formation. Because the transition is actually spatially inhomogeneous and temporally extended, this mechanism cannot be responsible for double reionization given plausible parameters for the winds. We next consider photoheating, which causes the cosmological Jeans mass to increase in ionized regions and hence suppresses galaxy formation there. In this case, double reionization requires that small halos form stars efficiently, that the suppression from photoheating is strong relative to current expectations, and that ionizing photons are preferentially produced outside of previously ionized regions. Finally, we consider H2 photodissociation, in which the buildup of a soft ultraviolet background suppresses star formation in small halos. This can in principle cause the ionized fraction to temporarily decrease, but only during the earliest stages of reionization. Finally, we briefly consider the effects of some of these feedback mechanisms on the topology of reionization.
Subject headings:
cosmology: theory — galaxies: evolution — intergalactic medium1. Introduction
The epoch of reionization marks the time when collapsed objects began to influence the diffuse intergalactic medium (IGM) and first rendered it transparent to ultraviolet photons. It is an important milestone signaling the end of the “cosmological dark ages” and the emergence of the first luminous sources in the universe. A wide variety of observational probes have recently been used to constrain not only the reionization process itself but also the properties of the sources driving it.
The most powerful observational constraints come from Ly absorption spectra of high redshift quasars (Becker et al., 2001; Fan et al., 2002; White et al., 2003). At least one quasar shows a complete Gunn & Peterson (1965) trough as well as a rapidly evolving neutral fraction indicative of the final stages of reionization (though see Songaila 2004 for a different interpretation). This conclusion is strengthed by analyses of the proximity effects around these quasars (Wyithe & Loeb, 2004a; Mesinger & Haiman, 2004). The second clue is from measurements of the large scale polarization anisotropies of the the cosmic microwave background (CMB), which imply a high optical depth to electron scattering and require reionization to begin at (Kogut et al., 2003; Spergel et al., 2003), albeit with large error bars. A third clue comes from the temperature of the Ly forest at , which is relatively high and indicates that the neutral fraction changed substantially at (Theuns et al., 2002; Hui & Haiman, 2003). However, this constraint is difficult to interpret because helium reionization also heats the IGM (e.g., Sokasian et al. 2002).
Taken together, these constraints imply a complex and extended reionization history, ruling out the simplest models in which the emissivity is a function purely of halo mass and independent of cosmic time (e.g., Barkana & Loeb 2001 and references therein). Within the context of the cold dark matter model, measurements of the matter power spectrum imply that structure formation occurred extremely rapidly at high-redshifts: that is, the fraction of baryons incorporated into star-forming halos at is over three orders of magnitude larger than the fraction at . If the source properties remained constant, this exponential growth of structure would require reionization to be completed within a short time interval. Thus, if reionization is to begin at but end at , the sources themselves must evolve significantly during reionization.
Such evolution could occur naturally through stellar feedback, because the first galaxies form out of metal-free gas and have exceedingly shallow gravitational potential wells. A number of models have been developed to reconcile the disparate inferences about reionization (Wyithe & Loeb, 2003a, b; Cen, 2003a, b; Haiman & Holder, 2003; Sokasian et al., 2004; Fukugita & Kawasaki, 2003; Somerville & Livio, 2003; Onken & Miralda-Escudé, 2004), all incorporating some sort of feedback mechanism to decrease the ionizing efficiency of the sources. The resulting ionization histories display a wide range of features and can extend over long redshift intervals. One of the more intriguing possibilities is so-called double reionization. We will use this term to designate histories in which the global ionized fraction decreases with cosmic time over some interval. Such models provide the clearest signatures of feedback and should be the easiest to observe with future 21 cm tomography measurements (Furlanetto et al., 2004c). They can be contrasted with “stalling” models in which increases monotonically but the feedback mechanism still shapes the overall evolution.
In this paper, we will critically examine the plausibility of the physical processes that may lead to double reionization. Existing models attribute double reionization to three different feedback mechanisms. The first is the transition from metal-free Population III (hereafter Pop III) star formation to “normal” Population II (hereafter Pop II) star formation as observed in the local universe. If Pop III stars are massive, they can produce approximately an order of magnitude more ionizing photons per baryon than do normal stars (Bromm et al., 2001b). The first stars therefore efficiently ionized the IGM; however, as Pop III stars died and exploded, they expelled metals and enriched the IGM. Once star-forming regions reached a typical metallicity of , the excess cooling provided by the metals could reduce the Jeans mass and switch the star-formation mode from Pop III to Pop II (Bromm et al., 2001a; Bromm & Loeb, 2003), thus lowering the ionizing efficiency. Under some circumstances, Pop II stars could no longer counteract recombinations and so would decrease. Unfortunately, existing models have treated this transition crudely. Both Cen (2003a) and Wyithe & Loeb (2003a) assigned a single, universal redshift at which star formation switches between the two modes; the redshift was taken to be the time when the mean metallicity of the universe passed the above threshold. Both found that double reionization occurred for a range of input parameters. However, different regions of the universe are expected to reach the same evolutionary stage of structure formation at different cosmic times due to modulation by inhomogeneities on large scales; this cosmic variance is particularly large at high redshifts (Barkana & Loeb, 2004). Haiman & Holder (2003) pointed out that if the Pop III/Pop II transition is spread over a similarly long time interval, double reionization no longer occurs. However, they did not calculate the plausible duration of the transition, and they conflated the metallicity transition with a change in the mass threshold of galaxy halos for star formation. In §2, we will explicitly compute when and how rapidly the Pop III/Pop II transition occurs using a physical model for enrichment by galactic winds. Like Scannapieco et al. (2003), we find that the transition must occur over an extended redshift interval. In such a scenario, double reionization requires a number of unlikely assumptions.
A second feedback mechanism is photoheating. Reionization raises the IGM temperature from to , increasing the ambient pressure and hence the cosmological Jeans mass (Rees, 1986; Efstathiou, 1992). As a result, low-mass halos can no longer collapse in ionized regions and the star formation rate may decrease sharply. The degree of suppression is not clear. Early work suggested that this mechanism prevents halos with circular velocities – from forming (Thoul & Weinberg, 1996; Kitayama & Ikeuchi, 2000). However, Dijkstra et al. (2004a) showed that the suppression is considerably weaker near the time of reionization, because in that case many halos have already begun to collapse and their high densities shield them from the ionizing background. At the same time, existing halos with virial temperatures will photo-evaporate as they absorb ionizing photons (Barkana & Loeb, 1999; Shapiro et al., 2004). The net effect is that, as reionization proceeds, the mass threshold for galaxy formation increases by some (uncertain) amount and reionization slows down. Again, in such a situation it is possible for the ionizing sources to “overshoot” and for recombinations to dominate for a time. This mechanism has been included in most existing models and rarely been found to produce double reionization. Nevertheless, there has been no systematic study of the requirements for such a phase. In §3, we show that photoheating can in principle cause double reionization, but only in exceptionally optimistic circumstances.
A third and final feedback mechanism is the photo-dissociation of H2. Rotational transitions of H2 provide a cooling channel that operates in halos with (Haiman et al., 1996; Tegmark et al., 1997), well below the threshold at which atomic cooling becomes efficient. The first halos to form stars in any hierarchical model have small masses and therefore rely on H2 for their cooling (Abel et al., 2002; Bromm et al., 2002). However, H2 is fragile and is easily dissociated by soft UV photons in the Lyman-Werner band (–) (Haiman et al., 1997). Once the first stars build up a sufficient UV background, this cooling channel terminates and the minimum halo mass to form stars increases; operationally this mechanism is similar to photoheating although it operates at a lower halo mass scale. We will consider whether this scenario can lead to double reionization in §4.
Of course, by suppressing the ionizing efficiency in biased regions these feedback mechanisms affect not only the global reionization history but also its topology. As recently stressed by Furlanetto et al. (2004b, hereafter FZH04), the topology of reionization is observable through 21 cm tomography (see also Furlanetto et al. 2004c) and through Ly absorption (Furlanetto et al., 2004a; Wyithe & Loeb, 2004b). Although a much more difficult problem to approach analytically than the global evolution, it is also worth considering what signatures one might expect to see in the bubble size distribution from these feedback mechanisms. We briefly consider this question in §5 and then discuss other consequences of our results in §6.
Throughout our discussion we assume a cosmology with , , , (with ), , and , consistent with the most recent measurements (Spergel et al., 2003). We will use comoving units unless otherwise specified.
2. A Metallicity Transition
As noted above, existing models attributing double reionization to the evolving cosmic metallicity rely on an instantaneous transition between the two modes. In reality, there are two mechanisms that will slow it down: the formation of stars in pre-enriched halos (even early on) and the finite velocity of winds. Here we will examine these two processes in turn and apply them to the reionization history.
2.1. The Formation Rate of New Halos
We divide newly-collapsed gas (i.e., baryons that have just been incorporated into galaxies able to form stars) into two components. First, some fraction of the gas accretes onto existing halos that have already formed stars. Provided that an existing halo had already enriched itself beyond the threshold metallicity to form Pop II stars, this component of newly collapsing gas cannot make Pop III stars. The metallicity threshold is (Bromm et al., 2001a; Bromm & Loeb, 2003), which requires , where is the star formation efficiency and is the fraction of the stellar mass converted into heavy elements. Heger & Woosley (2002) find for stars which undergo pair-instability supernovae, although not all massive stars actually explode so this is only an upper limit to the true value. The fraction is somewhat smaller (but still ) for normal initial mass functions (IMFs). The metallicity threshold for Pop II star formation is sufficiently small that we expect any halo that has previously form stars to make only Pop II stars after the initial starburst, unless the metals remain highly clumped in the halo. Because clumping would only slow down the transition between the two star formation modes, we will conservatively ignore it.
To form Pop III stars, gas must therefore collapse into a “new” or “fresh” halo that is forming stars for the first time. We take this criterion to be a minimum galaxy mass determined by the physics of radiative cooling. We will typically assume corresponds to , the threshold temperature above which atomic hydrogen cooling is effective (e.g., Barkana & Loeb 2001). Thus, to find the maximal rate at which Pop III stars can form, we wish to know the rate at which halos of mass form.
Unfortunately, as described in the Appendix, computing this rate is beyond the capability of existing semi-analytic models. We therefore make a simple estimate (Sasaki, 1994; Verde et al., 2001). Given the Press & Schechter (1974) mass function, we can compute the total rate of change of the halo mass function:
| (1) |
where , is the critical density for collapse, and is the variance of the density field smoothed on the mass scale . This total rate of change is the difference between the creation and destruction rates of halos. The two terms in the derivative can be conveniently (if only approximately) identified as these two rates. For rare, massive halos (with ), the creation term should dominate because there are only a small number of larger objects into which the halo can be absorbed. The creation rate should therefore increase with increasing . Halos with , on the other hand, are already common. As the nonlinear mass scale rises, these small halos must accrete onto more massive objects. Thus we expect the destruction term to increase with decreasing . The two terms in equation (1) have the correct limiting behavior, although of course the split does not capture all of the physics, particularly when . The rate at which genuinely new halos form is approximately
| (2) |
where is the mean cosmic density.
The top panel of Figure 1 shows the evolution of relative to the total rate of collapse , where
| (3) |
is the fraction of matter bound to halos with and . We require that ; the approximations in equation (2) violate this requirement at sufficiently high redshifts. The solid line associates with a virial temperature . The dotted and dashed lines assume values of an order of magnitude larger and smaller than this value, respectively. The figure reveals two important points. First, evolves slowly with redshift. It does not approach zero until , by which point reionization is complete. This is because is either larger than or close to the nonlinear mass scale at these early redshifts, so pristine galaxies are still forming. In fact, the magnitude of actually increases with cosmic time; its relative importance decreases only because the number of halos larger than the threshold increases even more rapidly (as they correspond to a higher value of ), and each of these objects continues to accrete mass. Second, the fraction of mass entering new objects increases with increasing because such objects become rarer and it takes the nonlinear mass scale longer to reach a larger threshold. On the other hand, decreases somewhat more rapidly in this case.
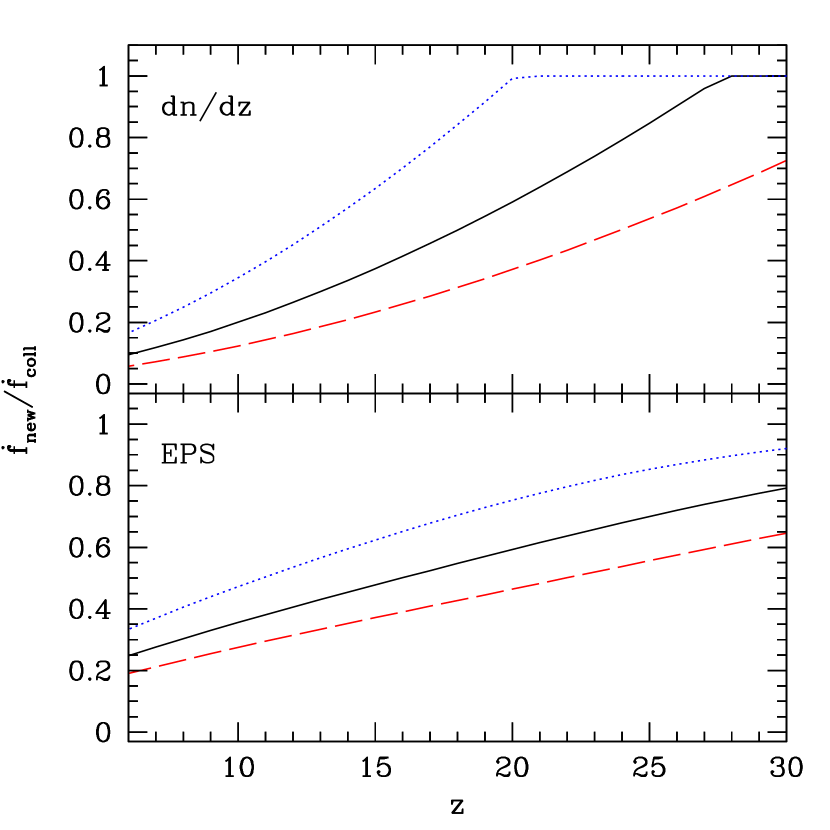
Because equation (2) is only approximate, we describe an analogous calculation with the extended Press-Schechter formalism (Bond et al., 1991; Lacey & Cole, 1993) in the Appendix. We show the results in the bottom panel of Figure 1: in this calculation the transition between the two modes is even slower (see also Scannapieco et al. 2003). Thus a slow transition seems inevitable, and we will clearly require winds to introduce sharp features in the reionization history.
2.2. Wind Model
Galactic winds are the most likely agent for spreading metals through the IGM (e.g., Aguirre et al. 2001; Madau et al. 2001; Scannapieco et al. 2002; Furlanetto & Loeb 2003) and for accelerating the Pop III/Pop II transition. In this section we will outline a model describing them. In order to keep our methods as straightforward as possible, we will examine a simple model for the wind expansion that captures the expected scaling laws and calibrate it against more advanced treatments.
The key input is the underlying energy budget of the winds. The available energy from supernovae is , where is the star formation efficiency (which may depend on halo mass), ergs is the energy per supernova, is the mass in stars per supernova event, and is the baryonic halo mass. We fix and here for simplicity. For Pop II stars, we take and , in accord with a Scalo (1998) IMF for stellar masses in the range –. For Pop III stars, we take and , assuming that most of the stellar mass undergoes pair-instability supernovae and maximizing enrichment from the first generation (Heger & Woosley, 2002).
The simplest possible wind model assumes an energy-conserving point explosion in a constant density medium. This well-known Sedov (1959) solution predicts that , where is the radius, is the density, and is the elapsed time. Although this solution neglects a number of important processes (see §2.2.1), Furlanetto & Loeb (2003) showed that the scaling remains approximately correct, although the normalization does change significantly. Then we can express , the ratio of total mass enriched by the wind to the mass of each galaxy, as
| (4) |
where is a normalization constant that accounts for the many factors we have neglected (note that it could also include variations in ).111In the following, we actually use to include self-enrichment of the galaxy. We have assumed that (i.e., each wind has propagated for half of the age of the universe). Comparing to the results of Furlanetto & Loeb (2003), this solution yields radii 2–3 times too large, depending on the mass and redshift, suggesting that typical wind models have –, where accounts for radiative losses. Of all possible cooling mechanisms, we include only Compton cooling by setting , where is the Compton cooling time and . We ignore other possibilities (most importantly those in the dense interstellar medium of the host) in order to maximize enrichment.
Note that the two stellar populations have different efficiencies . In evaluating equation (4) for a particular galaxy, we assume that the fraction of Pop III stars is , where is the total mass fraction in Pop III stars integrated over time. This does slightly underestimate the effects of Pop III stars because smaller halos have more Pop III stars and are more efficient polluters. However, a more detailed treatment would require fully self-consistent merger rates, which are currently unavailable.
2.2.1 Caveats
Our simple model neglects a number of important effects, which we list here for completeness. We emphasize that Furlanetto & Loeb (2003) included all of these and showed that they do not affect the scaling. The first is radiative cooling, which we have already discussed. Second, the Sedov solution neglects the gravitational potential of the host halo. At large masses, gravity tends to flatten the mass dependence (Furlanetto & Loeb, 2003); however, such halos are rare at these high redshifts. A third difficulty is in the choice of elapsed time, because halos have a range of star formation histories. Crudely, we would expect more massive halos to be older, which steepens the mass dependence. On the other hand, the Sedov scaling also neglects the evolving background density (and the halo density profile). Older halos spend more time expanding into dense environments, which flattens the mass dependence. Finally, we ignored the fact that the wind travels through an expanding medium, so that it need not accelerate swept up material from rest.
Furlanetto & Loeb (2001) noted that we can set an upper limit to the wind size by balancing the energy input with the energy required to accelerate the enclosed baryons to the Hubble velocity at the outer edge of the wind. This procedure yields with exactly the same scalings as in equation (4). Thus the above estimate is reasonable; it is significantly smaller than the maximal limit because the winds have not completed their expansion.
2.3. The Enrichment History
We now wish to compute the probability that a collapsing halo (with ) forms in a region already enriched by galactic winds. As a first step, given the enrichment efficiency , we can estimate the fraction of space with metals:
| (5) |
This equation would be accurate if the galactic winds did not overlap or if their volumes were additive (as is the case with H II regions, which occupy a net volume dictated by the total number of ionizing photons). Because winds expand at much less than the speed of light, the latter is not a good approximation. If the host galaxies were randomly distributed, then the true filling factor would be .
However, rather than the simple volume fraction of enriched material, we actually wish to compute the probability that a new halo forms in an enriched region . Collapsing halos are biased and therefore lie near existing halos (and their winds). We will now estimate the importance of this effect. We first define to be the average wind size (in comoving units). The excess probability that two galaxies sit near each other is parameterized by the correlation function , which to linear order can be written as , where and are the halo biases (Mo & White, 1996) and is the dark matter correlation function. For simplicity, we will use the linear power spectrum for the latter, with the transfer function of Eisenstein & Hu (1998).
The probability that a newly-forming halo lies within of an existing galaxy is then approximately
| (6) |
where is the mean bias of a wind, and is the bias of a newly-formed halo.222Taking the average over the wind volume does not significantly affect our results. The mean bias of the enriched regions is:
| (7) |
where the extra factor of enters because we compute the bias of the enriched volumes rather than the bias of halos. The bias of newly-formed galaxies is because all such objects have mass close to the low-mass threshold for star formation. Finally, we assume randomly distributed wind hosts by setting the enrichment probability .
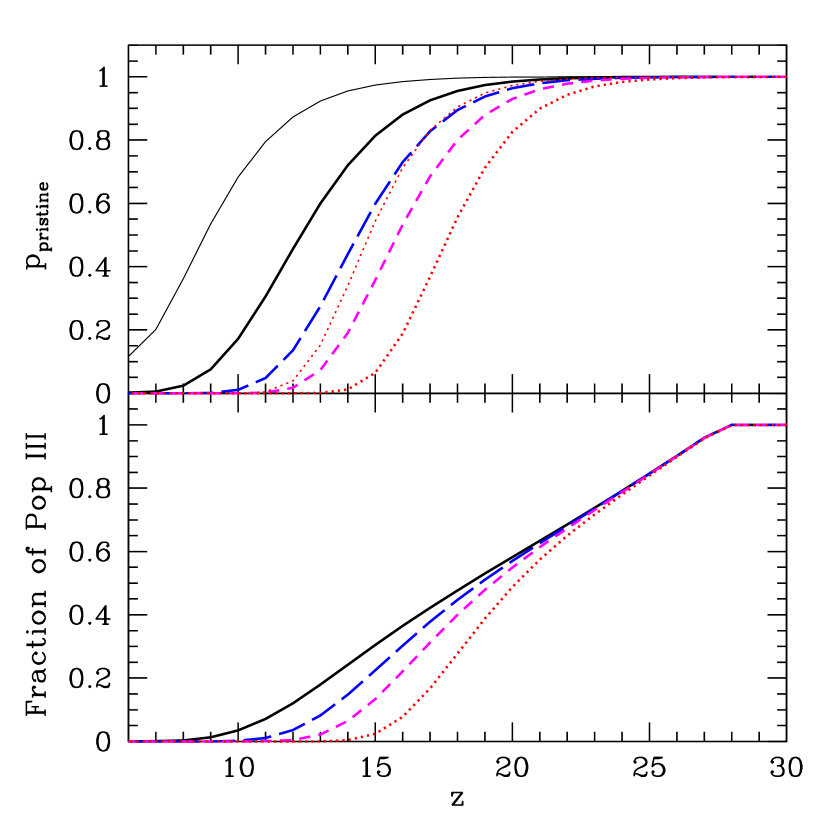
Figure 2 shows the resulting enrichment histories. We take ; the different curves take different wind efficiency parameters . The thick curves in the top panel show , the probability that a new halo forms Pop III stars. The time at which Pop III stars disappear obviously depends strongly on the wind efficiency parameter. For realistic choices (), pristine halos become rare at . The thin curves (shown only in the and 1 cases) illustrate the behavior if we neglect clustering: because galaxies are so highly biased at these large redshifts, clustering makes enrichment of galaxies much easier. It completes when only about half of the total volume has been injected with metals. The bottom panel shows the the total fraction of collapsing gas able to form Pop III stars, . Although evolves fairly rapidly, including the fraction of gas that accretes onto existing halos significantly moderates the rate of decline. In this model, the evolution of dominates the Pop III/Pop II transition until relatively late, regardless of .
2.3.1 Caveats
We now outline and justify the simplifications that led to equation (6). The most serious shortcoming is our treatment of wind overlap. We have made no attempt to follow the dynamics of colliding winds. However, since the wind volume scales with the deposited energy more slowly than linearly, combining their energies through overlap will only reduce the total enriched volume relative to a case without overlap. Thus the net effect of overlap is to slow the transition from Pop III to Pop II and therefore strengthen our conclusions in §2.4. Second, we have assumed that galaxy formation in the wind-enriched regions can be well-described by dark matter dynamics. This may not be a good assumption if the winds disturb a large fraction of the IGM by, for example, sweeping it into a shell, stripping nearby halos as they collapse, or triggering star formation behind the termination shock (Scannapieco et al., 2001; Cen, 2003c). If the feedback is positive, double reionization would become even more difficult, but if the winds suppress galaxy formation the prospects for double reionization would be enhanced. (That case would be qualitatively similar to photoheating, except that the feedback would operate much more slowly.)
There is also a set of issues related to our simplified global treatment of enrichment. Equation (6) only includes linear halo bias, and we only use the linear . The latter is probably not a bad approximation, because small-scale nonlinearities are primarily due to the density profiles of individual halos (e.g., the halo model; Cooray & Sheth 2002). In our case, all the baryons inside each halo likely collect into a single galaxy, in which case the one-halo nonlinearities are not relevant. Scannapieco et al. (2003) constructed a more detailed enrichment model that included nonlinear bias. They used the two-point halo mass function (Scannapieco & Barkana, 2002) to compute the probability that a halo lies within the winds of its neighbors. Our extended enrichment histories are qualitatively consistent with theirs, so the nonlinear corrections included by this formalism do not seem to affect our conclusions. Another crucial simplification is that we have taken the wind sources to be randomly distributed. In reality, the bias of the wind hosts will increase the amount of overlap, decrease , and extend the transition; in this sense our conclusions about double reionization are conservative. All of these issues are best addressed with numerical simulations, which we forego in order to keep our models as simple as possible.
2.4. The Reionization History
We are now in a position to determine how enrichment, and the accompanying transition from Pop III to Pop II star formation, affects reionization. The rates at which Pop III and Pop II stars form are
| (8) |
and
| (9) |
To translate these into production rates of ionizing photons, we define as the number of ionizing photons produced per collapsed baryon for Pop (where II or III), e.g. , with the fraction of ionizing photons able to escape the host halo, the number of ionizing photons produced per baryon incorporated into stars, and a correction for helium. We will fix (appropriate for a Salpeter IMF) and (appropriate for very massive stars; Bromm et al. 2001b). Note that affects both and , while and act as separate efficiency parameters for the two mechanisms. At least crudely, these are the source parameters that we can tune in order to test the plausibility of double reionization.
The number of ionizing photons emitted per baryon per unit redshift is then
| (10) |
and the global ionized fraction evolves according to (Shapiro & Giroux, 1987; Barkana & Loeb, 2001)
| (11) |
where is the case-B recombination coefficient, is the comoving electron density in a fully ionized medium, and is the density clumping factor within ionized regions. The first term is the rate at which stars produce ionizing photons, while the second is the rate at which protons and electrons recombine. We treat as a constant; a better model would include the evolving density distribution of ionized gas in the IGM. Miralda-Escudé et al. (2000) have developed such a model calibrated to numerical simulations. They argue that low-density regions, where the recombination rate is small, will be ionized first. As the ionized volume increases, the ionizing background can keep progressively denser regions ionized. They showed that while increases throughout reionization, it does so only modestly until , because nearly all of the volume is near the mean density at the high redshifts of interest. Since we are primarily interested in the middle phases of reionization, the assumption of a constant is reasonable for most of reionization unless there is considerably more small-scale structure than the simulations of Miralda-Escudé et al. (2000) found (e.g., Haiman et al. 2001). However, it will underestimate the recombination rate at the end of reionization. (Note also that with a constant we must explicitly force .)
Figure 3 plots the reionization history in two sets of models. The top panels show the evolution of and the bottom panels show . We vary the wind efficiency from to in each panel. In all cases, we assume as in Figure 2; because these quantities affect both enrichment and reionization they have little effect on our conclusions. Panels (a) and (c) show a baseline case in which . The difference in emissivity between the two generations is then determined purely through the stellar physics encapsulated by . In panels (b) and (d), we set in order to exaggerate the difference between the generations (although there is some motivation for a high escape fraction from the first generation of sources; Whalen et al. 2004). In panel (c), we assume that , as is appropriate for the bulk of the IGM according to Miralda-Escudé et al. (2000). In panel (d), however, we assume .
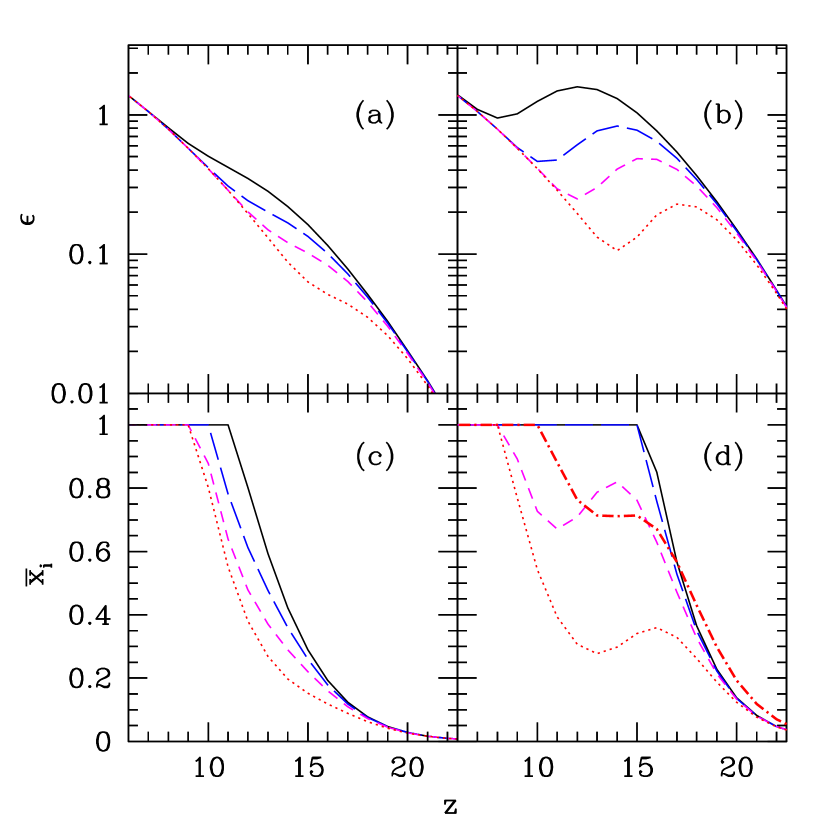
According to panel (a), the difference in between Pop II and Pop III is clearly insufficient for double reionization: the slow evolution in smooths out the expected discontinuity. Not surprisingly, is therefore monotonic regardless of the wind efficiency. Interestingly, this is true even though we have “tuned” the parameters so as to force complete enrichment and reionization to occur at approximately the same epoch. Thus, to introduce features into we must exaggerate the contrast between the generations, as in panels (b) and (d). By manipulating the escape fractions, we cause a clear drop in the emissivity during the Pop III/Pop II transition. However, even in this case we still only force double reionization if the winds are powerful and clumping is strong. We remind the reader that even with , the wind enrichment models of Furlanetto & Loeb (2003) had , so we regard larger values as implausible. Double reionization is difficult because maintaining full ionization requires only that the production rate of ionizing photons exceeds the rate at which hydrogen atoms recombine (i.e., the right-hand side of equation (11) must be positive). Thus will only decrease with time if
| (12) |
The marked decrease for the solid and long-dashed curves is large in relative terms but still leaves the absolute emissivity strong enough to cancel recombinations. This illustrates an obvious feature of these models: if reionization completes well before enrichment, the emissivity will have risen sufficiently between these two epochs so that, even after a sharp fall in , the universe remains completely ionized. If we accelerate enrichment through more powerful winds (the short-dashed and dotted curves), does fall below the threshold of equation (12), and a brief epoch of recombination can ensue. However, this is only true if is larger than unity. The dot-dashed curve shows for the same model as the dotted curve (i.e., maximal winds) but with . In this case, flattens but does not decline significantly.
We have explored a range of parameter choices and found that double reionization can in principle be achieved, but only in rather extreme models. In order for the emissivity evolution to have a strong feature, we require (and in particular much larger than the expected difference in ). Second, enrichment must be timed to occur during or soon after reionization, so that the emissivity has not risen too far before enrichment is complete. Third, the magnitude of the emissivity after the Pop III/Pop II transition must satisfy equation (12). This is easiest to achieve by boosting the IGM clumping factor, because that accelerates recombinations and gives the emissivity less time to recover. We find that double reionization only occurs in parts of the IGM with . Because such regions fill only a small fraction of the volume in standard models (e.g., Miralda-Escudé et al. 2000), a recombination phase is strongly disfavored.
2.4.1 Quasars and a Variable
There is some evidence that in local galaxies with velocity dispersions (Dekel & Woo, 2003; Kauffmann et al., 2003); above this threshold the star formation efficiency remains constant. How would such behavior in high-redshift galaxies affect our conclusions? We let and assume for all masses. (Massive halos with are so rare at high redshifts that they have a negligible effect on our results.) Note that the Pop III star formation efficiency is a constant because such stars form only in halos with . We can repeat our reionization calculations using this prescription; the only adjustment is that we must modify equation (10) to account for the increasing as galaxies grow (e.g., Wyithe & Loeb 2003a). For a fixed energy input, the models tend to have somewhat slower enrichment because is suppressed in the (abundant) low-mass halos in which winds are most efficient (eq. [4]). It is also somewhat harder to achieve a sharp drop in the emissivity because the typical galaxy mass increases with cosmic time (and hence so does the mean ). However, the law has no real effect on our conclusions regarding double reionization: our direct calculations for the case of imply that the same fairly extreme conditions outlined above must be fulfilled. Thus, for the sake of brevity, we have chosen not to show any explicit results for these models.
We note here one interesting result of our models: if , early reionization at requires the Pop III star formation efficiency to be much larger than the Pop II efficiency in halos of a comparable mass. The reason is simply that Pop III stars must form in pristine halos with , where . The number of Pop III stars would therefore also be extremely small, unless . Previous studies, such as Wyithe & Loeb (2003a), had found such early reionization to be possible because they allowed more massive halos (where the star formation efficiency is large) to form Pop III stars even though such galaxies would have been self-enriched. Thus, if observations continue to favor early reionization, it appears the star formation efficiency must scale differently with mass than in nearby galaxies, at least for one of the two star formation modes.
Similar models could also describe the input of black holes, which may generate powerful winds (see Furlanetto & Loeb 2001 and references therein). Wyithe & Loeb (2003c) find a good fit to the quasar luminosity function over the range – by assuming that . We can estimate how quasars affect double reionization by assuming that this relation extends to the higher redshifts and lower masses of interest. We will also assume that a quasar radiates a fraction of its rest mass and that a fraction powers the wind. So long as constant, quasars make only a small difference to the results if because black holes can be ignored in the small halos responsible for most of the enrichment and ionizing photons. On the other hand, if , quasars can become significant in small halos. For example, the ratio of wind input energies is
| (13) |
Quasars can be inserted directly into our models without modification; clearly they will not alter the likelihood of double reionization, although they could alleviate the problem mentioned in the previous paragraph (but see Dijkstra et al. 2004b).
3. Photoionization Heating
The second type of feedback is radiative, for which the most important example is photoionization heating. As described in §1, this raises the Jeans mass in ionized regions by an uncertain amount and suppresses accretion onto existing small halos. Our primary interest is in whether this feedback mechanism can cause double reionization; we will therefore take a phenomenological approach and leave the minimum galaxy mass in heated regions as a free parameter. Because the physics depends on the depth of the potential well, we will phrase the threshold in terms of a (redshift-independent) virial temperature . We will also let ; the h and c subscripts refer to hot and cold gas, respectively. We will take as a fiducial value, corresponding to . Once a region is ionized, it will begin to cool adiabatically (and radiatively if it recombines). This will soften the increase in the time-averaged Jeans mass (or “filter mass”; Gnedin & Hui 1998). Cen (2003a) has included these effects more precisely through a “phase-space” description. By ignoring this possibility, we will maximize the possibilities for double reionization.
A number of authors have already included photoionization heating in models of reionization (e.g., Wyithe & Loeb 2003a; Cen 2003a; Somerville & Livio 2003; Onken & Miralda-Escudé 2004). In this case the emissivity has two terms:
| (14) |
where is the filling factor of regions that have been heated, , and . We take the derivative of the mass-averaged ionizing rate for each component, and , rather than of the simple collapse fractions to include the possibility that the star formation efficiency is a function of halo mass. (The functional dependence of qualitatively affects the results for photoionization heating, unlike in the metal enrichment scenario.) We may then insert this emissivity into equation (11) and solve for . Note that we assume both kinds of sources to have the same .
However, to do so we must specify how evolves. The simplest assumption, and one often used in the literature, is to set : the fraction of gas that has been heated is the same as the ionized fraction. If this prescription is accurate, double reionization from radiative feedback is impossible even in principle, because regulates the feedback and there is no possibility of “overshoot.” However, we must actually have because some photons are lost to recombinations. For example, suppose , so that the emissivity in hot regions is negligible. The first halos (with ) collapse and ionize their surroundings; structure formation effectively stops in these ionized bubbles. However, small halos can continue to form in the neutral gas outside these bubbles. Thus ionizing photons will preferentially appear in cold regions while recombinations will only occur in hot regions. The filling factor of hot gas must therefore evolve faster than . The extreme limit would be to calculate without including any recombinations,
| (15) |
Of course, reality lies somewhere between these two extremes: some fraction of the ionizing photons are produced in pre-ionized regions and counteract recombinations before ionizing new material, while recombinations also occur in the newly-formed ionized bubbles. The complexity of radiative transfer and feedback makes a self-consistent choice difficult and is probably best addressed with simulations. We choose equation (15) in order to maximize the possibilities for double reionization; even in this extreme case we will find double reionization to be quite difficult.
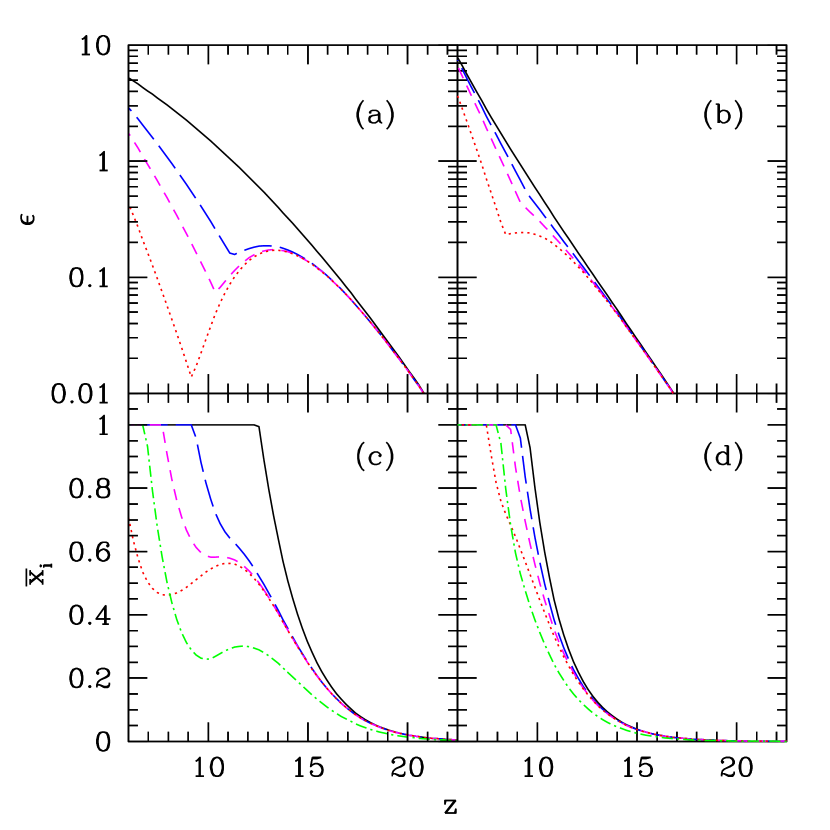
Figures 4a and c show reionization histories for a set of models with and constant (note that we only consider a single stellar population here). The solid, long-dashed, short-dashed, and dotted curves have , and , respectively, with . The dot-dashed curve has and . In this case, the emissivity is the same as for the short-dashed curve. The solid curve shows the ionization history without photoheating; it rises steeply, completing reionization in a relatively short time period. An increase in introduces a stronger break into the emissivity. As long as , small halos dominate the ionizing photon budget and the evolution is nearly independent of . Once becomes large, and determines the amplitude as well as the duration of the break. Note that the redshift at which corresponds to the minimum in . Unlike in the metal enrichment case, this must occur while . Thus, any feature in the ionization history due to photoionization will occur before reionization is complete.
For this reason, a sharp drop in the emissivity is more difficult to achieve, because (or in our model the closely related quantity ) regulates the emissivity and causes it to flatten substantially before it can drop. Equation (12) again expresses the criterion for double reionization: the emissivity must fall below the recombination rate. Not surprisingly, it therefore requires either extremely large suppression () or substantial clumping. Our fiducial choice is just on the threshold for achieving double reionization if .
Figures 4b and d show reionization histories for models with and (evaluated at the fiducial ). In this case the behavior is obviously quite different, with remaining monotonic in all cases. Even for the most extreme choice of , exhibits only a slight turnover. Extended reionization histories are more difficult to achieve because the star formation efficiency in low-mass halos is small, making their contribution to the global emissivity low and their suppression much less significant. The decline in emissivity is much less severe in this case, and double reionization requires truly extreme parameters. This also implies that if quasars are important in reionization and , they will tend to wash out double reionization because massive halos contribute a large fraction of the ionizations.
We have not included halo bias in the feedback treatment in this section. This is unlikely to affect our final results for two reasons. First, the bias should be less important than for metal enrichment, because overlapping H II regions grow quite large even during the middle stages of reionization (FZH04), spanning several comoving Mpc when . On these scales is small and the ionized regions are probably close to a fair sample of the universe. Because of this overlap, it is also extremely difficult to calculate the relevant scale from first principles (see §5 for a first look at the issues involved). The second reason is that photoheating guarantees that bias will modulate ionizations and feedback in the same way. In other words, if halos are overabundant in ionized regions, the emissivity will begin to decline at a smaller . But both the heating and ionizing rates will decline together, so the net effect will simply be for feedback to flatten the emissivity sooner. The bias will not be completely degenerate if we use equation (15) but is still not likely to have a strong effect because that scenario essentially assumes that all ionizing photons come from widely separated (and hence unbiased) sources. In any case, a full treatment of the interplay between bias and feedback will have to await self-consistent numerical simulations.
In summary, photoheating can in principle cause double reionization, but only under the following restricted conditions: (i) the suppression of structure formation is more severe than current estimates () and/or the universe is clumpy, (ii) star formation is efficient in small halos, and (iii) nearly all ionizing photons go into ionizing new material, rather than counteracting recombinations in ionized regions (so that ). Taken together, we regard these conditions as implausible, and conclude that double reionization is unlikely to occur through photoheating.
4. Photodissociation of H2
For completeness, we now examine another radiative feedback mechanism. As described briefly in §1, gas in the first collapsed halos cools through rotational transitions of H2 (Haiman et al., 1996; Tegmark et al., 1997), which operate for . However, such molecules are fragile and a weak soft UV background of suffices to dissociate them, where (Haiman et al., 2000; Machacek et al., 2001). Crucially, any photon with energy above 11.26 eV can dissociate H2, so (unlike in the case of ionizing photons) any individual halo sees Lyman-Werner sources out to cosmological distances (Haiman et al., 1997). The UV background redward of the Lyman limit builds up quickly as stars form, suppressing cooling via H2 and increasing the minimum halo mass for star formation from to the atomic cooling threshold of .
Because the effects of H2 photodissociation can be phrased in a similar way to photoheating (except that the “heated” volume is automatically larger than the ionized volume), we can again find scenarios in which decreases with cosmic time, as long as the clumping factor is substantial and . However, it is easy to show that this phase occurs early in the reionization process, because the photodissociation threshold must be reached well before reionization is completed (Haiman et al., 2000). We wish to estimate in the Lyman-Werner bands; neglecting the line opacity of the IGM, we have
| (16) |
where is the emissivity per unit frequency, , and the last factor accounts for the cosmological redshifting of the photon energy. The upper limit enters because ionizing photons cannot propagate through the neutral IGM. The Lyman series introduces a “sawtooth modulation” of the background (Haiman et al., 1997), but this does not affect our estimate. To connect to the ionized fraction, we write , where is the rate at which ionizing photons are produced per unit volume and is the number of Lyman-Werner photons per frequency decade divided by the number of ionizing photons per frequency decade.333We will assume for concreteness that all of the ionizing photons are contained in the frequency decade closest to the Lyman limit, which is a good approximation for stellar spectra. Even if the ionizing sources have hard spectra similar to quasars, our conclusion would not change. Ciardi & Madau (2003) have evaluated a closely related quantity and found – for typical stellar populations (the only difference is that they calculated the number of continuum photons just shortward of Ly rather than shortward of 11.26 eV). Thus using our earlier definitions, we have
| (17) |
where is the mean baryon density and . Neglecting recombinations, we can then write , so the ionized fraction when we reach the photodissociation threshold is
| (18) |
Even with , , and , the ionized fraction is at most several percent when we reach the photodissociation threshold. This estimate agrees with the detailed models of Haiman et al. (2000) (their Figure 7). Thus although this mechanism can cause to turn over, it can only do so near the beginning of reionization and the amplitude of the change will be small.
Finally, we note that in reality the chemistry of H2 is sufficiently complicated that the detailed consequences of radiative feedback remain unclear. Initially it was thought that X-rays could catalyze its formation by increasing the free electron fraction (Haiman et al., 2000); however, Oh & Haiman (2003) showed that the heating that inevitably accompanies X-rays impedes collapse, ensuring a net suppression. Others have argued for more complicated positive feedback mechanisms near H II regions (Ricotti et al., 2002; Cen, 2003a). We will ignore all of these possibilities simply because positive feedback obviously cannot cause double reionization. Moreover, the “self-regulation” process will not necessarily completely halt the formation of low-mass halos. If small halos are responsible for the background, they will reach an equilibrium in which the UV background prevents the smallest halos from forming stars but allows more massive and better shielded halos to cool. Again, such a scenario tends to wash out double reionization.
5. The Topology of H II Regions
One promising observable of the reionization process is the size distribution of H II regions and its evolution with time (FZH04; Wyithe & Loeb 2004c), which can be probed through 21 cm tomography (Furlanetto et al., 2004c) or through Ly absorption (Furlanetto et al., 2004a; Wyithe & Loeb, 2004b). By modulating the ionizing efficiency through local feedback mechanisms, the schemes we have described can in principle have substantial effects on the size distribution of ionized bubbles. Here we will briefly discuss those consequences. Furlanetto et al. (2004c) made some progress in this direction by considering simple scenarios with multiple generations of sources. We will improve on that treatment by examining the transition between star formation modes in more detail.
We take the model of FZH04 as a starting point. We assume as above that the number of ionizing photons produced in a region is proportional to the collapse fraction within the region. We denote the proportionality constant by . Note that this differs from the definition in §2.4 in two ways: it is cumulative over the integrated star formation history and it includes a correction for past recombinations. A region can ionize itself if . FZH04 showed how to transform this simple condition into a size distribution by including the implicit scale dependence of and ionizations from neighboring regions. We rewrite the ionization constraint as a condition on the density,
| (19) |
where . Equation (19) is then used as an absorbing barrier within the excursion set formalism (Bond et al., 1991; Lacey & Cole, 1993) to construct the mass function of ionized bubbles. The crucial point is that the shape of the barrier determines the distribution of bubble sizes. The above barrier is nearly linear in , which implies (Sheth, 1998) a well-defined characteristic size for the H II regions. Thus, the shape of the barrier is fixed by the condition constant, while the normalization is fixed by the ionizing efficiency.
We may now incorporate feedback by considering two sets of sources with different ionizing efficiencies and/or different galaxy mass thresholds. In the latter case (i.e., photoionization heating), the qualitative effects are easy to guess. A high-density region forms halos with which ionize the neighborhood. Without feedback, the associated bubble would grow through two processes: (i) it would merge with other H II regions, and (ii) halos inside it would continue to accrete rapidly, producing more ionizing photons. However, if , structure formation is suppressed in this region, the “internal” ionizations diminish, and the bubble can grow only by merging with its neighbors. Thus we would expect H II regions to be smaller and more numerous, because those around high-density regions grow more slowly and force voids to be ionized by the relatively rare galaxies embedded inside. At the same time, the high-density dormant regions begin to recombine. Furlanetto et al. (2004c) argued that this process would not stop until the entire universe had been ionized, though not necessarily simultaneously (see §3), so eventually the pattern induced by recombinations (and exaggerated by the time delay between reionization in different regions) would dominate the signal. Unfortunately, because the photoheating depends directly on the ionized fraction, it cannot be incorporated into the FZH04 model.
The FZH04 model can accommodate a transition due to metal enrichment more easily, because the ionizing efficiency does not depend on the local ionized fraction in this case. We will assume that there exists a function characterizing the probability that any source in a region of overdensity contains Pop II stars. Physically plausible models will have , where a prime denotes the derivative with respect to density, because structure formation is more advanced in dense regions. Given the ionizing efficiency of each star formation mode, the condition for self-ionization is
| (20) |
This modified barrier has two effects on the bubble size distribution. Unlike for a single type of ionizing sources, the left-hand side need not be a monotonically increasing function of the overdensity . Its derivative vanishes when
| (21) |
Physically, if and if high-density regions have enriched themselves, then it is possible for these regions to remain neutral even though regions with slightly smaller densities (and thus incomplete enrichment) can self-ionize. Obviously the increased recombination rate in dense regions will amplify this trend.
As an example, we consider the choice , which essentially reflects the wind model from §2 (ignoring ). Here the enrichment probability is a function of density through its dependence on the collapse fraction; the exponential accounts for overlap of bubbles from randomly distributed sources within each region. Equation (21) then implies that the ionizing efficiency turns over at for , and some regions sufficiently far above this threshold could remain neutral.444Note that actually depends on the scale of interest (as could ). We neglect this here, considering only those scales for which . Note that not every region with would be neutral; above this point, the effective decreases with increasing but not necessarily by enough to become neutral. Moreover, a dense region could still be ionized by its neighbors (Barkana & Loeb, 2004). The turnover with density can mimic “outside-in” reionization in which voids are ionized before intergalactic sheets and filaments (where the sources are located). However, for this effect to be significant we must have ; this only occurs when enrichment nears completion. Thus in this simple, wind-driven model we do not expect neutral dense regions to be common during reionization.
Unfortunately, once the ionizing efficiency turns over, the excursion set formalism of FZH04 breaks down. This is because the number of ionizing photons is no longer additive in a simple way, but rather depends on the degree of enrichment of substructure inside the region of interest. However, if remains reasonably small during reionization then the model can still be used. In this limit, we consider how the shape of the barrier – and hence the shape of the bubble size distribution – changes due to the metal enrichment pattern. In standard reionization scenarios, the shape is set by constant (the solution to ). With enrichment, equation (20) shows that the shape is instead set by a condition on a combination of and . Unfortunately, the dependence is weak for reasonable choices of . For example, with the simple wind model examined above, is purely a function of and the shape is still determined by constant; it can be exactly reproduced by choosing an effective to match the total ionized fraction.
Thus, to change the shape, must have a more complicated density dependence. Let us consider the simple parameterization
| (22) |
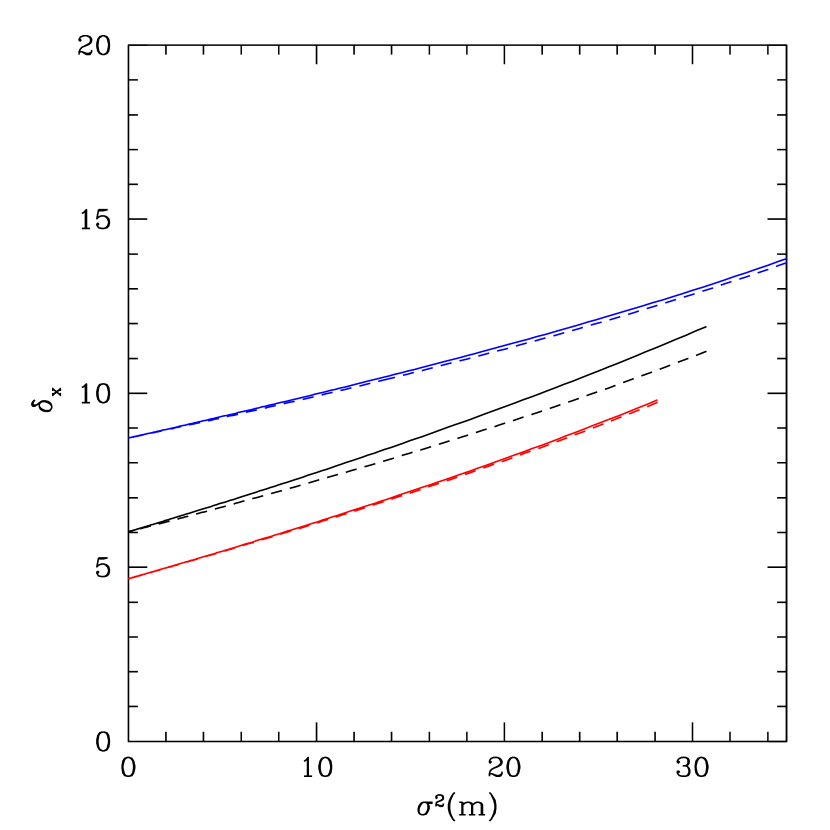
where is some constant that measures the steepness of the density dependence. This form has the limits for and for , and it concentrates enrichment in dense regions more than the simple wind model does. One reason this may happen is that is smaller than the average in dense regions because they are further along in the structure formation process. Qualitatively, we expect the barrier to be somewhat steeper with this prescription, because dense regions have extra enrichment and fewer ionizing photons. The solid curves in Figure 5 show some example barriers. In each case, , , and . We show and , from bottom to top. The dashed curves show the barrier for a single source type with the value at fixed to match the solid curves. These have , and for the three values of . Indeed the barriers are steeper, which implies fewer small bubbles because small, dense clusters are highly enriched. However, we find that the steepening is relatively weak, especially when one of the two star formation modes dominates (i.e, or ). Of course, if enrichment is sufficiently extensive that equation (21) is violated, the barrier approach breaks down and the bubble pattern could change significantly.
We have considered other possible parameterizations of based around the simple wind expression; in the cases we examined, the differences were not much larger than shown in Figure 5. The reason is that is simply used to interpolate between two different populations, each of which would follow the usual barrier. In addition, the interpolation between them also depends on the collapse fraction. Thus it appears difficult to change the shape dramatically, although exotic scenarios in which the collapse fraction played no role could have stronger effects.
6. Discussion
We have examined a variety of feedback mechanisms that could potentially cause “double reionization,” in which the globally-averaged ionized fraction decreases over a limited period of cosmic time. These mechanisms include metal enrichment, photoionization heating, and photodissociation of H2. We constructed simple models that nevertheless retained the crucial physics; as a result we were able to vary a relatively small set of parameters to pin down the requirements for double reionization. In all cases, we found that double reionization requires extreme (though not impossible) parameter choices. In particular, it requires a rapid drop in the ionizing emissivity over a single recombination time (see equation [12]). Because the recombination time varies spatially within the IGM, we found that it is not difficult to imagine relatively dense pockets recombining after feedback becomes strong (which could affect the topology of ionized gas; see §5), but because these occupy only a small fraction of the universe, double reionization is difficult to arrange on large scales.
For metal enrichment, we require three conditions: (i) , (ii) an average clumping factor significantly larger than unity, and (iii) winds that expand much more rapidly than predicted by existing semi-analytic models (Madau et al., 2001; Scannapieco et al., 2002; Furlanetto & Loeb, 2003). We have argued that condition (ii) is implausible for the majority of the IGM (Miralda-Escudé et al., 2000) and that (iii) is similarly implausible, so we regard this mechanism as unlikely to cause double reionization. Existing work predicted double reionization only because of an artificial, instantaneous transition between star-forming modes (Wyithe & Loeb 2003a; Cen 2003a; see also Haiman & Holder 2003). Our models are more similar to Scannapieco et al. (2003), who found a gradual disappearance of Pop III stars. In a hierarchical picture, the decline has two causes: accretion shifts to higher mass, pre-enriched halos even when the global metallicity is small and the slow expansion of galactic winds. The first depends on unknown halo merger rates, but our estimate appears to be conservative.
Double reionization from photoheating is similarly difficult. In this case we require (i) , (ii) small halos (those with ) contribute a large fraction of the ionizing photons, and (iii) new ionizing sources form in regions that have not yet been ionized, so that their photons are not “wasted” on recombinations (because in that case they do not heat the IGM). The second condition implies that the star formation efficiency does not drop too rapidly with decreasing halo mass. In particular, if persists at high redshifts (as has been observed in nearby galaxies; Dekel & Woo 2003; Kauffmann et al. 2003), then small halos do not dominate the ionizing photon budget and double reionization cannot occur. Quasars also help to wash out double reionization if the black hole mass scales steeply with host halo mass, as in Wyithe & Loeb (2003c). We argued that the photoheating occurs more rapidly than ionization, because photons are preferentially emitted in regions that have remained neutral to that point, while recombinations are confined to ionized regions. We made an extreme assumption in order to maximize the likelihood of double reionization; this picture can be tested with self-consistent photoheating feedback in simulations. If is more accurate, double reionization is impossible to achieve through photoheating. Our fiducial choice for the degree of suppression, is on the threshold of double reionization; if photoheating is less efficient at suppressing galaxy formation near the time of reionization (Dijkstra et al., 2004a), then this mechanism also cannot cause double reionization. Note also that, if the first sources produce X-ray photons (e.g., Ricotti et al. 2004; but see Dijkstra et al. 2004b), the IGM will be heated gradually and (nearly) uniformly, again suppressing accretion onto small halos (Oh & Haiman, 2003). This would tend to smooth out the transition from to , decreasing the likelihood of double reionization. Clearly, double reionization through either metal enrichment or photoheating requires the confluence of a number of unlikely possibilities.
Finally, H2 photodissociation has a similar phenomenological effect to photoheating, increasing the minimum mass for star formation (albeit from a much lower base level). However, we showed that the feedback threshold must be reached when the ionized fraction is still small, so the recombination phase (even if it occurred) would be difficult to observe. Haiman et al. (2000) also reached this conclusion through more detailed modeling.
We have not examined any combinations of these different mechanisms. Together they could increase the contrast between the initial and final ionizing efficiency, which would make double reionization somewhat easier to achieve. For example, photoionization heating could extend reionization over a long interval. This would increase the time over which winds can expand and hence move the Pop III/II transition closer to reionization, increasing the effective amount of suppression in ionized regions. Another possibility is that star formation through H2 cooling at extremely high redshifts could begin to spread metals throughout the IGM. Once photodissociation dominates, there would be a long pause until reionization could continue. Again, the winds would have extra time to expand. However, we see no reason for any such scenario to increase qualitatively the likelihood of double reionization.
We have focused here on particular ionization histories in which turns over. We found that such scenarios are difficult to achieve. But we stress that extended reionization is not nearly so difficult; any form of feedback will help to prolong the reionization era and to relieve the apparent tension between the quasar data (Fan et al., 2002; Wyithe & Loeb, 2004a; Mesinger & Haiman, 2004) and the optical depth to electron scattering measured by WMAP (Kogut et al., 2003). Indeed, a number of our models in Figures 3 and 4 show that feedback can significantly extend the era over which . Moreover, we have found that a turnover in the emissivity is also not difficult to achieve; many of our feedback scenarios yield this kind of behavior, at least if low-mass halos have high star formation efficiencies. Unfortunately, the emissivity evolution is harder to measure.
Finally, we must also stress that we have studied double reionization in a global sense. Although we have found that only turns over in exceptional circumstances, the reionization history of any particular region or line of sight need not be monotonic. For example, if photoheating suppression is important, a volume ionized early on will experience a sharp decrease in its emissivity and begin to recombine. Only later will halos grow sufficiently massive to ionize it again. Our models show that, while this region is recombining, others are also being ionized, and the latter generally dominate the global evolution. The most promising way to probe reionization in different physical volumes is 21 cm tomography (Madau et al., 1997; Zaldarriaga et al., 2004; Furlanetto et al., 2004c). We have argued that these feedback mechanisms should induce signatures in the bubble size distribution, although metal enrichment appears to have little effect except in dense, highly-enriched regions. Because of the complexity of this problem, numerical simulations would provide the best method to examine changes in the bubble pattern in greater detail.
Appendix A An Extended Press-Schechter Estimate for the Halo Formation Rate
In §2.1, we estimated in a simple fashion. Here we point out that self-consistent analytic calculations for this quantity do not yet exist. Given the comoving number density of halos per unit mass as a function of redshift, , and the rate at which these halos merge per unit volume, , we can compute the rate at which halos merge to form new objects with masses above . Unfortunately, as recently emphasized by Benson et al. (2004), the merger rates typically used in cosmological studies (Bond et al., 1991; Lacey & Cole, 1993) are not well-defined. The problem is most easily seen by noting that in the extended Press-Schechter (EPS) formalism. The fundamental difficulty is that this formalism does not assign points in space to unique halos: the smoothing procedure implicit in these approaches requires that neighboring points be identified with halos of different masses, even though they must physically be part of the same object. Merger rates, which by definition require uniquely specified halos, are thus ill-defined quantities. As a consequence, merger tree algorithms based on the EPS formalism either do not reproduce the proper mass function or do not conserve mass during the individual time steps, although ad hoc procedures to alleviate these problems have been developed (e.g., Somerville & Kolatt 1999).
Nevertheless, it is useful to compute with the EPS formalism in order to investigate whether the slow evolution in equation (2) is an artifact of our approximation. A comparison to the EPS estimate is motivated by its succes in areas such as semi-analytic galaxy formation (e.g., Kauffmann & White 1993; Cole et al. 1994; Somerville & Kolatt 1999) and modeling the quasar luminosity function (e.g., Wyithe & Loeb 2002).
For a halo of mass at redshift , the EPS formalism provides the fraction of matter that was in objects with masses smaller than at some earlier time (Lacey & Cole, 1993) and hence the fraction of a halo’s mass that was accreted recently:
| (A1) |
The relevant timescale is the dynamical time within a galaxy (which gives approximately the time over which star formation occurs), , where is the critical density, is the Hubble parameter at redshift , and is the virial overdensity (Barkana & Loeb, 2001). If we then assume that accretion onto halos with can be included in the newly-formed halo component, we can estimate the fraction of collapsing gas that accretes directly onto existing halos via
| (A2) |
so that . The denominator is necessary to normalize the total mass accretion rate to its actual value; a direct calculation with the EPS merger rates of the total collapse rate does not reproduce the true . One advantage of this formulation is that it includes the duration over which a new halo must remain isolated (unlike in equation [2]). In other words, a halo that merges into a massive object immediately after passing above will most likely form Pop II, rather than Pop III, stars. We have used the dynamical time to fix . Varying the time offset has only a small effect on the results: increasing or decreasing by a factor of two changes by and leaves the shape unaffected. Another approach is to use the explicit expression for in the EPS formalism to compute directly (but without the time offset). This procedure (with symmetrized EPS merger rates) yields results similar to equation (A2).
The resulting formation rate of new halos is shown in the bottom panel of Figure 1 for the same three mass thresholds as in the top panel. Interestingly, in this case evolves even more slowly than our standard calculation predicts: it falls below unity earlier and remains substantial much later. We thus conclude that , while unknown in detail, has the important property that it evolves slowly and smoothly with redshift, vanishing only at for the mass thresholds of interest.
References
- Abel et al. (2002) Abel, T., Bryan, G. L., & Norman, M. L. 2002, Science, 295, 93
- Aguirre et al. (2001) Aguirre, A., et al. 2001, ApJ, 561, 521
- Barkana & Loeb (1999) Barkana, R., & Loeb, A. 1999, ApJ, 523, 54
- Barkana & Loeb (2001) —. 2001, Phys. Rep., 349, 125
- Barkana & Loeb (2004) —. 2004, ApJ, 609, 474
- Becker et al. (2001) Becker, R. H., et al. 2001, AJ, 122, 2850
- Benson et al. (2004) Benson, A. J., Kamionkowski, M., & Hassan, S. H. 2004, MNRAS, submitted (astro-ph/00407136)
- Bond et al. (1991) Bond, J. R., Cole, S., Efstathiou, G., & Kaiser, N. 1991, ApJ, 379, 440
- Bromm et al. (2002) Bromm, V., Coppi, P. S., & Larson, R. B. 2002, ApJ, 564, 23
- Bromm et al. (2001a) Bromm, V., Ferrara, A., Coppi, P. S., & Larson, R. B. 2001a, MNRAS, 328, 969
- Bromm et al. (2001b) Bromm, V., Kudritzki, R. P., & Loeb, A. 2001b, ApJ, 552, 464
- Bromm & Loeb (2003) Bromm, V., & Loeb, A. 2003, Nature, 425, 812
- Cen (2003a) Cen, R. 2003a, ApJ, 591, L5
- Cen (2003b) —. 2003b, ApJ, 591, 12
- Cen (2003c) —. 2003c, ApJ, submitted (astro-ph/0311329)
- Ciardi & Madau (2003) Ciardi, B., & Madau, P. 2003, ApJ, 596, 1
- Cole et al. (1994) Cole, S., Aragon-Salamanca, A., Frenk, C. S., Navarro, J. F., & Zepf, S. E. 1994, MNRAS, 271, 781
- Cooray & Sheth (2002) Cooray, A. & Sheth, R. 2002, Phys. Rep., 372, 1
- Dekel & Woo (2003) Dekel, A., & Woo, J. 2003, MNRAS, 344, 1131
- Dijkstra et al. (2004a) Dijkstra, M., Haiman, Z., Rees, M. J., & Weinberg, D. H. 2004, ApJ, 601, 666
- Dijkstra et al. (2004b) Dijkstra, M., Haiman, Z., Loeb, A. 2004, ApJ, 613, 646
- Efstathiou (1992) Efstathiou, G. 1992, MNRAS, 256, 43
- Eisenstein & Hu (1998) Eisenstein, D. J. & Hu, W. 1998, ApJ, 496, 605
- Fan et al. (2002) Fan, X., et al. 2002, AJ, 123, 1247
- Fukugita & Kawasaki (2003) Fukugita, M., & Kawasaki, M. 2003, MNRAS, 343, L25
- Furlanetto et al. (2004a) Furlanetto, S. R., Hernquist, L., & Zaldarriaga, M. 2004a, MNRAS, 354, 695
- Furlanetto & Loeb (2001) Furlanetto, S. R., & Loeb, A. 2001, ApJ, 556, 619
- Furlanetto & Loeb (2003) —. 2003, ApJ, 588, 18
- Furlanetto et al. (2004b) Furlanetto, S. R., Zaldarriaga, M., & Hernquist, L. 2004b, ApJ, 613, 1 [FZH04]
- Furlanetto et al. (2004c) —. 2004c, ApJ, 613, 16
- Gnedin & Hui (1998) Gnedin, N. Y. & Hui, L. 1998, MNRAS, 296, 44
- Gunn & Peterson (1965) Gunn, J. E., & Peterson, B. A. 1965, ApJ, 142, 1633
- Haiman et al. (1996) Haiman, Z., Thoul, A. A., & Loeb, A. 1996, ApJ, 464, 523
- Haiman et al. (2001) Haiman, Z., Abel, T., & Madau, P. 2001, ApJ, 551, 599
- Haiman et al. (2000) Haiman, Z., Abel, T., & Rees, M. J. 2000, ApJ, 534, 11
- Haiman & Holder (2003) Haiman, Z., & Holder, G. P. 2003, ApJ, 595, 1
- Haiman et al. (1997) Haiman, Z., Rees, M. J., & Loeb, A. 1997, ApJ, 476, 458; 484, 985
- Heger & Woosley (2002) Heger, A., & Woosley, S. E. 2002, ApJ, 567, 532
- Hui & Haiman (2003) Hui, L., & Haiman, Z. 2003, ApJ, 596, 9
- Kauffmann & White (1993) Kauffmann, G., & White, S. D. M. 1993, MNRAS, 261, 921
- Kauffmann et al. (2003) Kauffmann, G., et al. 2003, MNRAS, 341, 54
- Kitayama & Ikeuchi (2000) Kitayama, T., & Ikeuchi, S. 2000, ApJ, 529, 615
- Kogut et al. (2003) Kogut, A., et al. 2003, ApJS, 148, 161
- Lacey & Cole (1993) Lacey, C., & Cole, S. 1993, MNRAS, 262, 627
- Machacek et al. (2001) Machacek, M. E., Bryan, G. L., & Abel, T. 2001, ApJ, 548, 509
- Madau et al. (2001) Madau, P., Ferrara, A., & Rees, M. J. 2001, ApJ, 555, 92
- Madau et al. (1997) Madau, P., Meiksin, A., & Rees, M. J. 1997, ApJ, 475, 429
- Mesinger & Haiman (2004) Mesinger, A., & Haiman, Z. 2004, ApJ, 611, L69
- Miralda-Escudé et al. (2000) Miralda-Escudé, J., Haehnelt, M., & Rees, M. J. 2000, ApJ, 530, 1
- Mo & White (1996) Mo, H. J., & White, S. D. M. 1996, MNRAS, 282, 347
- Mori et al. (2002) Mori, M., Ferrara, A., & Madau, P. 2002, ApJ, 571, 40
- Oh & Haiman (2003) Oh, S. P., & Haiman, Z. 2003, MNRAS, 346, 456
- Onken & Miralda-Escudé (2004) Onken, C. A., & Miralda-Escudé, J. 2004, ApJ, 610, 1
- Press & Schechter (1974) Press, W. H., & Schechter, P. 1974, ApJ, 187, 425
- Rees (1986) Rees, M. J. 1986, MNRAS, 222, 27P
- Ricotti et al. (2002) Ricotti, M., Gnedin, N. Y., & Shull, J. M. 2002, ApJ, 575, 49
- Ricotti et al. (2004) Ricotti, M., Gnedin, N. Y., & Ostriker, J. P. 2004, MNRAS, submitted (astro-ph/0404318)
- Sasaki (1994) Sasaki, S. 1994, PASJ, 46, 427
- Scalo (1998) Scalo, J. 1998, in ASP Conf. Ser. 142: The Stellar Initial Mass Function, ed. G. Gilmore and D. Howell (San Francisco: ASP), 201
- Scannapieco et al. (2001) Scannapieco, E., Thacker, R. J., & Davis, M. 2001, ApJ, 557, 605
- Scannapieco & Barkana (2002) Scannapieco, E. & Barkana, R. 2002, ApJ, 571, 585
- Scannapieco et al. (2002) Scannapieco, E., Ferrara, A., & Madau, P. 2002, ApJ, 574, 590
- Scannapieco et al. (2003) Scannapieco, E., Schneider, R., & Ferrara, A. 2003, ApJ, 589, 35
- Sedov (1959) Sedov, L. I. 1959, Similarity and Dimensional Methods in Mechanics (New York: Academic Press)
- Shapiro & Giroux (1987) Shapiro, P. R., & Giroux, M. L. 1987, ApJ, 321, L107
- Shapiro et al. (2004) Shapiro, P. R., Iliev, I. T., & Raga, A. C. 2004, MNRAS, 348, 753
- Sheth (1998) Sheth, R. K. 1998, MNRAS, 300, 1057
- Sokasian et al. (2002) Sokasian, A., Abel, T., & Hernquist, L. 2002, MNRAS, 332, 601
- Sokasian et al. (2004) Sokasian, A., et al. 2004, MNRAS, 350, 47
- Somerville & Kolatt (1999) Somerville, R. S., & Kolatt, T. S. 1999, MNRAS, 305, 1
- Somerville & Livio (2003) Somerville, R. S., & Livio, M. 2003, ApJ, 593, 611
- Songaila (2004) Songaila, A. 2004, AJ, 127, 2598
- Spergel et al. (2003) Spergel, D. N., et al. 2003, ApJS, 148, 175
- Strickland et al. (2000) Strickland, D. K., Heckman, T. M., Weaver, K. A., & Dahlem, M. 2000, AJ, 120, 2965
- Tegmark et al. (1997) Tegmark, M., et al. 1997, ApJ, 474, 1
- Theuns et al. (2002) Theuns, T., et al. 2002, ApJ, 567, L103
- Thoul & Weinberg (1996) Thoul, A. A., & Weinberg, D. H. 1996, ApJ, 465, 608
- Verde et al. (2001) Verde, L., Kamionkowski, M., Mohr, J. J., & Benson, A. J. 2001, MNRAS, 321, L7
- Whalen et al. (2004) Whalen, D., Abel, T., & Norman, M. L. 2004, ApJ, 610, 14
- White et al. (2003) White, R. L., Becker, R. H., Fan, X., & Strauss, M. A. 2003, AJ, 126, 1
- Wyithe & Loeb (2002) Wyithe, J. S. B., & Loeb, A. 2002, ApJ, 581, 886
- Wyithe & Loeb (2003a) —. 2003a, ApJ, 586, 693
- Wyithe & Loeb (2003b) —. 2003b, ApJ, 588, L69
- Wyithe & Loeb (2003c) —. 2003c, ApJ, 595, 614
- Wyithe & Loeb (2004a) —. 2004a, Nature, 427, 815
- Wyithe & Loeb (2004b) —. 2004b, ApJ, submitted (astro-ph/0407162)
- Wyithe & Loeb (2004c) —. 2004c, Nature, 432, 194
- Zaldarriaga et al. (2004) Zaldarriaga, M., Furlanetto, S. R., & Hernquist, L. 2004, ApJ, 608, 622