Cluster Alignments and Ellipticities in CDM Cosmology
Abstract
The ellipticities and alignments of clusters of galaxies, and their evolution with redshift, are examined in the context of a -dominated cold dark matter cosmology. We use a large-scale, high-resolution N-body simulation to model the matter distribution in a light cone containing clusters of mass out to redshifts of . The best-fit three-dimensional ellipsoid of the mass distribution is determined for each cluster, and the results are used to analyze cluster ellipticities as a function of mass, radius, and redshift. A similar analysis is done in two dimensions in order to allow direct comparisons with future observations. Cluster ellipticities are determined within different radii, including 0.5, 1.0, and 1.5 comoving Mpc. We find strong cluster ellipticities: . The mean ellipticity increases with redshift from at to at , for both 3D and 2D ellipticities; the evolution is well-fit by . The ellipticities increase with cluster mass and with cluster radius; the main cluster body is more elliptical than the cluster cores, but the increase of ellipticities with redshift is preserved. Using the fitted cluster ellipsoids, we determine the alignment of clusters as a function of their separation. We find strong alignment of clusters for separations ; the alignment increases with decreasing separation and with increasing redshift. The evolution of clusters from highly aligned and elongated systems at early times to lower alignment and elongation at present reflects the hierarchical and filamentary nature of structure formation. These measures of cluster ellipticity and alignment will provide a new test of the current cosmological model when compared with upcoming cluster surveys.
1 Introduction
In this paper we examine two aspects of cluster structure that have received some, but not extensive, attention. The first is the distribution of cluster ellipticities and the evolution of this distribution with mass and redshift. The second is cluster alignment: how aligned are clusters with their neighbors, and how does the alignment change with cluster mass, separation, and redshift? Ongoing optical and X-ray surveys, and surveys based on weak gravitational lensing and the S-Z effect, will provide larger samples of clusters than currently available; these surveys will enable the measurement of cluster ellipticities and alignments. When compared with theoretical expectations as provided below, these measures, and their evolution with redshift, will provide a test of the cosmological model and help our understanding of cluster formation and evolution.
Observations of galaxy clusters suggest that their shapes, as traced by the distribution of galaxies or X-ray emission within the cluster, are not usually spherical but instead tend to be elongated (Carter Metcalfe, 1980; West, 1989; Plionis, Barrow, Frenk, 1991; de Theije, Katgert, van Kampen, 1995; Basilakos, Plionis, Maddox, 2000). Melott, Chambers, Miller (2001) and Plionis (2002) studied clusters to and suggest evolution in the gross morphology of clusters in this range, but Rahman et al. (2004) have pointed out that different cluster samples do not give consistent rates of evolution. Floor et al. (2003) investigated simulated clusters at and found little evolution in this narrow range; Jing Suto (2002), Suwa et al. (2003), and Rahman et al. (2004) found evidence of ellipticity evolution in CDM simulations out to . The evolution of cluster ellipticities to higher redshifts has not been investigated.
Conventional models suggest that galaxy clusters form through a process of hierarchical clustering, where gas and galaxies flow into denser regions along interconnecting large-scale filamentary structures (e.g., Shandarin Klypin, 1984; Gott, Cen, Ostriker, 1996; Ostriker Cen, 1996, and references therein). As a result of these inflows, we expect clusters to be aligned with their neighbors, especially when both are members of the same filament. Previous observations of cluster alignments have yielded controversial results. Binggeli (1982) found that Abell clusters tend to align with their nearest neighbor out to separations of , and that cluster orientation is related to the distribution of all surrounding clusters out to separations of . However, contradictory results have been claimed by others; for example, Struble Peebles (1985) extended Binggeli’s method and failed to find significant alignment. Flin (1987), Rhee Katgert (1987), West (1989), and Plionis (1994) found optical alignment for scales below . X-ray emission from clusters has also been used to determine cluster shapes and alignments. Ulmer, McMillan, Kowalski (1989) studied 46 Einstein clusters and did not find alignment; but Chambers, Melott, Miller (2000) re-examined their results using updated cluster positions and found alignment among near neighbors. Rhee, van Haarlem, Katgert (1992) combined X-ray and optical data, and found that members of the same supercluster tend to be aligned. West, Jones, Forman (1995) found correlation among cluster X-ray orientations out to , and Chambers, Melott, Miller (2002) used Einstein and ROSAT data to find alignment for separations below .
Advances in computational power enable large-volume, high-resolution cosmological simulations that provide a large sample of clusters for studying ellipticities and alignments and their evolution with redshift. Previous simulations by Splinter et al. (1997), Faltenbacher et al. (2002), and Onuora Thomas (2000) used , and dark-matter particles, respectively, to study ellipticities and orientations of nearby () clusters; all found significant alignments for nearby clusters. In this paper we use a large-scale high-resolution simulation of the current best-fit CDM cosmological model, with particles, to study cluster ellipticities, orientations, and alignments in much greater detail than previously possible. We examine cluster alignments as a function of cluster pair separation and find significant structure in this relation for separations , and also determine the evolution of cluster ellipticity and alignment with redshift, from to . This work seeks to provide a foundation for comparison with future observations of large cluster samples to high redshifts. Such comparison can be used to test the predictions of the current cosmological model as well as enhance our understanding of cluster formation and evolution. In order to provide easy comparison with observations, all important quantities, such as ellipticity and alignment measures, are obtained using both the three-dimensional halo dark matter particle distribution and the projected two-dimensional particle distribution; the latter provides a direct comparison with observations. To further facilitate comparison with observations, our analyses of ellipticity and cluster alignment are repeated using fixed cluster radii typically used in observations, rather than the friends-of-friends (or virial) radius.
We describe the simulation and cluster selection in §2. The derived cluster ellipticity distribution and its dependence on cluster mass and redshift are presented in §3. The alignment of clusters as a function of cluster separation and mass, and the evolution of alignment with redshift, are discussed in §4. Our conclusions are summarized in §5.
2 The Simulation
We use a high-resolution N-body simulation of a flat universe with matter density (baryon density plus cold dark matter), cosmological constant , Hubble constant , primordial scalar spectral index , and linear matter power spectrum amplitude . These values are consistent with both the cosmic microwave background fluctuation spectrum of WMAP as well as with large-scale galaxy and cluster results (e.g., Bahcall et al., 1999; Spergel et al., 2003; Tegmark et al., 2004).
The simulation contains billion particles in a periodic cube. The box length is and the individual particle mass is . The spline kernel softening length is ; thus, the spatial resolution is comfortably smaller than the characteristic core size of clusters, and the high mass resolution ensures that two-body relaxation is unimportant in the cluster cores. The initial conditions were generated using the publicly available codes GRAFIC2 and LINGERS111These codes are available at http://arcturus.mit.edu/grafic/ (Bertschinger, 2001; Ma Bertschinger, 1995). The simulation was carried out using the TPM (Tree-Particle-Mesh) code222Publically available at http://astro.princeton.edu/$∼$bode/TPM/ (Bode Ostriker, 2003), using a PM mesh of size 12603. The opening angle in the tree portion of the code was . The time step parameter was set to , and the initial domain decomposition parameters were and (for details on these see Bode Ostriker, 2003). The computation was carried out using 420 processors on the Terascale Computing System at the Pittsburgh Supercomputing Center, and the running time was approximately five days. At the end of the simulation trees— occupying 2% of the volume (including all PM cells with an overdensity above 39) and containing 40% of the mass— were being followed at full resolution. In the following, only objects containing 160 or more particles, i.e. with masses above , will be considered; this is four times above the limit imposed by the densest PM-only cell, thus we can be confident that resolution will not cause a problem in our analysis. This mass threshold corresponds to typical groups of galaxies, and thus includes all clusters, from poor to the richest systems.
Particles were saved at each PM time step in order to later reconstruct the mass distribution along the light cone. For distances less than from the simulation origin at , all particles in spherical shells defined by each PM time step were saved (although only for distances less than half the box size, or , is the shell contained within the simulation volume). For distances above , a single octant with all three spatial coordinates greater than zero is saved. Data were saved for a total of 670 redshift shells in the light cone between and . Since the light cone is larger than the simulation box size, a given cluster can appear more than once, but at different redshifts. Cluster halos were identified using a standard FOF (friends-of-friends) halo finding routine, run on the light cone output, using a linking length parameter times the mean interparticle separation, corresponding to an overdensity of 180 times the mean at all redshifts (Lacey Cole, 1994; Jenkins et al., 2001). Different linking lengths (=0.16 and 0.25, corresponding to fixed overdensities of 360 and 92) were also tried for comparison, yielding consistent results. For comparison, the virial overdensity for spherical collapse ranges from 97 times the mean at =0 to 174 at =3 for the model used in this paper (Bryan & Norman, 1998).
3 Cluster Ellipticities and their Evolution
We determine the structure of halos in the simulation by fitting each identified halo to a three-dimensional ellipsoid and recording the lengths and orientations of the three axes of the fitted ellipsoid. First, the center of each halo was taken to be the halo center of mass. Once the center of mass of a given halo was identified, the best-fit ellipse was found by taking the matrix of second moments of particle positions about the center of mass, defined as
| (1) |
where the sum is over all particles in the halo. The dark matter particles are assumed to trace the distribution of galaxies within the cluster, as suggested by observations. All particles in our simulation have the same mass, so was set to 1. The normalized eigenvectors of correspond to the unit vectors of the axes of the best-fit ellipse, and the corresponding eigenvalues () give the lengths of these axes () by ; the factor of is merely a geometrical normalization factor, which will cancel out in our analysis. The eigenvalues and corresponding eigenvectors were sorted such that . We use the most common measure of cluster ellipticity, defined as
| (2) |
where and are the primary and secondary ellipsoid axes lengths, respectively. We note that other definitions of ellipticity, e.g. (de Theije, Katgert, van Kampen, 1995; Splinter et al., 1997) and eccentricity, , are used occasionally in some studies. We highlight these definitions in order to clarify comparisons but, unless otherwise specified, we use relation (2) for the definition of in our analysis, as it has the most obvious relationship between ellipticity and axis ratio. Clearly, and increase monotonically with one another inside the physical range , and our results are not qualitatively changed by using either definition. We used Monte Carlo simulations to test the algorithm’s ability to recover halo ellipticities, and find that the algorithm recovers ellipticities to within , with accuracy increasing with higher ellipticity. The results are insensitive to the number of halo particles (with a slight increase in dispersion for a lower number of particles).
In order to facilitate comparison with future observations, the process was repeated by viewing halos in two-dimensional projection, as in observations. Because halo orientations are, on average, random, we use the projection in the x-y axis. The eigenvalues and corresponding eigenvectors were again sorted such that , and the projected ellipticity of each halo was taken to be . Figure 1 compares the two and three-dimensional ellipticities found for the simulated halos. The two ellipticities are correlated as ; the correlation is stronger with increasing ellipticity.
We find that clusters have moderate to large ellipticities: . The distribution of ellipticities peaks in the range , corresponding to an axis ratio of . Thus clusters are not spherical, but elongated ellipsoids. This holds for clusters of all masses. Figure 2 shows the ellipticity as a function of cluster mass in six redshift bins of width . A weak correlation of ellipticity with cluster mass is observed; high-mass clusters tend to have high ellipticities, but the scatter is large. This is investigated in more detail below.
The evolution of cluster ellipticities with redshift is illustrated in Figure 3. The results for the 3-D and 2-D ellipticities are presented by the solid and dashed histograms, respectively. The dotted vertical line shows the mean 3-D ellipticity at the given redshift. The results reveal that the mean ellipticity increases with redshift from at low redshift to at . It is also clear that despite the dispersion in the relation, the distributions of 3-D and 2-D ellipticities are almost identical. This is a consequence of secondary ellipticities having a similar distribution to primary ellipticities in this range (well approximated by a Gaussian with and ); thus the primary ellipticity is reproduced on average in projection by triaxial clusters with the above mean axis ratios. Much of the cluster population has moderate to large ellipticity (), with larger ellipticities at higher redshift. Although the dispersion of individual ellipticities about the mean value is large, Splinter et al. (1997) and Floor et al. (2003) found that, when multiple simulations of the same cosmology are run, the mean ellipticity at a given redshift has a very low dispersion, . The best-fit Gaussian to the observed distribution of cluster ellipticities () from Plionis, Barrow, Frenk (1991) is shown for comparison in Figure 3; it is consistent with the CDM cluster ellipticity distribution (with a slight offset due to the larger mass threshold in the observations).
The evolution of ellipticity with redshift is illustrated more clearly in Figure 4. The mean ellipticity of all clusters as a function of redshift is plotted for the 3-D ellipticities (bold line). The mean 2-D ellipticity is not shown but is identical to the 3-D at all redshifts to within . The mean ellipticity rises consistently from at to at . A least-squares linear fit yields (rms ). For the projected 2-D ellipticities we find (rms ). Thus we find an approximately linear increase in mean ellipticity from to with , for both the 3-D and 2-D ellipticities. This slope is consistent with those obtained in previous CDM simulations at (Rahman et al., 2004) as well as with some observations at (Melott, Chambers, Miller, 2001), although, as pointed out by Rahman et al. (2004), different observational catalogs disagree on the slope.
The evolution of ellipticity as a function of cluster mass is also presented in Figure 4. Clusters are divided into three mass bins: low-mass clusters with , medium-mass clusters with , and high-mass clusters with (where cluster mass is the total FOF mass). We find, as expected from Figure 2, that higher-mass clusters are more elliptical at all redshifts. The ellipticity-redshift relation shows the same trend for clusters of all masses, with higher mass clusters shifted to larger mean ellipticity at any given redshift. We also find that the projected mean ellipticity traces the mean three-dimensional ellipticity in all three mass bins. The mean ellipticity-redshift relation found for all masses is dominated by the low-mass clusters, as expected, especially at high redshift where higher-mass clusters become rare.
The rate of change in ellipticity could be affected by numerical effects in the cores of the simulated clusters, particularly when the number of particles in the cluster is small. To test if numerical relaxation is occurring, we repeated the analysis with a higher mass and force resolution simulation, evolved with the same code. The cosmological parameters for this simulation are fairly similar to the light cone run (, , =0.7, =1, and =0.95), but the box size is smaller () and hence the resolution is higher: , making the particle mass ; the spline softening length is . The FOF (=0.2) finder was run on the entire simulation cube at different redshifts to find clusters with masses greater than , (i.e., with at least 7960 particles per cluster, as compared to 160 in the primary simulation). We find no change in our results for high or medium-mass clusters, but do find that the slope for low-mass clusters steepens slightly, to . This leaves our results unchanged but implies that ellipticities of low-mass clusters at high redshifts may be larger than those in our primary simulation by .
The clusters studied so far include all dark matter particles within the friends-of-friends (FOF) radius. However, this does not correspond to an easily observed quantity, so we repeat the analysis using typical observed radii of 0.5, 1.0, and 1.5 (comoving), denoted by , and respectively. For these analyses, we use the previously determined center of mass (determined from all halo particles) as the center of each halo, and then drop all particles further than the given radius of interest. The analysis then follows the same methods as above, but using only the particles within the revised radius. In order to ensure that the friends-of-friends halo radius extends to the cut-off radius of interest, the proper mass threshold must be used for each radius. The initial mass cut, , is sufficient to ensure that all halos have . Similarly, a mass cut of ensures , and ensures .
The results are presented in Figure 5. The figure shows the evolution of the mean ellipticity with redshift for both the 3-D and 2-D cases, for cluster radii of , , and . We find that the measured ellipticities (both 3-D and 2-D) decrease strongly for smaller radii (for the same clusters). As the halo centers are the most dense, one expects an increasingly spherically symmetric distribution closer to the center, due to the shorter relaxation time. Additionally, extended structures and filaments which would strongly contribute to measured ellipticity are increasingly reduced with decreasing radius. At , most ellipticities have decreased by from their or values. A similar correlation between two and three dimensional ellipticities is observed for all radii. The best linear fits to the evolution of with redshift for each cut-off radius yield a slope of , with a somewhat shallower slope of for .
To test the dependence of these results on the FOF linking length used in the cluster identification, we identified clusters using two additional different linking lengths and repeated the analysis. We find a dependence on linking length similar to the dependence on cluster radius, as expected. Using a linking length (enclosing an overdensity of 92) instead of (enclosing an overdensity of 180) yields clusters with larger FOF radii, well beyond the virial radius, and thus systematically increases the mean cluster ellipticities by . A linking length of has, as expected, an opposite effect; it systematically decreases mean ellipticities by , similar to reducing the radius to . In both cases the dependence on redshift is preserved. We note that the fixed radii used above do not correspond to the virial scales of clusters, but would be less difficult to implement observationally.
4 Cluster Alignment and its Evolution
Using the parameters measured in § 3 for each halo, we identify pairs of halos and record the separation and alignment measure for each pair. We examine two common measures of alignment: first, the angle between the two major axes of a pair of clusters (the “correlation” angle), and second, the angle between a given cluster major axis and the line connecting the cluster to its paired cluster (the “pointing” angle). We use as our “correlation” alignment measure the squared dot product of the two halo major axes (given as unit vectors by the eigenvectors found in § 3), yielding for each pair, where is the angle between the two major axes. We consider instead of because are physically identical, since the unit vectors defining the halo axes do not have a preferred “positive” direction. We similarly use as our “pointing” angle measure, but in this case is the angle between a cluster major axis and the line connecting its center of mass to the center of mass of its paired cluster. We find, as Splinter et al. (1997), that both measures give similar results, with a stronger signal for the pointing angle measure. We also find that the pointing angle signal extends to larger scales.
Using the correlation angle measure, we find that pairs of clusters are strongly aligned for separations . On larger scales, alignment between pairs of clusters is random and uniformly distributed. The alignment function – the mean cluster alignment as a function of cluster pair separation – is presented for different redshift bins in Figure 6 (for 3-D) and Figure 7 (for 2-D). Assuming a random uniform distribution in (), one expects for the 3-D case and for the 2-D case (for both correlation and pointing angle measures); obtaining a greater than these values indicates alignment. The data yield (where for the 3-D and 2-D cases, respectively) for large separations (). At smaller separations the data show clear alignment of clusters, with a pronounced rise in with decreasing , to a maximum at . The fall in below is due to the close proximity of the cluster pairs; clusters at such small separations begin to overlap, and measures of ellipticity and alignment become less meaningful. The alignment increases significantly with increasing redshift. For example, at rises from at to at . The signal-to-noise ratio decreases at high redshift, as the number of massive clusters decreases. At the highest redshifts, , the rise in with decreasing (to at ) is considerably steeper than for .
Similar trends are observed for the 2-D case in Figure 7. We see for , with a similar rise in with decreasing . Alignment increases with increasing redshift, from for to for . At high redshift, uncertainties are large, and for the alignment function becomes more erratic. In this redshift range, at .
Figures 8 and 9 are similar to Figures 6 and 7, but use the pointing angle alignment measure described previously. This measure is the angle between a given cluster major axis and the line connecting the cluster center of mass to its paired cluster center of mass at the given separation. We again use as our alignment measure, employing this alternative definition of . We find that the pointing angle alignment function is similar to the correlation angle alignment function, with larger amplitude and a positive alignment signal extending to larger scales of . Previous observations by West (1989) and Plionis (1994), which used the pointing angle measure, are shown for comparison in Figure 9. The results are consistent within 1 with the CDM predicted 2-D alignment at .
As in § 3, we compare our results with those obtained using the more readily observed fixed co-moving radii of 0.5, 1.0, and 1.5 . We find that the alignment measures are nearly independent (within the 1 error bars) of the cluster radii used for determining cluster orientations. A similar near independence holds when varying the halo linking lengths; clusters identified using FOF linking lengths of and yield essentially the same results as those using (with a slight increase in at small for ).
We investigate the sensitivity of the alignment function to the masses and ellipticities of the halos by examining a mass and ellipticity-weighted average of , taken as and , where and represent the masses of the two halos in a given pair (likewise for and ). We find that the ellipticity-weighted average closely traces the standard expectation value of at all redshifts for both the 3-D and 2-D cases, and thus do not further explore a possible ellipticity dependence of this relationship. We note that Onuora Thomas (2000) also found that highly elongated clusters show no greater tendency to alignment than more spherical clusters.
We do find some deviations between and , and thus explore the possible mass dependence of this relation by dividing clusters into three mass bins using their FOF masses: low-mass clusters with , medium-mass clusters with , and high-mass clusters with . Because alignment is determined using pairs of clusters, each cluster is labeled with a letter corresponding to its mass: H (high-mass cluster, as defined above), M (medium-mass), or L (low-mass). Pairs are then identified as either H-H, H-M, H-L, M-M, M-L, or L-L, with the letters corresponding to the two elements of the cluster pair. We repeat our alignment analysis as a function of redshift for each of these six cluster subsamples, using both the correlation angle and pointing angle measures of alignment.
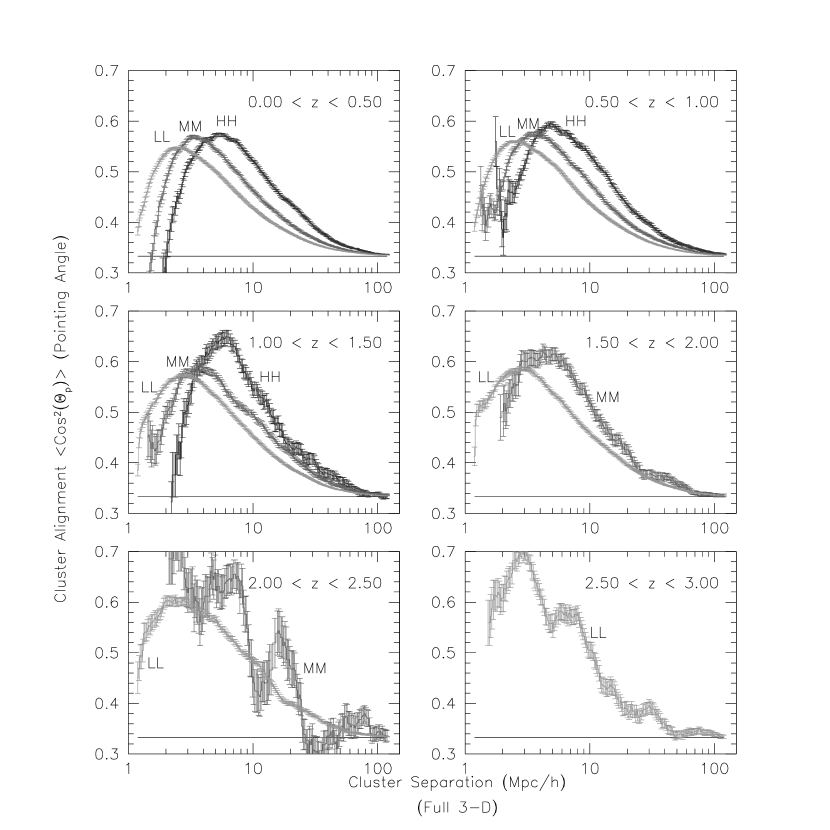
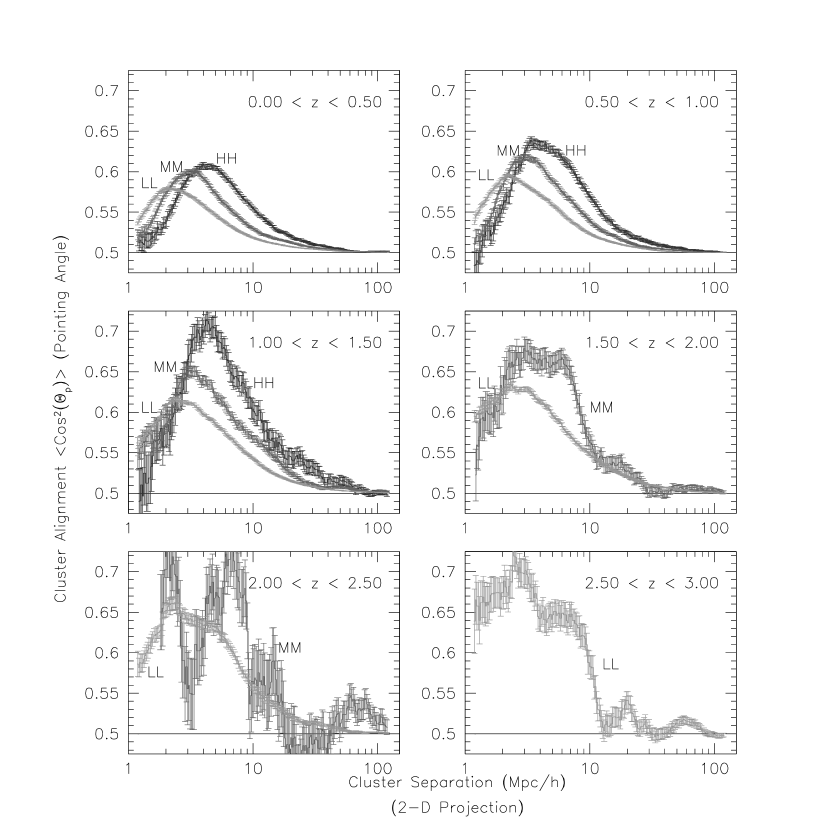
Figure 10 presents the results of this alignment analysis as a function of pair separation and redshift for the three equal-mass pair subsamples, using the pointing angle measure. The results show that the cluster alignment function increases and shifts to larger scales as the mass of the clusters increases from L-L to M-M to H-H. The scale at peak alignment of the L-L, M-M, and H-H pairs increases from to to , respectively. This is unsurprising, as it suggests that more massive cluster pairs show stronger alignments to larger scales. Mixed mass pairs, H-M, M-L, and H-L, follow intermediate relationships, with smaller peak alignments. It appears that clusters of comparable masses yield the strongest alignment; the alignment strength and scale increases with increasing cluster mass. Results for the 2-D cluster alignments are presented in Figure 11. The correlation angle results are qualitatively similar, but with weaker amplitude and no significant signal for separations above .
The cluster alignment increases for all masses with increasing redshift; high redshift clusters are more strongly aligned than low redshift clusters. The alignment increases more rapidly at high redshift among high-mass clusters than among low-mass clusters. For , we find a maximum value of for L-L pairs, and a maximum value of for H-H pairs. At , the maximum alignment of L-L pairs rises to , and the maximum alignment of M-M and H-M pairs rises to (there are too few H-H pairs for statistical analysis). At , the L-L pairs have a maximum of and the M-M pairs have a maximum of . The corresponding values for the correlation angle alignment function are lower.
These results raise the possibility that clusters of all masses form with similar large alignments. We divide clusters into six mass bins, and for each mass bin identify the approximate range of redshifts in which these clusters formed. We take this range to be the range of redshifts over which , the approximate maximum value of for each mass bin. Here, is the number density of clusters of the given mass in each redshift shell. Figure 12 shows the resulting correlation angle alignment function for each mass bin. The range of masses and redshifts for each bin are shown in the figure. We find that clusters of all masses show strong alignment shortly after formation, with an alignment function that is nearly independent of mass.
If cluster alignment is a consequence of cluster formation along filamentary superstructures, then the alignment of two clusters is an indication of connecting structures. For each pair of clusters with separation we compute , the number of clusters inside a cylinder of radius along the line connecting their two centers, and also the volume inside this cylinder. The number density of clusters in these “filaments”, , can be compared to the mean number density of clusters, , in any redshift range. The resulting number overdensity in the filaments, , is plotted as a function of the mean pointing angle (the average of the two pointing angles of the pair) in Figure 13, for different redshifts. We find that overdensity in the connecting filament rises by a factor at all redshifts as the alignment increases from to , indicating that aligned cluster pairs at separations are more likely to be connected by filamentary superstructures than unaligned pairs at the same separation. The high overdensity at any angle indicates that any two clusters within are likely to be part of some supercluster. The overall amplitude of the overdensity is closely related to the cluster correlation function, and rises with increasing redshift as expected (e.g., Bahcall et al., 2003). Similar results are also seen using the cluster mass overdensity, or using the fraction of pairs that have another cluster along the connecting filament.
5 Discussion
We use a large-scale cosmological simulation of the current best-fit CDM cosmology to investigate the ellipticities and alignments of clusters of galaxies. We study the dependence of cluster ellipticity and alignment on cluster mass, radius, and redshift. We find that clusters are elliptical, with mean ellipticities . The derived distribution of ellipticities at is consistent with current observations (West, 1989; Plionis, Barrow, Frenk, 1991; de Theije, Katgert, van Kampen, 1995; Basilakos, Plionis, Maddox, 2000).
Our large sample of clusters enables a detailed study of the distribution of cluster ellipticities as a function of various cluster properties: mass, radius, and redshift. We find that the mean cluster ellipticity increases with cluster mass, i.e., massive clusters are more elliptical than less massive clusters. We also find that cluster ellipticity decreases with radius; cluster cores are less elliptical than cluster outskirts. Both of these trends can be understood in terms of infall and mergers; these affect massive clusters and the outskirts of clusters more significantly than less massive clusters and cluster cores.
We find that the mean cluster ellipticity increases monotonically with increasing redshift from to , consistent with previous observation and simulation at low redshifts (Melott, Chambers, Miller, 2001; Plionis, 2002; Jing Suto, 2002; Suwa et al., 2003; Rahman et al., 2004). This is likely due to hierarchical cluster formation and the high rate of infall and merger at early times. The evolution of cluster ellipticity with redshift does not depend on cluster mass or radius; we find for radii . Below a radius of , the dependence on redshift weakens as clusters become more isotropic closer to the cluster center. Clusters are most elliptical at early times and become less elliptical at present; this can be understood as a relaxation process in a low-density cosmological background, with a reduced merger rate at later times (e.g., Floor et al., 2003). Our results suggest that once clusters form, a period of relaxation exists without significant new infall or merger, allowing clusters to become more spherical.
We find that clusters are aligned with one another to separations of at least , using both the pointing angle and the correlation angle methods for measuring alignment. The pointing angle measure shows a stronger signal at all separations, and a alignment detection to (compared to for the correlation angle measure). The pointing angle emphasizes the alignment of clusters with filamentary structures along which nearby clusters would form, and the correlation angle, while similar, emphasizes the direct alignment of clusters with one another; the greater strength of the pointing angle signal suggests that alignment is related to filamentary structures. If individual cluster alignments are independently perturbed, as is likely, these perturbations will dilute the correlation angle signal more strongly than the pointing angle signal.
The alignment increases with decreasing cluster separation, revealing a smooth alignment function. The alignment function shows a steady increase in alignment strength from large separations of with the pointing angle measure (or , with the correlation angle measure) to a separation of , where maximum alignment is seen. At smaller separations, the alignment measure decreases as clusters begin to overlap and alignments and ellipticities cannot be reliably measured. Distortions due to mergers and difficulty distinguishing elements of two clusters at such small separations render this region less meaningful. The alignment is independent of the cluster radius used in the analysis. We find that cluster alignment is correlated with the existence of filamentary structure along the line connecting a pair of clusters, with the cluster number overdensity increasing by a factor of as the alignment increases from no alignment to maximum alignment. The highly aligned clusters are therefore more typically members of filamentary superclusters.
We find that cluster alignment evolves with redshift. The alignment increases for all cluster separations with increasing redshift from to . Objects are most aligned at early times; we find that decreases from at to at . Our results suggest that alignment is a consequence of initial structure formation, and decreases rapidly over a timespan after which alignments continue to become more random, but at a slower rate. This supports the picture that alignment stems from early large-scale structure, with cluster formation by hierarchical clustering in which material falls into the cluster along large-scale filamentary structures (e.g., Onuora Thomas, 2000). This evolution of cluster alignment with redshift provides a new test of the cosmological model, even if present () alignments do not significantly differ between models.
Cluster alignment increases with cluster mass. The alignment extends to larger scales as the paired masses increase from low to medium to high-mass (L-L to M-M to H-H pairs). The alignment weakens somewhat for mixed-mass pairs (at all redshifts). At high redshifts , alignments of high-mass clusters increase faster than alignments of low-mass clusters. We find that clusters of all masses form with similar strong alignments, and that alignment rapidly declines to a steady value over a timespan . Most low-mass objects are formed early and thus decline to a steady value () before high-mass objects can form and do so. This rapid evolution may be the result of a period of violent relaxation during which dissipation and gravitational instability increase isotropy and randomize cluster alignments. The strong evolution of the alignment signal seen shortly after cluster formation suggests that observations of cluster alignments at the characteristic redshifts of their formation, for the relevant cluster masses, may discriminate more strongly between cosmological models than observations at .
Cluster alignments and ellipticities both show dependence on cluster mass and redshift. The distribution of ellipticities and alignments can inform our models of large-scale structure formation, and can provide a new and independent test of the cosmological model. Our results provide detailed predictions of the current cosmology for the ellipticity distribution and alignment function of clusters as a function of cluster mass, radius, and redshift; these predictions can be used for comparison with upcoming observations of large cluster samples to high redshifts.
References
- Bahcall et al. (1999) Bahcall, N. A., Ostriker, J. P., Perlmutter, S., Steinhardt, P. J. 1999, Science, 284, 1481
- Bahcall et al. (2003) Bahcall, N. A., Dong, F., Hao, L., Bode, P., Annis, J., Gunn, J. E., Schneider, D. P. 2003, ApJ, 599, 814
- Basilakos, Plionis, Maddox (2000) Basilakos, S., Plionis, M., Maddox, S. J. 2000, MNRAS, 316, 779
- Bertschinger (2001) Bertschinger, E. 2001, ApJS, 137, 1
- Binggeli (1982) Binggeli, B. 1982, A&A, 107, 338
- Bode Ostriker (2003) Bode, P. Ostriker, J.P. 2003, ApJS, 145, 1
- Bryan & Norman (1998) Bryan, G.L. & Norman, M.L. 1998, ApJ, 495, 80
- Carter Metcalfe (1980) Carter, D., Metcalfe, N. 1980, MNRAS, 191, 325
- Chambers, Melott, Miller (2000) Chambers, S. W., Melott, A. L., Miller, C. J. 2000, ApJ, 544, 104
- Chambers, Melott, Miller (2002) Chambers, S. W., Melott, A. L., Miller, C. J. 2002, ApJ, 565, 849
- de Theije, Katgert, van Kampen (1995) de Theije, P. A. M., Kartgert, P., van Kampen, E. 1995, MNRAS, 273, 30
- Faltenbacher et al. (2002) Faltenbacher, A., Gottl ber, S., Kerscher, M. & M ller, V. 2002, A&A, 395, 1
- Flin (1987) Flin, P. 1987, MNRAS, 228, 941
- Floor et al. (2003) Floor, S. N., Melott, A. L., Miller, C. J., Bryan, G. L. 2003, ApJ, 591, 741
- Gott, Cen, Ostriker (1996) Gott, J. R., Cen, R., Ostriker, J. P. 1996, AJ, 465, 499
- Jenkins et al. (2001) Jenkins, A., Frenk, C.S., White, S.D.M., Colberg, J.M., Cole, S., Evrard, A. E. Yoshida, N. 2001, MNRAS, 321, 372
- Jing Suto (2002) Jing, Y.P. Suto, Y. 2002, ApJ, 574, 538
- Lacey Cole (1994) Lacey, C. Cole, S. 1994, MNRAS, 271, 676
- Ma Bertschinger (1995) Ma, C. P. Bertschinger, E. 1995, ApJ, 455, 7
- Melott, Chambers, Miller (2001) Melott, A. L., Chambers, S. W., Miller, C. J. 2001, ApJ, 559, L75
- Onuora Thomas (2000) Onuora, L. I., Thomas, P. A. 2000, MNRAS, 319, 614
- Ostriker Cen (1996) Ostriker, J. P., Cen, R. 1996, AJ, 464, 27
- Plionis, Barrow, Frenk (1991) Plionis, M., Barrow, J. D., Frenk, C. S. 1991, MNRAS, 249, 662
- Plionis (1994) Plionis, M. 1994, ApJ, 95, 401
- Plionis (2002) Plionis, M. 2002, ApJ, 572, L67
- Rahman et al. (2004) Rahman, M., Shandarin, S.F., Motl, P.M. & Melott, A.L. 2004, MNRAS, submitted (astro-ph/0405097)
- Rhee Katgert (1987) Rhee, G. F. R. N. Katgert, P. 1987, A&A, 183, 217
- Rhee, van Haarlem, Katgert (1992) Rhee, G. F. R. N., van Haarlem, M., Katgert, P. 1992, AJ, 103, 1721
- Shandarin Klypin (1984) Shandarin, S. F., Klypin, A. A. 1984, Soviet Ast., 28, 491
- Spergel et al. (2003) Spergel, D.N., Verde, L., Peiris H.V., Komatsu E., Nolta M.R., Bennett, C. L., Halpern, M., Hinshaw, G., Jarosik, N., Kogut, A., Limon, M., Meyer, S.S., Page, L., Tucker, G.S., Weiland, J.L., Wollack, E. Wright, E.L. 2003, ApJS, 148, 175
- Splinter et al. (1997) Splinter, R. J., Melott, A. L., Linn, A. M., Buck, C., Tinker, J. 1997, ApJ, 479, 632
- Struble Peebles (1985) Struble, M. F., Peebles, P. J. E. 1985, AJ, 90, 582
- Suwa et al. (2003) Suwa, T., Habe, A., Yoshikowa, K., Okamoto, T. 2003, ApJ, 588, 7
- Tegmark et al. (2004) Tegmark, M., et al. 2004, Phys. Rev. D, 69, 103501
- Ulmer, McMillan, Kowalski (1989) Ulmer, M. P., McMillan, S. L. W., Kowalski, M. P. 1989, ApJ, 338, 711
- West (1989) West, M. J. 1989, ApJ, 347, 610
- West, Jones, Forman (1995) West, M. J., Jones, C., Forman, W. 1995, ApJ, 451, L5