Detection of CO from SMM J16359+6612, The Multiply Imaged Submillimeter Galaxy Behind A2218
Abstract
We report the detection of CO (=32) line emission from all three multiple images (A,B and C) of the intrinsically faint ( 0.8 mJy) submillimeter-selected galaxy SMM J16359+6612. The brightest source of the submm continuum emission (B) also corresponds to the brightest CO emission, which is centered at =2.5168, consistent with the pre-existing redshift derived from H . The observed CO flux in the A, B and C images is 1.2, 3.5 and 1.6 Jy km s-1 respectively, with a linewidth of km s-1. After correcting for the lensing amplification, the CO flux corresponds to a molecular gas mass of M☉, while the extent of the CO emission indicates that the dynamical mass of the system 91010 M☉. Two velocity components are seen in the CO spectra; these could arise from either a rotating compact ring or disk of gas, or merging substructure. The star formation rate in this galaxy was previously derived to be 100–500 M☉ yr-1. If all the CO emission arises from the inner few kpc of the galaxy and the galactic CO-to-H2 conversion factor holds, then the gas consumption timescale is a relatively short 40 Myr, and so the submm emission from SMM J16359+6612 may be produced by a powerful, but short-lived circumnuclear starburst event in an otherwise normal and representative high-redshift galaxy.
1 Introduction
When did the bulk of stars in galaxies form? A huge number of studies have sought to answer this question (e.g., Smail et al. 2002; Giavalisco et al. 2004; Steidel et al. 2004 and references therein). Observational evidence indicates that the star formation activity and AGN activity peaked at 1, very likely between 2 3. Sub-millimeter (submm) surveys have shown that a large fraction of the total energy output of galaxies in this critical epoch of galaxy formation comes from luminous, dusty galaxies (Smail, Ivison & Blain, 1997; Blain et al., 1999). The most luminous submm sources are widely believed to be the progenitors of today’s massive ellipticals (Lilly et al., 1999; Smail et al., 2002). The slope of the submm source counts rises steeply, indicating strong evolution, and the background radiation intensity at submm wavelengths is believed to be dominated by sources with fluxes 1 mJy (Blain et al., 2002). To understand galaxy evolution, it is therefore imperative to study the typically faint but numerous sub-mJy submm galaxies (SMGs). Unfortunately, even with the best submm continuum data, these intrinsically faint sources are difficult, if not impossible to study at present. The deepest existing 850 m continuum surveys are all limited by confusion at 2 mJy (Blain et al., 2002).
Over 400 SMGs have been identified so far, yet their distribution and evolution as a function of redshift has been hampered by difficulties in identifying optical counterparts and obtaining reliable redshifts until relatively recently (Chapman et al., 2003, 2004). At the faint end of the luminosity function (with intrinsic fluxes 10 mJy), only five redshifts for submillimeter galaxies have been confirmed absolutely by the detection of CO spectral lines (Frayer et al., 1998, 1999; Neri et al., 2003).111A more substantial sample of SMGs has recently been compiled by Greve et al. (2004) This paper presents the detection of CO (=32) emission using the Owens Valley Radio Observatory’s Millimeter Array (OVRO MMA) from the faintest submm galaxy to date, the remarkable object SMM J16359+6612 (Kneib et al., 2004) that lies in a rare high-magnification configuration behind the intervening massive cluster gravitational lens Abell 2218. Its intrinsic 850m continuum flux after correcting for the well-constrained gravitational lensing effect of the foreground cluster is only 0.8 mJy.
2 OBSERVATIONS
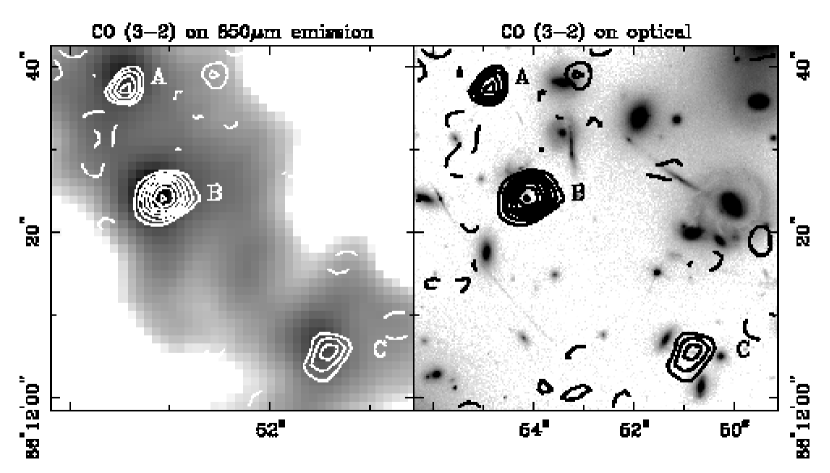
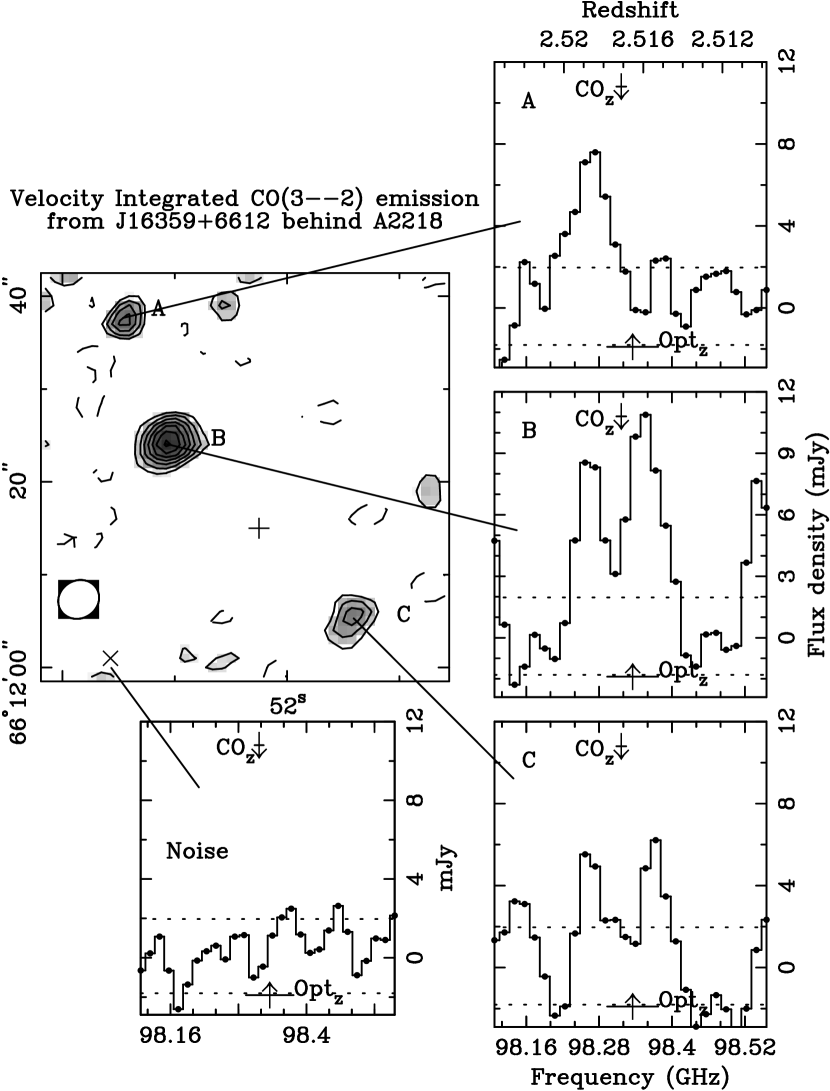
We used OVRO MMA to search for CO (=32) line emission from SMM J16359+6612 at the redshift (=2.5165) derived from H using Keck-NIRSPEC (Kneib et al., 2004) between October 2003 and April 2004 in three array configurations, L, E and H. The total integration time on source was 52.9 hours with a typical single-sideband temperature of 250K. The digital spectrometer was configured to observe at 98.3297 GHz with a spectral bandwidth of 448 MHz and a spectral resolution of 4 MHz. The phase and pointing center was (J2000) = 16:35:52.50 and (J2000) = +66:12:15.00. We used the nearby quasar J1638+573 to correct for atmospheric phase and gain variations. The spectral bandpass was determined from observations of the quasars 3C84, 3C345 and/or 3c273. Uranus and/or 3c273 were used for absolute flux calibration, leading to a 15% uncertainty in the overall flux scale. Data from each track was calibrated separately using the MMA software package (Scoville et al., 1993), and the -data were imaged using standard routines in the MIRIAD package (Sault, Teuben & Wright, 1995). The resulting channel maps were binned to a spectral resolution of 16 MHz (48.8 km s-1), and have a synthesized beam of 453 406 at a position angle of 590 with a noise level of 1.7 mJy beam-1. The channel maps were then corrected for primary beam attenuation and combined into a velocity-integrated map (see Figure 1). In Figure 2 we show the CO spectra corresponding to each image, along with a typical representation of the noise.
3 RESULTS
The CO (=32) emission is brightest from the central image. Co-adding the spectra from the peak emission in each image and fitting a single gaussian yields a redshift of z=2.51680.0003, consistent with the H redshift (zHα=2.51650.0015; Kneib et al. 2004). The CO kinematics are intriguing. CO emission is present at 2 over 400 km s-1 in two velocity components located approximately 160 and +120 km s-1 with velocity widths of km s-1 each. The total CO linewidth km s-1. A consistent profile can be seen in image C to the south. The northern image A shows only the red component of the CO emission but image A is at the edge of our primary beam and suffers from a lower signal to noise ratio. The CO flux, corrected for primary beam attenuation, in the three images is 1.20.1, 3.50.1 and 1.60.1 Jy km s-1, respectively, for a total CO flux of 6.3 Jy0.2 km s-1. To measure the molecular gas mass in the system, we adopt = 4 M☉ (K km s-1 pc2)-1, similar to the Galactic value (see, e.g., Sanders, Scoville & Soifer 1991), WMAP cosmology (H0=71 km s-1Mpc-1, =0.27, =0.73), and lensing amplification numbers from Kneib et al. (2004). Our choice of = 4 M☉ (K km s-1 pc2)-1 is consistent with that estimated for Arp 220 (Scoville, Yun & Bryant, 1997) after correcting for brightness ratio of Tb[CO (=32)]/Tb[CO (=10)] 0.6 typically observed in starbursts (Devereux et al., 1994). We follow the formulae in Solomon, Downes & Radford (1992) using a luminosity distance calculated using WMAP cosmology. We correct for the effect of gravitational lensing by dividing the observed CO fluxes of each image by its lensing amplification, and then compare the results inferred from all three images. Since A is at the edge of the primary beam and suffers from lower signal to noise, we also give the masses derived for each image separately (Table 1). The total H2 mass is 21010 M☉. Note that is uncertain and depends on metallicity and excitation; it may be as low as = 1 M☉ (K km s-1pc2)-1 (e.g., Solomon, Downes, Radford, & Barrett 1997), in which case the total H2 mass is M☉, comparable to the molecular gas mass in the Milky Way.
We estimate a dust mass of from the 850m flux density, assuming a dust temperature of K. The inferred gas-to-dust ratio of 100 is consistent with metal-rich galaxies in the local universe, suggesting that the central regions of SMM J16359+6612 have already been significantly enriched with metals.
The CO emission from image B may be partially resolved in one dimension. Using the imfit task in MIRIAD we fit the velocity-integrated emission and measure a deconvolved size of 30 14 at a position angle of 680. According to the Kneib et al. (2004) model, the linear stretch due to lensing amplification along this position angle is about a factor of 2. The major axis of the CO emission thus has an intrinsic extent of about 12 kpc, while the emission in the direction of the minor axis is unresolved. Note that the size estimates are upper limits given the low signal to noise of the map; it is possible that the CO emission is originating from a significantly smaller area.
4 A Circumnuclear Starburst In Progress?
SMM J16359+6612 has several remarkable properties. The galaxy morphology indicates an extremely red central core ( in Kneib et al. 2004) bracketed by blue features (). Unlike many submm galaxies, which show Ly is present in emission (e.g., Chapman et al. 2003), SMM J16359+6612 has Ly in absorption, as in most Lyman-break galaxies (LBGs) (Shapley et al., 2003). Given the complex morphology, the Ly absorption, the bright submm and infrared fluxes and compact H emission, the star-formation activity in SMM J16359+6612 is likely to be highly dust enshrouded. The size of the red core in HST images suggests that the star formation has an extent of only a few kpc (Kneib et al., 2004). The H linewidth in this galaxy is only 280 km s-1, which is greater than for most LBGs (e.g., Pettini et al. 2001; Erb et al. 2003), but less than typically found for high-redshift QSOs (e.g., Ivison et al. 1998). Nevertheless, the star formation rate estimated from the far-infrared luminosity may be as high as 500 M☉ yr-1 (Kneib et al., 2004), an order of magnitude larger than in most LBGs (e.g., Pettini et al. 2001; Erb et al. 2003). Is SMM J16359+6612 at a later evolutionary stage than submm sources previously studied in CO? Is it massive? What will be the fate of this galaxy and how long can it maintain its starburst/possible AGN activity?
The molecular gas observations offer answers to some of these questions. The molecular mass inferred from the CO data provides a modest reservoir of 21010 M☉ for this rate of star formation activity. The extent of the CO emission indicates that the molecular gas is likely located in the central few kpc, similar to the size of the red core in optical images (Kneib et al., 2004). If all the gas is consumed at the estimated current star formation rate of 100–500 M☉ yr-1, then the activity should cease in a mere 40–200 Myr. The nature of the star formation is reminiscent of circumnuclear starbursts in local infrared ultraluminous galaxies where the timescale for bursts is typically on the order of 100 Myr, although the star formation rates and central molecular concentration in the lower redshift galaxies are both less by about a factor of 10. The gas and star formation activity in local starbursts are often distributed in a ring-like or disk-like morphology (e.g., Downes & Solomon 1998). In this respect too SMM J16359+6612 could resemble a circumnuclear starburst: the two CO velocity components may indicate a gas ring or disk morphology. If the CO were centrally concentrated (and in the absence of merging) we would expect a single broad velocity peak in the CO emission.
There is one troubling discrepancy between the CO and H observations. The CO linewidth is about 500 km s-1 whereas the H linewidth is 280 km s-1. One explanation for this difference is that the two lines trace different parts of the galactic potential: the H emission is likely confined to only the central 1–2 kpc in the source plane (Kneib et al., 2004) whereas the CO emission may come from a more extended region. This distribution could be consistent with a ring morphology for the CO distribution if the central molecular gas has been consumed by the starburst activity. Another possibility is that we are only observing the H emission from the near side of the galaxy or through windows where there is less extinction from dust. As the CO emission is only barely resolved, higher spatial resolution observations (e.g., with IRAM, CARMA222The Combined Array for Research in Millimeter-wave Astronomy, http://www.mmarray.org and eventually ALMA333Atacama Large Millimeter Array, http://alma.nrao.edu) are needed to understand the relative distribution of the molecular gas and star formation activity.
5 Is This Submm Source Fated to Become a Massive Early Type Galaxy?
Do all galaxies pass through a bright-submm phase? This is an outstanding question in the literature (e.g., Lilly et al. 1999; Smail et al. 2002). Certainly the brightest submm sources at near-IR wavelengths are believed to be analogs of today’s local, massive, early type galaxies (Smail et al., 2002, 2004). But what about the fainter submm sources that contribute the majority of the submm background? Do later Hubble types and less massive galaxies also pass through a bright submm phase when building their bulges and perhaps when their stellar disks begin to form? If so, then the corresponding fainter submm galaxies should not be very massive ( M☉). With the CO data for SMM J16359+6612, comparable to that available for cB58 (Baker et al., 2004a), we can make an attempt to address this fundamental question.
Assuming that the molecular gas is tracing the galaxy mass at a radius of 6 kpc, and using the CO linewidth of 500 km s-1, we estimate a dynamical mass of 91010 M☉. Note, however, that the mass is uncertain by at least a factor of two and depends on several important assumptions. The mass may be smaller depending on the true size of the CO emitting region which is, at best, only barely resolved in these data. The mass could also be higher depending on the inclination of any disk present.
Not surprisingly, the dynamical mass in SMM J16359+6612 is at the low end of SMGs (see review by Genzel et al. 2004 and references therein), and is higher than the typical dynamical masses (1010M☉) inferred for LBGs (Pettini et al., 2001; Erb et al., 2003; Baker et al., 2004a, b). But unlike previous SMGs, and especially the strongly lensed LBG cB58 for which CO spectroscopy is available (Baker et al., 2004a), SMM J16359+6612 lacks a large molecular gas reservoir by fraction. The relatively low gas fraction suggests that the bulk of the stellar mass in this system is already in place and so the stellar mass is unlikely to increase significantly without subsequent merging activity. So does this imply that a submm-bright phase is typical for all galaxies including the less massive galaxies in the field today?
SMM J16359+6612 is part of a close galaxy group: two other galaxies (#384/#478 and #273), neither of which are detected in the submm, are within 130 kpc, and all three are separated by less than 100 km s-1 from each other in redshift. The submm luminosity of SMM J16359+6612 may be boosted by star-formation triggered by the interaction with these neighbors (Kneib et al., 2004). This situation is analogous to local galaxies where otherwise normal spirals undergo massive bursts of star formation and molecular gas inflow upon an interaction or merger (e.g., Scoville, Yun & Bryant 1997 and references therein). We cannot conclusively state that the faint end of the submm population is composed exclusively of low mass systems. However, as SMM J16359+6612 appears to be less massive than the brightest submm sources, it is clear that a fraction of faint submm galaxies could be systems with low gas fractions and more modest total masses that could have elevated submm fluxes due to intense but short-lived starburst activity.
6 Conclusions
Our detection of molecular gas from SMM J16359+6612, the faintest submm-selected galaxy observed in CO emission to date, reveals some remarkable properties. SMM J16359+6612 is significantly smaller in extent, and has a lower dynamical mass and a lower gas mass fraction than previous SMGs. These factors all suggest that SMM J16359+6612 is unlikely to develop into a massive elliptical galaxy without extensive subsequent merging. The distribution and kinematics of the molecular gas and star formation activity indicate that a circumnuclear starburst is likely to be responsible for the submm emission, in analogy with nearby ultraluminous infrared galaxies. The luminous activity is likely induced by interactions with two neighboring galaxies. SMM J16359+6612 indicates that at least a fraction of the sub-mJy submm sources are likely going through a bright submm phase due to an episode of intense star formation activity that is found in a galaxy of relatively modest mass, and triggered by environmental factors. This type of interaction-induced activity in a modestly massive system could help to explain the very strong clustering signal seen in submm galaxies Blain et al. (2004).
References
- Baker et al. (2004a) Baker, A.J., Tacconi, L.J., Genzel, R., Lehnert, M.D., & Lutz, D. 2004a, ApJ, 604, 125
- Baker et al. (2004b) Baker, A.J., Tacconi, L. J., Genzel, R., Lutz, D., & Lehnert, M. D. 2004b, ApJ, in press (astro-ph/0408337)
- Blain (1999) Blain, A.W. 1999, MNRAS, 304, 669
- Blain et al. (1999) Blain, A.W., Smail, I., Ivision, R.J., & Kneib, J.-P. 1999, MNRAS, 302, 632
- Blain et al. (2000) Blain, A. W., Frayer, D. T., Bock, J. J., & Scoville, N. Z. 2000, MNRAS, 313, 559
- Blain et al. (2002) Blain, A. W., Smail, I., Ivison, R. J., Kneib, J.-P., & Frayer, D. T. 2002, Phys. Rep., 369, 111
- Blain et al. (2004) Blain, A. W., Chapman, S. C., Smail, I., & Ivison, R. J. 2004, ApJ, 611, 725
- Buta & Crocker (1993) Buta, R. & Crocker, D. A. 1993, AJ, 105, 1344
- Chapman et al. (2003) Chapman S. C., Blain A. W., Ivison R. J., Smail I., 2003, Nature, 422, 695
- Chapman et al. (2004) Chapman S. C., Blain A. W., Smail, I., & Ivison R. J. ApJ, submitted
- Devereux et al. (1994) Devereux, N., Taniguchi, Y., Sanders, D.B., Nakai, N., & Yung, j.S., 1994, AJ, 107, 2006
- Downes & Solomon (1998) Downes, D., & Solomon, P. 1998, ApJ, 507, 615
- Erb et al. (2003) Erb, D.K., Shapley, A.E., Steidel, C.C., Adelberger, K.L., Hunt, M.P., Moorwood, A.F.M., & Cuby, J-G. 2003, ApJ, 591, 101
- Frayer et al. (1998) Frayer, D.T., Ivision,R.J., Scoville, N.Z., Yun, M., Evans, A.S., Smail, I., Blain, A.W., & Kneib, J.-P. 1998, ApJ, 506, 7
- Frayer et al. (1999) Frayer, D.T., Ivision,R.J., Scoville, N.Z., Evans, A.S., Yun. M., Smail, I., Barger, A.J., Blain, A.W., & Kneib, J.-P. 1999, ApJ, 514, 13
- Genzel et al. (2004) Genzel, R., et al. 2004, astro-ph/0403183
- Giavalisco et al. (2004) Giavalisco et al. 2004, ApJ, 600, 103
- Greve et al. (2004) Greve, T. R., et al., 2004, ApJ, submitted
- Ivison et al. (1998) Ivison, R. J., Smail, I., Le Borgne, J.-F., Blain, A. W., Kneib, J.-P., Bezecourt, J., Kerr, T. H., & Davies, J. K. 1998, MNRAS, 298, 583
- Kneib et al. (2004) Kneib et al. 2004, MNRAS, 349, 1211
- Lilly et al. (1999) Lilly, S. J., Eales, S. A., Gear, W. K. P., Hammer, F., Le Fèvre, O., Crampton, D., Bond, J. R., & Dunne, L. 1999, ApJ, 518, 641
- Neri et al. (2003) Neri, R., et al. 2003, ApJ, 597, L113
- Pettini et al. (2001) Pettini, M., Shapley, A. E., Steidel, C. C., Cuby, J., Dickinson, M., Moorwood, A. F. M., Adelberger, K. L., & Giavalisco, M. 2001, ApJ, 554, 981
- Sanders, Scoville & Soifer (1991) Sanders, D.B., Scoville, N.Z., & Soifer, B.T. 1991, ApJ, 370, 158
- Sault, Teuben & Wright (1995) Sault, R. J., Teuben, P. J., & Wright, M. C. H. 1995, Astronomical Data Analysis Software and Systems IV, ASP Conference Series, Volume #77, eds. R.A. Shaw, H.E. Payne, and J.J.E. Hayes, 4, 433
- Scoville et al. (1993) Scoville et al. 1993, PASP, 105, 14 82.
- Scoville, Yun & Bryant (1997) Scoville, N.Z., Yun, M.S., & Bryant, P.M. 1997, ApJ, 1997, 484
- Shapley et al. (2003) Shapley, A. E., Steidel, C. C., Pettini, M., & Adelberger, K. L. 2003, ApJ, 588, 65
- Shapley et al. (2001) Shapley, A. E., Steidel, C. C., Adelberger, K. L., Dickinson, M., Giavalisco, M., & Pettini, M. 2001, ApJ, 562, 95
- Smail, Ivison & Blain (1997) Smail, I., Ivison, R.J., & Blain, A.W., ApJ, 490, 5
- Smail et al. (2002) Smail, I., Ivison, R.J., Blain, A.W., & Kneib, J.-P. 2002, MNRAS, 331, 495
- Smail et al. (2004) Smail, I., Chapman, S. C., Blain, A. W., & Ivison, R. J. 2004, ApJ, in press
- Solomon, Downes & Radford (1992) Solomon, P. M., Downes, D., & Radford, S. J. E. 1992, ApJ, 387, 55
- Solomon, Downes, Radford, & Barrett (1997) Solomon, P. M., Downes, D., Radford, S. J. E., & Barrett, J. W. 1997, ApJ, 478, 144
- Steidel et al. (2004) Steidel, C.C., Shapley, A.E., Pettini, M, Adelberger, K.L., Erb, D.K, Reddy, N.A., & Hunt, M.P. 2004, ApJ, 604, 534
| ID | (J2000) | (J2000) | SCO | Amplification | Intrinsic SCO | M(H2) |
|---|---|---|---|---|---|---|
| (Jy km s-1) | (Jy km s-1) | (1010 M☉) | ||||
| A | 16h35m54.814s | 66012’37” | 1.20.14a | 14 | 0.09a | 1.3 |
| B | 16h35m54.152s | 66012’24” | 3.50.12 | 22 | 0.16 | 2.3 |
| C | 16h35m50.848s | 66012’06” | 1.60.13 | 9 | 0.18 | 2.6 |