Far-infrared and sub-mm observations of the Crab nebula††thanks: Based on observations with ISO, an ESA project with instruments funded by ESA Member States (especially the PI countries: France, Germany, the Netherlands and the United Kingdom) and with the participation of ISAS and NASA.
Abstract
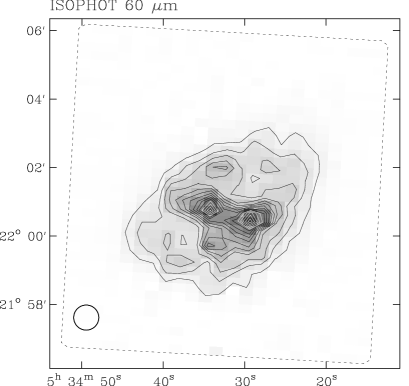
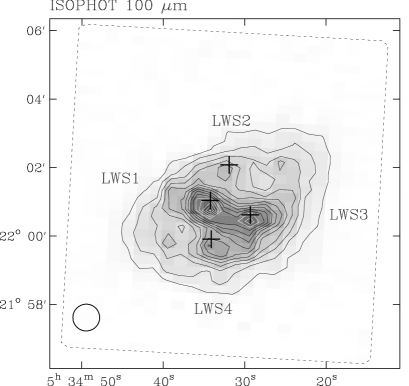
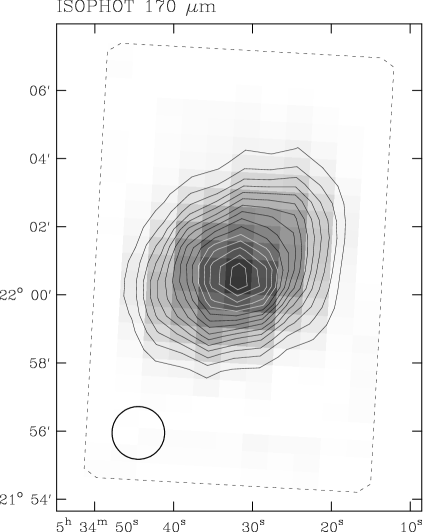
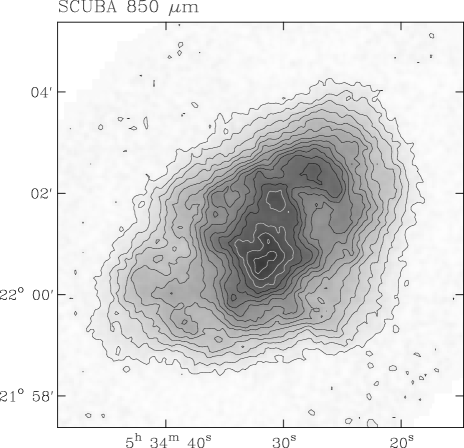
We present far-infrared (FIR) and sub-mm images of the Crab nebula, taken with the ISOPHOT instrument on board the Infrared Space Observatory (ISO) and with the Submillimetre Common-User Bolometer Array (SCUBA) on the James Clerk Maxwell Telescope. The ISOPHOT observations were made in the bands centred at 60, 100, 170 m, with FWHM of equivalent area Gaussian beams of 44, 47 and 93 arcsec, respectively. The 850 m SCUBA image was processed using a Maximum Entropy Method algorithm and has a Gaussian FWHM of 17 arcsec. The 60 and 100 m images show clear excess of emission, above that expected from an extrapolation of the synchrotron spectrum of the Crab nebula from lower frequencies, as previously seen from IRAS observations. The superior angular resolution of the ISOPHOT images reveal that about half this excess is attributable to two peaks, separated by arcsec. We also present spectra taken using the Long Wavelength Spectrometer on board ISO, which show that the FIR excess is not due to line emission. The lower resolution 170 m image does not show any excess emission, but is possibly fainter, particularly in the NW, than expected from an extrapolation of the lower-frequency synchrotron emission. These findings are consistent with a picture in which the FIR excess is due to emission from a small amount of warm dust (in the ranges and M⊙ for astronomical silicate and graphite, respectively) which radiates predominantly at 60 and 100 m micron but not at 170 m, and which is superimposed on a synchrotron spectrum which gradually steepens towards shorter wavelengths throughout the FIR and MIR spectral range. The dust geometry is consistent with a torus of diameter pc created by the (red supergiant) supernova progenitor prior to its explosion, superimposed upon a broadly distributed component which may be supernova condensates in the filaments. The dust-to-gas ratio in the filaments is comparable to the interstellar value. Therefore, even if the condensates seen at the present epoch could ultimately escape the remnant without being destroyed, the surrounding ISM will not be significantly enriched in dust. Our upper limit of M⊙ on the total mass of Carbon in the form of graphite is consistent with the inference from the gas-phase Carbon abundances that there has been no significant enrichment of the filaments in Carbon nucleosynthesis products from the progenitor. To study spectral index variations in the radio synchrotron emission we compared the 850-m image with a 20-cm VLA image. These images are very similar, implying that there is little variation in spectral index across the face of the remnant between these wavelengths. As seen previously, there are some spectral variations near the centre of the remnant. But given the good agreement between the integrated flux density at 850 m and the extrapolated synchrotron spectrum, together with the different epochs of the 850-m and 20-cm images, we do not see the need for the second radio synchrotron component from the remnant, which has previously been proposed.
keywords:
ISM: individual: Crab nebula – supernova remnants – infrared: ISM – submillimetre – dust, extinction – radio continuum: ISM1 INTRODUCTION
The Crab nebula (G184658), the remnant of the SN of ad 1054 (e.g. Stephenson & Green 2002), shows a centrally brightened morphology, and it is the best known of the class of ‘filled-centre’ supernova remnants (or ‘plerions’). It is powered by its central pulsar, and emits synchrotron emission with a relatively flat spectral index at radio wavelengths, with a spectral index here defined in the sense that flux density scales with frequency as , of (Baars et al. 1977). The integrated spectrum of the Crab nebula steepens at higher frequencies, with a break wavelength in the mid-infrared (e.g. Marsden et al. 1984; Woltjer 1987), which is at much higher frequencies than for other filled-centre remnants such as 3C58 (G130731; see Green & Scheuer 1992), which is consistent with the central pulsar in the Crab still being active.
| Filter | Effective | TDTa | Image Centre (J2000.0) | PAb | Image Samplingc | Image Size | Background | FWHMd | Integrated | |
|---|---|---|---|---|---|---|---|---|---|---|
| wavelength | RA | Dec | flux densitye | |||||||
| (m) | (h m s) | (∘ ′ ′′) | (degree) | (arcsec2) | (arcsec2) | (MJy/sr) | (arcsec) | (Jy) | ||
| C60 | 60 | 82301720 | 05 34 32.44 | 01 14.5 | 356.80 | 25.6 | 44 | |||
| C100 | 100 | 82301720 | 05 34 32.44 | 01 14.5 | 356.81 | 28.9 | 47 | |||
| C160 | 170 | 82401805 | 05 34 31.70 | 00 48.2 | 356.84 | 52.0 | 93 | |||
Notes:
a Target Dedicated Time identifier. The first three digits give the
orbit identifier, which is also the epoch of the observation in days after 1995
November 17th.
b Positive Y direction (the direction of the chopper sweep), degrees E
from N.
c Spacecraft coordinates.
d FWHM of equivalent area circular Gaussian.
e The uncertainties are a combination of those due to the uncertainty
in the spectrum of the absolute calibrators (10 per cent in each band) and long
term variations in detector responsivity (determined from the dispersion in the
response of individual pixels to the background to be 3 per cent at 60 and 100
m and 6 per cent at 170 m). The systematic uncertainties
dominate the random uncertainties, which at 60 and 100 m are mainly due
to residual glitches in the detector signal response – at a level of per cent – and at 170 m are mainly due to the shot noise induced by
the illumination of the target and background – at a level of per
cent.
In addition to the evidence for a break in the mid-infrared synchrotron spectrum, IRAS observations (Marsden et al.) also revealed the existence of a far-infrared (FIR) excess in the integrated measurements over the extrapolation of the radio–sub-mm synchrotron spectrum. It has been suggested that this excess could have one or a mixture of two distinct physical origins – warm () dust emission (Marsden et al. 1984; Mezger et al. 1986; Strom & Greidanus 1992) and synchrotron emission arising from a bump in the relativistic electron energy spectrum around the energy corresponding to the synchrotron break wavelength (Mezger et al. 1986). Furthermore, Fesen & Blair (1990) suggested the existence of grains in the nebula on the basis of optical measurements. Their study of various optical images revealed numerous dark spots, ranging up to 5 arcsec in size, which they attributed to patches of obscuration. Evidence was also found for an extended component of the obscuration. However the attributes of prime significance – the mass, composition and temperature of the grains – could not be addressed by this investigation, nor by the subsequent analysis using images from the Hubble Space Telescope (HST) by Blair et al. (1997). In a separate study, Fesen, Martin & Shull (1990) made a case that the bays seen prominently in optical continuum images at the E and W extremities of the remnant represent the projection of a toroid of pre-existing material created by a (red giant) progenitor wind (see also Li & Begelman 1992). They supposed that this disk could account for some of the high Helium abundances seen in the remnant and could be dusty. Douvion et al. (2001) presented some infrared observations of the Crab nebula, made with the ISOCAM instrument aboard the ISO satellite. These observations, which were made at 6 to 16 m (i.e. wavelengths just shortwards the mid-infrared break), did not detect any dust emission, but only synchrotron emission, which showed a steepening of the mid-infrared spectral index away from the central pulsar. It is important to search for cold grains at longer wavelengths, since it not known whether significant quantities of dust are produced by the progenitor star of the type that produced the Crab nebula, either in a stellar wind prior to the outburst or as condensates in the metal rich supernova ejecta. From observed elemental abundances, Nomoto (1984) concludes that the progenitor of the Crab nebula must have been M⊙, with a mass of M⊙ being preferred. Recent sub-mm observations (Dunne et al. 2003; Morgan et al. 2003) suggest that there are large amounts of cold dust – of the order of a Solar mass – in the supernova remnants Cassiopeia A and that of Kepler’s supernova of ad 1604 (although an alternative explanation for the sub-mm emission from Cas A has been proposed by Dwek 2004). Sources of dust production are important for understanding dust high-redshift galaxies (e.g. Morgan & Edmunds 2003), and in this context further investigations of the dust content of Galactic supernova remnants are useful.
Concerning the synchrotron emission, although there have been claims of variations in spectral index across the Crab nebula at radio wavelengths (e.g. between the filaments and the diffuse inter-filament regions, and a systematic steepening of the spectrum towards the edge of the remnant), these were not confirmed by the detailed study of Bietenholz et al. (1997). The spectral variations that were detected were: (i) within about an arcminute of the pulsar, due to moving features in the radio emission (see also Bietenholz, Frail & Hester 2001; Bietenholz et al. 2004), and the different epochs of the images compared, and (ii) some absorption at low frequencies (below about 300 MHz), due to thermal material in the Crab nebula’s filaments. More recent comparisons by Bietenholz, et al. (2001) show that radio observations of the Crab nebula taken about a year and half apart indeed show changes in the structure of the emission from the Crab nebula close to its central pulsar. However, any spectral variations are difficult to detect over a narrow range of wavelengths, and may be more easily detectable if a good mm or sub-mm image of the Crab nebula is available for comparison with longer wavelength radio observations. Bandiera, Neri & Cesaroni et al. (2002) presented a 240-GHz (i.e. 1.3 mm) image of the Crab nebula, and compared it with a 20-cm image for spectral index studies, from which they proposed a second synchrotron component to the emission from the remnant.
In this paper we present images of the nebula in both the FIR (ISOPHOT images at 60, 100 and 170 m) and the sub-mm (a SCUBA image at 850 m), as well as four FIR spectra taken with the LWS instrument on board ISO. (A preliminary analysis of the sub-mm observations was presented by Green 2002.) These allow us to spatially and spectrophotometrically distinguish between synchrotron, dust and line emission, to determine the amount and distribution of cold dust in the nebula, and to investigate further the radio to sub-mm spectral index across the remnant. J2000.0 coordinates are used throughout this paper, and we take the distance to the Crab nebula to be kpc (Trimble 1973). The FIR and sub-mm observations are described in Section 2 and 3 respectively. These observations are discussed is 4, and our conclusions summarised in Section 5.
2 ISO DATA REDUCTION AND RESULTS
2.1 ISOPHOT images
Details of the FIR observations of the Crab nebula made with the ISOPHOT instrument of the Infra-Red Space Observatory (ISO; see Kessler et al. 1996 for details about ISO, and Lemke et al. 1996 for details of ISOPHOT) are given in Table 1. These were made using the ISOPHOT-C100 3 pixel array with the C60 and C100 filters and the ISOPHOT-C200 2 pixel array with the C160 filter. The passbands of the C60, C100 and C160 filters are between 48–73 m, 82–124 m and 130–218 m, and have effective central wavelengths near 60, 100 and 170 m, respectively. (Note that the name of the C160 filter does not correspond to the central wavelength, unlike the case of the C60 and C100 filters.) The ‘P32’ mapping mode was used to provide near Nyquist sampling over an area encompassing the nebula, as well as the surrounding background. The total exposure was 50 minutes, corresponding to exposures per image pixel exposure of 4.7 s at both 60 and 100 m, and 18.8 s at 170 m. The area of the beam covers about 6 independent pixels in each filter, so that the effective exposure time per beam is about six times longer in each case. The data for each wavelength were separately processed using the latest P32 reduction package (Tuffs & Gabriel 2003), which corrects for the transient response of the detector pixels. A time-dependent flat-field correction was made for each image, by fitting a quadratic function to the response of the detector pixels to the background. Calibration was made using V8.1 of the ISOPHOT Interactive Analysis (PIA) Package (Gabriel et al. 1997), which is based on the on-board calibration source (which was periodically checked with respect to the primary celestial calibrators). Although the images are oversampled, independent data contribute to each image pixel. Finally, the background was removed by subtracting a tilted plane obtained from a fit to the extremities of the image (external to the extent of the nebula). The derived images at 60, 100 and 170 m are shown in Figs 1 and 2.
| Label | Position | PHT measureda | line | line power | Equivalent in-filter continuum brightnessb | ||||
| (J2000.0) | C60 | C100 | ( W m-2) | PHT-C60 | PHT-C100 | IRAS-60 m | IRAS-100 m | ||
| (MJy/sr) | (MJy/sr) | (MJy/sr) | (MJy/sr) | (MJy/sr) | (MJy/sr) | ||||
| LWS1 | 05 34 34.2 | 195 | 181 | [O iii] 52 m | 4.1 | 8 | – | 7 | – |
| +22 01 02.3 | [O i] 63 m | 1.2 | 5 | – | 3 | – | |||
| [O iii] 88 m | 3.2 | – | 13 | – | 13 | ||||
| Total | 13 | 13 | 10 | 13 | |||||
| LWS2 | 05 34 31.9 | 90 | 76 | [O iii] 52 m | 2.1 | 4 | – | 4 | – |
| +22 02 04.8 | [O i] 63 m | 1.1 | 4 | – | 3 | – | |||
| [O iii] 88 m | 1.7 | – | 2 | – | 3 | ||||
| Total | 8 | 2 | 7 | 3 | |||||
| LWS3 | 05 34 29.3 | 216 | 161 | [O iii] 52 m | 7.1 | 13 | – | 12 | – |
| +22 00 37.0 | [O i] 63 m | 2.0 | 8 | – | 5 | – | |||
| [O iii] 88 m | 4.4 | – | 17 | – | 18 | ||||
| Total | 21 | 17 | 17 | 18 | |||||
| LWS4 | 05 34 34.1 | 132 | 121 | [O iii] 52 m | 2.7 | 5 | – | 5 | – |
| +21 59 54.6 | [O i] 63 m | 1.5 | 6 | – | 4 | – | |||
| [O iii] 88 m | 1.9 | – | 8 | – | 8 | ||||
| Total | 11 | 8 | 9 | 8 | |||||
Notes:
a after convolution to a Gaussian approximation
(FWHM 68 arcsec) to the LWS beams measured by Lloyd (2003).
b The equivalent brightness of the diffuse continuum emission which
would give rise to the same power received by the ISOPHOT or IRAS detectors as
received by the LWS from the emission lines.

The integrated flux densities of the nebula at the 60, 100 and 170 m, together with the backgrounds, are given in Table 1. The ISO backgrounds are consistent with the backgrounds measured from COBE/DIRBE to within about 15 per cent in C160 and to within about 10 per cent at 100 and at 60 m. These accuracies are limited by the background dust emission from the Milky Way in the COBE 40 arcmin beams. Even though the ISOPHOT data have been corrected for signal losses due to the transient response of the detectors, the integrated flux densities at 60 and 100 m are lower by about 30 per cent compared with those found by IRAS in the corresponding bands. This seems to be a general phenomenon, and not just restricted to datasets considered in this paper; the discrepancies seem to be larger for extended sources than for point-like sources (see Tuffs & Gabriel 2003; Tuffs et al. 2002). This difference between ISO and IRAS photometry of extended sources may be due to the fact that a single correction factor is used to correct for signal losses due to the transient response of the IRAS detectors (see the IRAS Explanatory Supplement, Beichman et al. 1988), whereas the corrections for the ISOPHOT data self-consistently take into account the source structure. Since the IRAS correction factor was derived from measurements of point source primary calibrators, and it is inherent to the transient response of the Ge:Ga detectors that the shortfall in signal will be greater for point sources than for extended sources, this may explain the higher integrated flux densities obtained for IRAS observations of extended sources in the 60 and 100 m bands compared with ISOPHOT.
2.2 LWS spectra
Spectroscopic observations were made towards four directions in the nebula (marked by crosses superimposed on the 100 m image of Fig. 1) with the Long Wavelength Spectrometer (LWS) instrument onboard ISO (see Clegg et al. 1996). These spectra show the presence of strong emission from all the [O i] and [O iii] lines. Details of these spectra, and the results, are given in Table 2, and the spectra are shown in Fig. 3. The spectra are standard pipeline products (OLP Version 10), taken from the ISO archive (from a program of D. Péquignot), and include some spikes due to cosmic rays. Two of the positions observed (LWS1 and LWS3) were close to the two FIR peaks seen on the ISOPHOT 60 and 100 m image, near to the centre of the Crab nebula (see Fig. 1), with the other two positions nearer the edge of the nebula.
3 JCMT DATA REDUCTION AND RESULTS
The Crab nebula was observed with the Submillimetre Common-User Bolometer Array (SCUBA) (Holland et al. 1999) using the ‘850 m’ filter on the James Clerk Maxwell Telescope (JCMT) on 1999 September 19. SCUBA operates at both 850 and 450 m simultaneously, but since the surface of the telescope was not well set when the observations were made, only the results at 850 m are presented. The 850 m SCUBA filter is actually centred at 863 m (i.e. 347 GHz). At this wavelength SCUBA has 37 bolometers, each with an ideal resolution of 13 arcsec, covering a field-of-view of arcmin. Since the Crab nebula is significantly larger than the SCUBA field-of-view, the observations were made in the scan-map mode, where the array scans across the source with the telescope continuously ‘chopping’ in a particular direction. A variety of chop-throws and scanning directions were observed, in order to sample structure well in all directions, and on scales missed by any single chop throw. In total six chop throws were used (30, 44 and 68 arcsec in both RA and DEC), each for three different scanning directions (at position angles, PAs, of , and ). A region arcmin2, at a PA of , was observed in order to ensure a clear emission-free region around the Crab nebula was covered. The observations were made in two sessions, over about 4.5 hours, at elevations between and . Each session was preceded by observations of the standard source CRL 618, and was preceded and followed by a sky-dip calibration. The observing conditions varied little, as indicated by both the sky-dip observations, and the Caltech Submillimeter Observatory ‘tau-meter’ readings at 225 GHz (which varied between 0.048 and 0.065 for the Crab nebula observations).

The data were reduced using a series of standard procedures from the SCUBA User Reduction Facility (SURF) package (see Jenness & Lightfoot 2000). This processing included corrections for the extinction at 850 m, as measured by sky-dip observations (the observed optical depths varied between 0.19 and 0.21); removal of spikes in the data, both manually and automatically; removal of six poorly-performing bolometers (four of which were at the edge of the bolometer array); removal of linear baselines; and removal of sky contributions. Finally the data were restored to an image using a MEM algorithm (Pierce-Price 2001).
The flux density scale was set by the observations of the calibrator source CRL 618 (with an assumed flux density of 4.56 Jy at 850 m, from the JCMT calibrator webpages,111See: http://www.jach.hawaii.edu/ see also Sandell 1994). The scaling factor used was the average of those determined from the two available observations of CRL 618, which differed by only per cent from their mean (with this flux scale, the integrated flux density of the Crab nebula is in good agreement with that expected from extrapolation of data from lower frequencies, see below). From the CRL 618 observations the beam was fitted with a Gaussian of HPBW of 16 arcsec.
Figure 4 shows the emission from the Crab nebula at 850 m from these observations, smoothed slightly to a resolution of 17 arcsec. The noise on this image, in small regions away from the Crab nebula, is Jy beam-1, with variations in the local baselevel away from the Crab nebula, up to Jy beam-1. This image has considerably higher dynamic range than the 1.3 mm image of Bandiera et al., although it does have slightly poorer resolution.
The integrated flux density of the Crab nebula from the SCUBA 850-m observations is Jy. This was determined by integrating within polygons drawn beyond to boundary of emission from the remnant. The flux density obtained varied by up to per cent, depending on where an individual polygon was drawn. We conservatively take the uncertainty in the integrated flux density to be 10 per cent, to include the uncertainties in choice of polygon to integrate over, the small change in amplitude scaling seen from the observations of CRL 618 above, and any uncertainty in the assumed flux density for CRL 618. As discussed below, this is in good agreement with the prediction of the expected flux density from the extrapolation of the synchrotron spectrum of the Crab nebula at lower frequencies.
4 DISCUSSION
4.1 Sub-mm/Infrared Spectrum
The integrated spectrum of the Crab Nebula is shown in Fig. 5, together with an extrapolation of the synchrotron spectrum into the infrared domain from the UV/optical domain (from Woltjer 1987) and from the radio domain (from Baars et al. 1977). In making the extrapolation from the radio domain we took into account the fact Baars et al. give a fitted spectrum for the synchrotron emission from the Crab nebula for frequencies up to 35 GHz, from observations predominantly made in the late 1960s. Since the Crab nebula is known to be fading at a rate of per cent year-1 at 8 GHz (Aller & Reynolds 1985), the extrapolated spectrum shown in Fig. 5 has been decreased by 5.5 per cent (i.e. corresponding to a period of 33 years, the difference mean date of the observations used by Baars et al. and our observations). The uncertainties in the extrapolation of the Baars et al. spectrum are: (i) the overall uncertainty in amplitude scale (which is , i.e. per cent); (ii) a frequency dependent uncertainty due to the uncertainty in the spectral index (which is ); (iii) any uncertainty if the fading at higher frequencies is different from that measured by Aller & Reynolds at 8 GHz, which is as yet unknown. The uncertainty in the spectral index – using a reference frequency of 7 GHz, which is close to the centre of the frequencies of the observations used by Baars et al. – corresponds to uncertainties of per cent at 850 m, increasing to per cent at 60 m. Adding the uncertainties due to the overall amplitude scale of the fitted spectrum and the spectral index in quadrature gives an uncertainty in the extrapolated spectrum of per cent at 850 m, increasing to per cent at 60 m, as is indicated by the dashed lines at m in Fig. 5. We note the following.
-
1.
The ISOPHOT 170 m flux density is somewhat low compared with the extrapolated Baars et al. spectrum, although this is not highly significant (see further discussion below).
-
2.
Both the 100 and 60 m flux densities show clear evidence for an excess above the extrapolated synchrotron spectrum (see Section 4.2 for further discussion), albeit at a somewhat lower level than has been seen previously from IRAS observations (e.g. Strom & Greidanus). This excess covers a range of frequencies that is too narrow for it to be synchrotron emission. Further evidence that the FIR excess is thermal is provided by the polarisation measurements of Klaas et al. (1999), which show that the excess emission is unpolarised.
-
3.
The 850-m flux density is consistent with the extrapolated Baars et al. spectrum, unlike the 1.2-mm flux density from Bandiera et al. (see further discussion in Section 4.5).
The expected flux density from the extrapolation of the Baars et al. spectrum at 170 m is Jy, whereas the 170 m integrated flux density is Jy (see Table 1). The difference in these values is Jy, which is not highly significant. If this deficit is real, it could be indicative of spectral turnover between 850 and 170 m. Further evidence for a steepening of the FIR synchrotron spectrum at these wavelengths is provided by the differences in the surface brightness distributions at 850 and 170 m (see further discussion in section 4.3). Overall, our data are more consistent with a gradual transition between the radio spectrum and the UV–optical spectrum (Woltjer 1987) spanning the whole of the FIR–near-IR, rather than a sharp break in the mid-IR. Support for a gradual turnover in the infrared synchrotron emission is provided by the ISOCAM CVF measurements of Douvion et al. (2001), which had sufficient spectral resolution to separate the continuum and line components. Douvion et al. found that the continuum emission between 6.5 and 16 m is well described by a power law – i.e. with a slope intermediate between the slopes of the radio and the UV–optical power laws. We have also plotted the MIR continuum spectrum of Douvion et al. in Fig. 5, multiplied by a correction factor of 1.29 to compensate for the fact that Douvion et al. did not image the whole of the Crab nebula. This correction factor was determined from a image of the 2.26 m continuum emission of the nebula by measuring the ratio of the flux density integrated over the whole source to the flux density integrated over a synthetic arcsec2 aperture representing the ISOCAM field of view. Also shown in Fig. 5 is the integrated continuum flux density found from an image (Gallant & Tuffs 2002) in photometric conditions in 1997 using the Calar Alto 3.5-m telescope in a narrow band () filter centred at 2.26 m. The intrinsic continuum flux density at 2.26 m of the nebula is Jy, which is the measured flux density (after star subtraction) of Jy, divided by 0.839 to correct for extinction, following the extinction law found for stars in the field of the nebula by Wu (1981). The extrapolation to shorter wavelengths of the Douvion et al. power law (scaled to the integrated emission from the nebula) passes close to the 2.26 m point, and the extrapolation to longer wavelengths intersects with the extrapolation of the radio spectrum at around 400 m.

4.2 ISOPHOT 60 and 100 m images
At all three FIR wavelengths the smooth synchrotron emission seen at longer wavelengths is clearly evident. For comparison, the SCUBA 850-m image has been convolved to the ISOPHOT beam at 100 m, see Fig. 6. However, at 60 and 100 m two prominent features, separated by arcsec and connected by a ridge running almost east-west. To a precision of 10 arcsec the positions of the peaks (J2000) are , for the western peak and , for the eastern peak. The corresponding offsets from the current position of the pulsar are: 45 arcsec W, 22 arcsec S and 30 arcsec E, 7 arcsec S, respectively, and the corresponding offsets from Star 16 of Wyckoff & Murray (1977) are 48 arcsec W, 25 arcsec S and 27 arcsec E, 10 arcsec S. These features are close to the peaks in the image of the [O iii] line emission, from Lawrence et al. (1995), convolved to the resolution of the ISOPHOT 100-m image, which is shown in Fig. 7. Within the positional uncertainties, the eastern and western peaks coincide with absorption spots 3C and 1D, respectively, of Fesen & Blair (1990). Part of the eastern peak was imaged by the HST by Blair et al. (1997). The prominent sinuous dust shadow of extent 25 arcsec seen on the HST images lies within 15 arcsec of the FIR emission peak which – like its Western counterpart – appears slightly resolved in the ISOPHOT images. We have scaled the 850 m image, assuming a power-law extrapolation to 100 m (with a spectral index of 0.30), and removed this from the observed 100 m image. Fig. 7 also shows this synchrotron removed 100 m image. The fact that there is evidently less extended emission in the NW at 100 m than is expected from a power-law extrapolation from lower frequencies is consistent with the discussion in Section 4.3, that is a spectral turnover between 850 and 170 m.


The correspondence between the 60 and 100 m peaks, and the smoothed [O iii] emission image, together with the absence of corresponding peaks of synchrotron emission at 850 m, suggests that these FIR features are produced through a thermal emission mechanism. The excess emission could potentially arise from dust (either in the ejecta or a circumprogenitor medium), or could be FIR fine structure line emission (also either from ejecta or from a circumprogenitor medium). In order to determine whether the FIR excess could be due to line emission, we compared the ISOPHOT surface brightnesses in the principle lines with the ISOPHOT surface brightnesses seen at the same positions on maps convolved with the LWS beam – see Table 2. We considered the principal lines seen in the spectral range covered by the C60 and C100 ISOPHOT filters, which are [O iii] 52 m, [O i] 63 m and [O iii] 88 m. In all positions at most 11 per cent of the emission seen in the C100 and C60 filters can be attributed to line emission. In addition, this percentage seems to be independent of position in the nebula. Therefore, it appears that the ‘FIR bump’ in the integrated spectra is not due to line emission, and furthermore that the two compact sources seen on the ISOPHOT 60 and 100 m images are also not due to line emission. Essentially none of the emission seen in the C160 filter is due to line emission.
| flux density | ||||
| wavelength | measured | synchrotron | line | dust |
| (m) | (Jy) | (Jy) | (Jy) | (Jy) |
| 170 | – | |||
| 100 | 9 | |||
| 60 | 11 | |||
We conclude that the excess emission in the FIR bump (and which is most prominently in the peaks seen in Fig. 7) is primarily due to dust emission. The difference between the relative brightness of these peaks – i.e. at 100 m, the eastern peak is brighter, whereas at 60 m, the western peak is brighter – would then reflect different dust temperatures in the peaks, caused by differences in the strength and/or colour of the local radiation field. To estimate the mass of grains needed to account for the FIR bump we nevertheless approximate the integrated emission in the bump as arising from either silicate or graphite grains at a single temperature, with optical properties given by Laor & Draine (1993). The FIR dust emission 60 and 100 m was calculated – see Table 3 – by subtracting from the observed flux densities the contributions due to line emission (calculated from an average of the entries in Table 2 to be a fraction 0.08 and 0.07 of the total emission in the C60 and C100 filters, respectively) and an extrapolation of the MIR pure synchrotron power law ( Jy, as derived from the ISOCAM measurements of Douvion et al. in Section 4.1). The uncertainties in the derived dust flux densities are dominated by the uncertainties in the measured flux densities. Table 3 also includes estimates of the synchrotron and dust emission at 170 m. The dust emission at 60 and 100 m is consistent with a small amount of warm dust ( M⊙ of silicate at temperatures around 45 K or M⊙ of graphite at temperatures around 50 K). The geometry of this warm dust emission is consistent with a torus of diameter pc, presumably created by the supernova progenitor. There is no evidence for dust emission towards the dark bays in the optical emission from the remnant in the east and west (Fesen, Martin & Shull 1992).
It should be emphasised that the main reason that the FIR bump can be accounted for by such a moderate quantity of grains is the lack of any evidence for emission from cold dust in the 170 m band of ISOPHOT, which is the most sensitive of our measured bands for detecting grains with temperatures in the K range. Our nominal estimate for the integrated flux density of the total dust emission at 170 m is Jy, a number obtained by subtracting a synchrotron flux density estimated from an extrapolation of the long wavelength radio spectrum from the total measured flux density, and assuming line emission can be neglected in this band (see Table 2). At 170 m, the Rayleigh–Jeans tail of the warm dust emission detected at 60 and 100 m is expected to contribute up to 14 Jy, implying only Jy might be attributable to cold dust, i.e. at nearly the 3 level, our observations are consistent with there being no cold dust in the nebula. A limit from any cold dust component of 3 Jy at 170 m, assuming a grain temperature of 15 K, would correspond to upper limits of M⊙ and M⊙ from cold dust in the form of graphite and silicate, respectively (for a distance of 2 kpc). These upper limits are however very crude, since the grain temperature of any cold dust is not well constrained by our data. Moreover, if the synchrotron spectrum is turning over at 170 m – as is suggested in Section 4.3 below – then the simple extrapolation of the synchrotron emission from larger wavelengths is likely to overestimate the synchrotron emission somewhat. A constraint on any cold dust arising from the positions of the warm dust emission peaks is provided by the almost identical morphology seen at 850 m and the 20 cm pure synchrotron image (Figs 4 and 9). This suggests that at most Jy of the 850-m emission can arise from cold dust at each peak, which corresponds to respective upper limits of M⊙ and M⊙ of graphite and silicate assuming a grain temperature of 15 K.
4.3 Comparison of 170- and 850-m images
The ISOPHOT 170 m image shows a centrally brightened structure reminiscent of that seen at longer wavelengths (i.e. synchrotron emission), with no indication of the peaks seen at 100 and 60 m. However, detailed comparison of the 170 m image with the JCMT 850-m image, which we take to be synchrotron emission, does reveal differences in the details of the emission structure at these two wavelengths. Fig. 8 shows the 850-m image smoothed to the resolution of the ISOPHOT 170 m image. Comparison with Fig. 2 shows that the peak of the 170-m emission (near , ), is displaced by about 40 arcsec to the south of the 850-m peak (near , ), which is much larger than any expected uncertainties in the positional accuracy of the images. Moreover, the 170-m emission is relatively fainter in the NW compared with the expected extrapolation of the synchrotron emission from 850-m (see Fig. 7). One explanation of this, which would also explain the ISOPHOT 170 m flux density being low, is that the effect of a break in the synchrotron spectrum is becoming evident, but predominantly in the NW of the remnant, at wavelengths between 850 and 170 m. We note that the optical extent of the Crab nebula agrees well with the radio extent of the remnant everywhere except in the NW (see Velusamy et al. 1984), where the cm-wavelength radio emission extends beyond the optical emission. Sankrit & Hester (1997) note that there is no [O iii] ‘skin’ in the N and NW where the radio emission extends beyond the optical. Generally is has long been recognised (e.g. Woltjer 1987) that the extent of the synchrotron emission decreases with increasing frequency (i.e. energy), due to smaller lifetime of the more energetic particles responsible for the higher energy emission. However, it is not clear how to relate the deficit of the optical, thermal, emission to a spectral turnover at lower frequencies for the non-thermal synchrotron emission in the NW.
4.4 Dust in the remnant
One of the important results of this investigation is the discovery that the dust in the Crab Nebula is preferentially associated with the east–west chain of filaments seen predominantly in [O iii], lying just south of the position of the pulsar. This bears some resemblance to the situation in Cas A, where MIR emission from dust is seen from the [O iii]-emitting fast optical filaments (Lagage et al. 1996), but contrasts with the situation in Kepler’s SNR, where the MIR emission appears to be associated with circumstellar dust (Douvion et al. 2001). These filaments are also Helium-rich and have previously been hypothesised to be associated with circumstellar material responsible for the asymmetry in the north–south expansion of the nebula (MacAlpine et al. 1989; Lawrence et al. 1995; Fesen, Shull & Hurford 1997). Thus, the dust associated with these filaments may well also be of circumstellar origin. The ISOPHOT 60 and 100 m images reveal the extent and geometry of the dust-rich circumstellar matter in the nebula, showing it to be consistent with a torus of diameter arcsec (or 0.8 pc for a distance of 2 kpc). This can be compared with the circumstellar ring around SN 1987A, which has also been shown to be a dust emission source (Fischera, Tuffs & Völk 2002a), and which has a diameter of 1.3 pc. Unlike the Crab, which is thought to have had a red supergiant progenitor, the progenitor of SN 1987A was a blue supergiant star and left no detectable pulsar-powered nebula behind. The occurrence of quite similar structures associated with such different progenitors suggests that dusty circumstellar rings may be commonly associated with supernovae (see also Pozzo et al. 2004, who show evidence for circumstellar dust around SN 1998S).
About half of the dust emission in the Crab Nebula can be attributed to the dust torus, and assuming that radiation fields illuminating the grains in the filaments are not strongly dependent on position within the nebula or on the chemical composition of the filament, about half of the total dust mass might be circumstellar in origin. We note however that, as in case of SN 1987A, the mass of dust in the circumstellar medium measured today could be much lower than that present prior to ad 1054, due to evaporation of grains by the ultraviolet-flash from the supernova outburst and subsequent sputtering when the blast wave reached the circumstellar medium (Fischera, Tuffs & Völk 2002b). This would also modify the grain size distribution by reducing the abundance of small grains in relation to large grains. Tentative evidence for large grains sizes in comparison with typical interstellar grains is indeed provided from a comparison of the near-UV and optical obscuration in HST images (Blair et al. 1997), which shows that the extinction curve is rather flat.
The remaining per cent of the dust emission can plausibly be identified as emanating from supernova condensates in the broadly distributed filaments distributed over the face of the nebula. However, the total mass of grains in condensates which can be inferred from our data is at most a few hundredths of a solar mass. Comparison with the total mass of filaments of M⊙ (mainly in the form of Helium) in the nebula (Fesen, Shull & Hurford 1997) indicates that the total dust-to-gas ratio in the nebula is in fact at most only of the same order as the interstellar value of . Thus, even if the condensates seen at the present epoch could ultimately escape the remnant without being destroyed, the surrounding ISM will not be significantly enriched in dust. In fact the supernova remnant may have the opposite effect – i.e. to dilute the surrounding ISM of grains. We conclude, therefore, that the progenitors of events like that of ad 1054 are not significant sources of interstellar dust.
Our observations provide meaningful upper limits on the amount of Carbon that can be ‘hidden’ in grains in the nebula. The Carbon abundance in the nebula is of particular importance to our understanding of the progenitor. Carbon abundances in the gas phase show that the ejecta is Helium rich, but not Carbon rich, which places an upper limit222Stars more massive than 8 M⊙ are expected to dredge up freshly synthesised Carbon from the core regions into the He-rich zone, e.g. Nomoto et al. (1992). on the progenitor mass of M⊙ when it was on the main sequence (Davidson et al. 1982). However, this estimate assumes that all the Carbon is in the gas phase. In the extreme case that all the grains are made of graphite, we infer a maximum mass of solid state Carbon of M⊙. This can be compared with the maximum possible amount of Carbon present in the filaments if they had not been significantly enriched in Carbon produced by nucleosynthesis in the star. Assuming solar abundances (Anders & Grevesse 1989) this is a fraction 0.0022 of the M⊙ mass of the filaments, which is M⊙. This mass is very close to our upper limit on the Carbon mass of M⊙ which can be in the form of graphite. We therefore conclude that for the Crab Nebula we have found no evidence for a substantial boosting of the mass of Carbon in the filaments through the presence of Carbon in the solid state.
4.5 Synchrotron Spectral index variations: cm to sub-mm
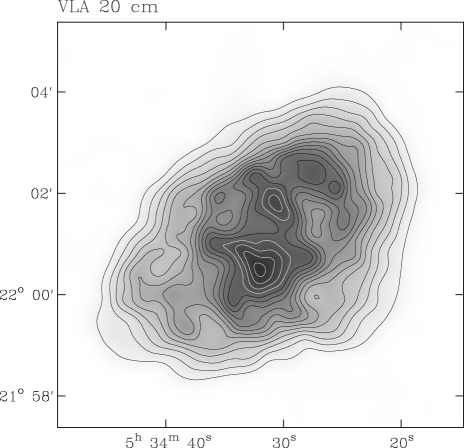
For a spectral index study of the synchrotron emission from the remnant, the SCUBA image was compared with a VLA image at 20 cm (1515 MHz), which was kindly supplied by Michael Bietenholz. The VLA image is made from four arrays of VLA data observed in 1987 (see Bietenholz & Kronberg 1991, Bietenholz et al. 1997). For comparison with the SCUBA image, the VLA image was: (i) scaled by 1.6 per cent in size, as is appropriate for a convergence epoch of ad 1233 for the expansion of the Crab nebula (Bietenholz et al. 1991) and the difference in epochs of the 850-m and 20-cm observations, and (ii) smoothed to a resolution of 17 arcsec to match that of the SCUBA image, see Fig.9. (The flux density scale of the VLA image was not changed, as the expected secular change between 1987 and 1999 is small – per cent – compared with the overall uncertainty in the flux density scales of the observations.) The contour levels in Figs 4 and 9 have been chosen to be at similar relative levels. The 20-cm image is of higher quality, both in terms of its lower noise and the accuracy of the local baselevels. The close similarity between these images – which are at wavelengths that differ by a factor of over two hundred – show that there is no strong spectral index variation across the remnant. Hence, these results show that the particle populations responsible for the radio and sub-mm synchrotron emission are distributed very similarly within the Crab nebula.
An image of the spectral index between 20 cm and 850 m, is shown in Fig.10. The spectral index, , has been calculated where the 850-m emission exceeds 0.17 Jy beam-1. The random uncertainties in the derived spectral indices are dominated by the uncertainties in the 850-m image, not the 20-cm image. Consequently a 850-m contour at Jy beam-1 is also shown on Fig.10 (i.e. at approximately eight times the variation in the background level of the SCUBA image, so the uncertainty in the derived spectral index is less than 0.02 inside this contour). These spectral indices are not absolute, as the flux density scales of the images are not themselves correct in an absolute sense; a 10 per cent systematic shift in either of the flux density scales corresponds to a constant shift by 0.018 in the derived flux density. The spectral index over most of the Crab nebula, particularly in regions of the brighter emission, shows very little variation, with the spectral index being typically between 0.29 and 0.33, with no obvious systematic indication of spectral steepening towards the edge of the remnant. In comparison with Bandiera et al.’s results, Fig. 10 is less noisy, and also covers a larger area, particularly to the SW. Bietenholz et al. (1997) provide somewhat stronger limits on spectral variations of the radio emission across the Crab nebula, but over a much narrower range of frequencies than for our results.
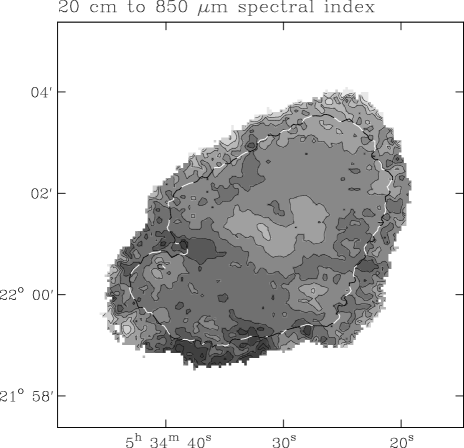
There is a slight general gradient of spectral index across the remnant, from the NW (slightly flatter) to the SE (slightly steeper). This gradient may be an artefact due either to: (i) a positional offset between the images, or (ii) different effective sampling of the large scale structure at 850-m compared to 20-cm. It is not thought possible that systematic uncertainties in the positions of the 850-m and 20-cm images could be large enough to produce spectral gradient seen. But, given the quite different observational techniques used at 850 m and 20 cm, the apparent small spectral index gradient across the remnant may well be due to differences in effective sampling of large-scale structures at the two wavelengths. However, if the spectral gradient is real, the variation may be due to differences in the spectra of the particles injected into the NW and SE parts of the Crab nebula from its central pulsar, or may reflect different environments (e.g. magnetic fields) in the NW part of the Crab nebula compared with the SE. In X-rays – for example from recent Chandra observations (Weisskopf et al. 2000) – there is also a NW to SE asymmetry (with the NW being brighter), indicating that there are differences in the energetic relativistic particles and magnetic fields responsible for the X-ray emission.
The main deviation in spectral index away from the large-scale gradient occur near the centre of the remnant – particularly near the position of the pulsar – where there are regions with slightly flatter spectra than their surroundings. The most pronounced region of flatter spectral index is about an arcmin in maximum extent, elongated NE to SW, centred on the Crab’s pulsar (at , ), with another somewhat smaller region of flatter spectrum emission slightly to the NW. These regions of flatter spectral index were also seen by Bandiera, who interpreted them – along with their apparent excess in integrated flux density at 1.2 mm – as evidence for a second synchrotron component. Although these regions of apparent flatter spectrum emission near the centre of the remnant may be indicative of real spectral variations, it must also be remembered that images used for the spectral comparison are from different epochs (which also applies to Bandiera et al.’s comparison). Instead the spectral variations near the centre of the remnant may reflect temporal variations. Bietenholz et al. (2004) show clear variations in the structure of the radio emission from the Crab nebula at 5 GHz in an region, arcmin2 in extent around the Crab pulsar, aligned approximately NE to SW. This corresponds closely with the central region with the largest deviation in spectral index from the typical values seen in Fig.10.
Other deviations in spectral index, are regions showing flatter spectrum emission in the SW (near , , together with the region just to the NE centre of the remnant (near , ) – both also by Bandiera et al. – and a region of steeper spectrum emission in the W (near , ).
Overall there is little variation in spectral index over the face Crab nebula, over a wide range of frequencies. However, unlike Bandiera et al. we do not see the need to invoke an additional synchrotron component to explain the emission from the Crab nebula, because: (i) we do not find any obvious excess in the integrated flux density of the Crab nebula at 850-m, and (ii) the correspondence between the central region of flatter spectrum emission and that showing temporal variations implies that the apparent flatter spectral index may well be due to temporal variations.
5 CONCLUSIONS
Here we have presented FIR and sub-mm images of the Crab nebula, which we have used to investigate both thermal and non-thermal emission from this supernova remnant. The 60 and 100 m ISOPHOT observations show clear excess of emission above the extrapolated synchrotron radio spectrum at lower frequencies (as has been see previously from IRAS observations). With the improved angular resolution of the ISOPHOT images, this excess is seen to come predominantly from two peaks, to the east and west of the centre of the remnant. From out studies of the LWS spectra we have shown that this excess indicates the presence of a small amount of warm dust (consistent with M⊙ of silicate at temperatures around 45 K or M⊙ of graphite at temperatures around 50 K) in the remnant. The distribution of this dust is consistent with a torus of diameter pc created by the supernova progenitor prior to its explosion, superimposed upon a broadly distributed component which may be supernova condensates in the filaments. Since the dust-to-gas ratio in the filaments is comparable to the interstellar value, even if the condensates seen at the present epoch could ultimately escape the remnant without being destroyed, the surrounding ISM will not be significantly enriched in dust. Our upper limit of M⊙ on the total mass of Carbon in the form of graphite is consistent with the inference from the gas-phase Carbon abundances that there has been no significant synthesis of Carbon in the progenitor during its lifetime. The lower resolution 170 m ISOPHOT image does not show any excess emission, but instead is possibly fainter, particularly in the NW, than expected from an extrapolation of the lower-frequency radio synchrotron spectrum. These, and other observations, are consistent with the synchrotron spectrum becoming gradually steeper throughout the FIR spectral range covered by the ISOPHOT observations. The flux density of the Crab nebula from SCUBA 850-m observations is consistent with an extrapolation of radio synchrotron spectrum from lower frequencies. Comparison of the 850-m image with a 20-cm VLA image shows there is little variation in spectral index across the face of the remnant between these wavelengths. Although there are some spectral variations near the centre of the remnant, as has been seen previously, we do not see the need for the second radio synchrotron component, such as that proposed by Bandiera et al.
Acknowledgements
We are grateful to S. Lawrence and M. Bietenholz for making available their [O iii] and 20-cm images of the nebula in [O iii], and to D. Pierce-Price and J. Richer and for help and advice with the MEM processing of the JCMT data. The ISOPHOT data presented in this paper were reduced using P32Tools, a PHT32 processing and transient correction program developed at the Max-Planck-Institut für Kernphysik, and incorporated into PIA (the interactive analysis package for ISOPHOT) by the ISO Data Centre of the ESA Research and Scientific Support Department in collaboration with the Infrared Processing and Analysis Center (IPAC). PIA is a joint development by the ESA Astrophysics Division and the ISOPHOT Consortium with the collaboration of IPAC. Contributing ISOPHOT consortium institutes are the Dublin Institute for Advances Studies, the Rutherford Appleton Laboratory, the Astrophysics Institute Potsdam, the Max-Planck-Institut für Kernphysik, and the Max-Planck-Institut für Astronomy. The JCMT is operated by the Joint Astronomy Centre in Hilo, Hawaii on behalf of the parent organisations Particle Physics and Astronomy Research Council in the United Kingdom, the National Research Council of Canada and The Netherlands Organization for Scientific Research.
References
- [1] Aller H. D., Reynolds S. P., 1985, ApJ, 293, L73
- [2] Anders E., Grevesse N., 1989, Geochim. Cosmochim. Acta, 53, 197
- [3] Baars J. W. M., Genzel R., Pauliny-Toth I. I. K., Witzel A., 1977, A&A, 61, 99.
- [4] Bandiera R., Neri R., Cesaroni R., 2002, A&A, 386, 1044
- [5] Beichman C., Neugebauer G., Habing H. J., Clegg P. E., Chester T. J., 1988, eds Infrared Astronomical Satellite (IRAS) Explanatory Supplement, NASA, RP-1190
- [6] Bietenholz M. F., Kronberg P. P., 1991, ApJ, 368, 231
- [7] Bietenholz M. F., Kronberg P. P., Hogg D. E., Wilson A. S., 1991, ApJ, 373, L59
- [8] Bietenholz M. F., Kassim N., Frail D. A., Perley R. A., Erickson W. C., Hajian A. R., 1997, ApJ, 490, 291
- [9] Bietenholz M. F., Frail D. A., Hester J. J., 2001, ApJ, 560, 254
- [10] Bietenholz M. F., Frail D. A., Hester J. J., 2004, ApJ, in press
- [11] Blair W. P., Davidson K., Fesen R. A., Uomoto A., MacAlpine G. M., Henry R. B. C., 1997, ApJS, 109, 473
- [12] Caraveo P. A., Mignani R. P., 1999, A&A, 344, 367
- [13] Clegg P. E., Ade P. A. R., Armand C., Baluteau J.-P., Barlow M. J., Buckley M. A., Berges J.-C., Burgdorf M., Caux E., Ceccarelli C., Cerulli R., Church S. E., Cotin F., Cox P., Cruvellier P., Culjane J. L, Davis G. R., Di Giorgio A., Diplock B. R., Drummond D. L., Emery R. J., Ewart D., Fischer J., Furniss I., Glencross W. M., Greenhouse M. A., Griffin M. J., Gry C., Harwood A. S., Hazell A. S., Joubert M., King K. J., Lim T., Liseau R., Long J. A., Lorenzetti D., Molinari S., Murray A. G., Naylor D. A., Nisini B., Noran K., Omont A., Orfei R., Patrick T. J., Péquignot D., Pouliquen D., Price M. C., Nguyen-Q-Rieu, Rogers A. J., Robinson F. D., Saisse M., Saraceno P., Serra G., Sidher S. D., Smith A. F., Smith H. A., Spinoglio L., Swinyard B. M., Texier D., Towlson W. A., Trams N., Unger S. J., White G. J., 1996, A&A, 315, L38.
- [14] Davidson K., Gull T. R. Maran S. P. Stecher T. P., Fesen R. A., Parise R. A., Harvel C. A., Kafatos M., Trimble V. L., 1982, ApJ, 253, 696
- [15] Douvion T., Lagage P. O., Cesarsky C. J., Dwek E., 2001, A&A, 373, 281
- [16] Dunne L., Eales S., Ivison R., Morgan H., Edmunds M., 2003, Nat, 424, 285
- [17] Dwek E., 2004, ApJS, 607, 848
- [18] Fesen R. A., Blair W. P., 1990, ApJ, 351, L45
- [19] Fesen R. A., Martin C. L., Shull J. M., 1992, ApJ, 399, 599.
- [20] Fischera Jg., Tuffs R. J., Völk H. J., 2002a, A&A, 386, 517
- [21] Fischera Jg., Tuffs R. J., Völk H. J., 2002b, A&A, 395, 189
- [22] Gabriel C., Acosta-Pulido J., Heinrichsen I., Morris H., Tai W.-M., 1997, in Hunt G., Payne H. E., eds, Astronomical Data Analysis Software and Systems VI, ASP Conference Series, Vol. 125, ASP, San Francisco, p.108
- [23] Gallant Y.A., Tuffs R.J., 2002, in Slane P. O., Gaensler B. M., eds, Neutron Stars in Supernova Remnants, ASP Conference Series, Vol. 271, ASP, San Francisco, p.161
- [24] Green D. A. 2002, in Slane P. O., Gaensler B. M., eds, Neutron Stars in Supernova Remnants, ASP Conference Series, Vol. 271, ASP, San Francisco, p.153
- [25] Green D. A., Scheuer P. A. G., 1992 MNRAS 254, 686
- [26] Holland W. S., Robson E. I., Gear W. K., Cunningham C. R., Lightfoot J. F., Jenness T., Ivison R. J., Stevens J. A., Ade P. A. R., Griffin M. J., Duncan W. D., Murphy J. A., Naylor D. A. 1999, MNRAS, 303, 659
- [27] Jenness T., Lightfoot J. F., 2000, SURF – SCUBA User Reduction Facility, Starlink User Note 216. 7, Joint Astronomy Centre, Hilo, Hawaii
- [28] Kessler M. F., Steinz J. A., Anderegg M. E., Clavel J., Drechsel G., Estaria P., Faelker J., Riedinger J. R., Robson A., Taylor B. G., Ximénez de Ferrán S., 1996, A&A, 315, L27–L31
- [29] Klaas U., Muller T. G., Laureijs R. J., Clavel J., Lagerros J. S. V., Tuffs R. J., Moneti A., Kreysa E., Kratschmer W., 1999, in Cox P., Kessler M.P., eds, The Universe as Seen by ISO, ESA-SP 427, p.77
- [30] Lagage P. O., Claret A., Ballet, J. Boulanger F., Cesarsky C. J., Cesarsky D., Fransson C., Pollock, A., 1996, A&A, 315, L273
- [31] Laor A., Draine B. T., 1993, ApJ, 402, 441
- [32] Lawrence S. S., MacAlpine G. M., Uomoto A., Woodgate B. E., Brown L. W., Oliversen R. J., Lowenthal J. D., Liu C., 1995, AJ, 109, 2635
- [33] Lemke D., Klaas U., Abolins J., Ábrahám P., Acosta-Pulido J., Bogun S., Castaneda H., Cornwall L., Drury L., Gabriel C., Garzón F., Gemünd H. P., Groezinger U., Grün E., Haas M., Hajduk C., Hall G., Heinrichsen I., Herbstmeier U., Hirth G., Joseph R., Kinkel U., Kirches S., Kömpe C., Krätschmer W., Kreysa E., Krueger H., Kunkel M., Laureijs R., Lützow-Wentzky P., Mattila K., Müller T., Pacher T., Pelz G., Popow E., Rasmussen I., Rodríguez Espinosa J., Richards P., Russell S., Schnopper H., Schubert J., Schulz B., Telesco C., Tilgner C., Tuffs R., Völk H., Walker H., Wells M., Wolf J., 1996, A&A, 315, L64
- [34] Li Z.-Y., Begelman M. C., 1992, ApJ, 400, 186
- [35] Lloyd C., 2003, in Metcalfe L., Salama A., Peschke S. B., Kessler M. F., eds, The calibration legacy of the ISO Mission, European Space Agency, ESA SP-481, p.399
- [36] MacAlpine G. M., McGaugh S. S., Mazzarella J. M., Uomoto A., 1989, ApJ, 342, 364
- [37] Marsden P. L., Gillett F. C., Jennings R. E., Emerson J. P., de Jong T., Olnon F. M., 1984, ApJ, 278, L29
- [38] Mezger P. G., Tuffs R. J., Chini E., Kreysa E., Gemünd H.-P., 1986, A&A, 167, 145
- [39] Morgan H. L., Edmunds M.G., 2003, MNRAS, 343, 427
- [40] Morgan H. L., Dunne L., Eales S., Ivison R., Edmunds M., 2003, ApJ, 597, L33
- [41] Nomoto K., Sugimoto D., Sparks W. M., Fesen R. A., Gull T. R., Miyaji S., 1984, Nat, 257, 780
- [42] Nomoto K., 1985, in Kafatos M. C., Henry R. B. C., eds, The Crab Nebula and Related Supernova Remnants, Cambridge University Press, p.97
- [43] Pierce-Price D. P. I., 2001, PhD thesis, University of Cambridge
- [44] Pozzo, M., Meikle, W. P. S., Fassia, A., Geballe, T., Lundqvist, P., Chugai, N. N., Sollerman, J. 2004, MNRAS, 352, 457
- [45] Sandell G., 1994, MNRAS, 271, 75
- [46] Sankrit R., Hester J. J., 1997, ApJ, 491, 796
- [47] Stephenson F. R., Green D. A., 2002, Historical Supernovae and their Remnants, Oxford University Press
- [48] Strom R. G., Greidanus H., 1992, Nat, 358, 654
- [49] Trimble V., 1973, PASP, 85, 579
- [50] Tuffs R. J., Gabriel C., 2003, A&A, 410, 1075
- [51] Tuffs R. J., Popescu C. C., Pierini D., Völk H. J., Hippelein H., Leech K., Metcalfe L., Heinrichsen I., Xu C., 2002, ApJS, 139, 37
- [52] Velusamy T., 1985, Nat, 212, 359
- [53] Weisskopf M. C., Hester J. J., Tennant A. F., Elsner R. F., Schulz N. S., Marshall H. L., Karovska M., Nichols J. S., Swartz D. A., Kolodziejczak J. J., O’Dell S. L., 2000, ApJ, 536, L81
- [54] Woltjer L., 1987, in Pacini F., ed., High energy phenomena around collapsed stars, D. Reidel, Dordrecht, p.209
- [55] Wu C.-C., 1981, ApJ, 245, 581
- [56] Wyckoff S., Murray C.A., 1977, MNRAS, 180, 717