High resolution observations of SiO masers: comparing the spatial distribution at 43 and 86 GHz
We present sub-milliarcsecond observations of SiO masers in the late-type stars IRC +10011 and Cyg. We have used the NRAO Very Long Baseline Array (VLBA) to map the 43 GHz (=1, 2 =1–0) and the 86 GHz (=1, 2 =2–1) SiO masers. All the transitions have been imaged except the =2 =2–1 in IRC +10011. We report the first VLBI map of the =1 =2–1 28SiO maser in IRC +10011 as well as the first VLBA images of SiO masers in an S-type Mira variable, Cyg. In this paper we have focused on the study of the relative spatial distribution of the different observed lines. We have found that in some cases the observational results are not reproduced by the current theoretical pumping models, either radiative or collisional. In particular, for IRC +10011, the =1 =1–0 and =2–1 28SiO lines have different spatial distributions and emitting region sizes, the =2–1 emission being located in an outer region of the envelope. For Cyg, the distributions also differ, but the sizes of the masing regions are comparable. We suggest that the line overlaps between ro-vibrational transitions of two abundant molecular species, H2O and 28SiO, is a possible explanation for the discrepancies found between the observations and the theoretical predictions. We have introduced this overlapping process in the calculations of the excitation of the SiO molecule. We conclude that the line overlaps can strongly affect the excitation of SiO and may reproduce the unexpected observational results for the two sources studied.
Key Words.:
masers – technique: interferometric – stars: circumstellar matter – stars: AGB and post-AGB1 Introduction
Circumstellar SiO maser emission is detected in Long Period Variables (AGB-stars): Mira-type, semi-regular and irregular variables, and OH/IR stars; of M and S spectral types. Due to the strong energy requirements for the pumping of these masers, they are produced in the innermost shells of the circumstellar envelopes around these stars, where the gas density and stellar radiation field are important. On the other hand, this amplified emission is very bright and compact, therefore being an ideal target for Very Long Baseline Interferometric (VLBI) studies. In fact, VLBI observations are the only way to accurately map the structure of the SiO maser emitting regions, providing angular resolutions up to several 0.1 mas (Colomer et al. colomer (1992)).
First estimations of the location of the SiO maser emission were derived from single-dish observations and from theoretical modelling (see e.g. Alcolea et al. alcolea0 (1989); Bujarrabal et al. bujarrabal1 (1981)). These works already suggested that the SiO masers originate at distances of a few stellar radii from the central star, between the extended atmosphere and the dust-formation point. This has been confirmed in subsequent VLBI measurements (Danchi et al. danchi (1994); Greenhill et al. greenhill (1995); Wittkowski & Boboltz wittkowski (2003)) and in addition, that the distribution of the emission consists of ring-like structures composed of multiple maser spots with typical sizes of a few mas (Diamond et al. diamond1 (1994); Greenhill et al. greenhill (1995); Desmurs et al. desmurs2 (2000)). VLBI monitoring of the SiO maser emission probes the kinematics of the gas in these inner shells, revealing inward/outward motions (Boboltz et al. boboltz1 (1997); Diamond & Kemball diamond2 (2003)) or showing indications of rotation of the maser shell in some peculiar objects (Boboltz & Marvel boboltz2 (2000); Hollis et al. hollis (2001); Sánchez Contreras et al. sanchez (2002)).
| source | R.A. | Dec. | variability | a | period b | phase c | dist. d | e |
|---|---|---|---|---|---|---|---|---|
| (J2000) | (J2000) | type | ( yr-1) | (days) | (kpc) | (km s-1) | ||
| IRC +10011 | 01h06m2599 | +12°35′533 | OH/IR | 8.1 | 630 | 0.10 | 0.47 | 9.2 |
| Cyg | 19h50m3392 | +32°54′506 | Mira | 4.1 | 408 | 0.25 | 0.11 | 10.2 |
a Mass loss values derived following Loup et al. (loup (1993)) but for the distances adopted here.
b Periods form Pardo et al. (pardo (2004)).
c Stellar phases at the time of the observation: for IRC +10011, extrapolated value
from Pardo et al. (pardo (2004)) with respect to the NIR maximum (the typical phase lag between IR/SiO and
optical maxima is 0.1 periods). For Cyg, the optical phase derived from the
light curve provided by the AAVSO (see http://www.aavso.org).
d Distances from Herman et al. (herman1 (1985)) for IRC +10011 and from the HIPPARCOS catalogue
for Cyg.
e Systemic velocity from high resolution CO observations by Cernicharo et al. (cernicharo (1997))
and Bujarrabal et al. (bujarrabal3 (1989)) respectively.
These observations also provide very valuable constraints for the theoretical models accounting for the origin and pumping of these masers, which are needed in order to understand the mechanism itself and to derive the physical conditions of the maser emitting regions from the observations. These theoretical models are divided in radiative and collisional, the main differences between both types being the main process that provides the energy to maintain the inversion of the population and therefore produce the maser transitions. The responsible mechanism in the case of the radiative models is the IR radiation from the central star (e.g. Bujarrabal 1994a , 1994b ), whereas in the collisional models the energy is obtained from the kinetic energy of the gas (e.g. Lockett & Elitzur lockett (1992)).
Most of the VLBI observational results on SiO masers have been obtained mainly in M-type Mira stars (simply because they typically present stronger maser emission than the other types of variables) and from observations of the 7 mm rotational transitions of 28SiO: =1 and 2 =1–0 lines. Successful VLBI observations of the 3 mm =2–1 rotational transition were made by Doeleman et al. (doeleman (1998)) and Phillips & Boboltz (phillips1 (2000)) towards the late type stars VX Sgr and Cet, which helped in the study of the spatial structure of these 3 mm SiO masers. Nowadays, using the NRAO111The National Radio Astronomy Observatory is a facility of the National Science Foundation operated under cooperative agreement by Associated Universities, Inc. Very Long Baseline Array (VLBA), which was upgraded to operate at 3 mm wavelength in 2001, it is possible to compare the observed results at 3 mm with those at 7 mm (Phillips et al. phillips2 (2003)). As we will see, the comparison of these quasi simultaneous observations with the theoretical predictions for the =2–1 lines will further constrain the models proposed to explain the physics involved in the SiO maser phenomenon.
Making use of its new observational capabilities at 3 mm, we have started multi-epoch/multi-transitional high resolution observations of SiO masers using the VLBA in a sample of long period variable stars. We have studied the SiO maser emission in the sources IRC +10011, Cyg and TX Cam. In particular we have observed the =1, =2 =1–0 and =2–1 transitions of 28SiO and the =0 =1–0 and =2–1 lines of the 29SiO isotopic substitution (see Sect. 2).
We present in this paper the results obtained in the first epoch for IRC +10011 and Cyg (those for TX Cam will be presented in a separate paper). We report the first VLBI map of the =1 =2–1 28SiO maser in IRC +10011 as well as the first VLBA images of the =1 and =2 =1–0 and =2–1 transitions in an S-type Mira variable, Cyg. We have detected all the observed lines except the 28SiO =2 =2–1 in IRC +10011 and, unfortunately, the 29SiO lines in the two variables. A detailed description of the different maps obtained is given in Section 3.
In Section 4, we study and compare in detail the differences between the maser emissions at 7 mm (=1 and =2 =1–0) and between the 7 and 3 mm (=1 and 2, =2–1 and =1–0). We focus on their relative spatial distribution, in order to compare the observational results with the predictions of the currently proposed pumping models for circumstellar SiO masers. We have found that our results for the 3 and 7 mm comparison are not reproduced by any of these models, since all predict a similar emitting region at both wavelengths (Bujarrabal 1994a ; Humphreys et al. humphreys2 (2000)) and we however obtain a totally different distribution in both IRC +10011 and Cyg. We propose the line overlaps between ro-vibrational transitions of two abundant molecular species, H2O and 28SiO, as a possible explanation of those unexpected results. For this reason, we have also introduced this overlapping process in the calculations and discuss the physical effects. Finally, the main conclusions and results derived from the high resolution observations and theoretical calculations performed are summarized in Section 5.
| setup | number | BW | spectral | spectral | SiO transitions observed |
|---|---|---|---|---|---|
| of IFs | (MHz) | channels | resolution (km/s) | (Left circular polarization only, except when noted) | |
| 7 mm | 4 | 8 | 256 | 0.22 | 28SiO =1 =1–0†; 28SiO =2 =1–0; 29SiO =0 =1–0 |
| 3 mm-A | 2 | 16 | 512 | 0.11 | 28SiO =2 =2–1; 29SiO =0 =2–1 |
| 3 mm-B | 2 | 16 | 512 | 0.11 | 28SiO =1 =2–1† |
† Left and right circular polarizations (LCP & RCP) .
| IRC +10011 | Cyg | ||||||||
| band | species | maser | rest frec. | restoring | # of | masing region | restoring | # of | masing region |
| transition | (MHz) | beam (mas) | spots | size (mas) | beam (mas) | spots | size (mas) | ||
| 7 mm | 28SiO | =1 =1–0 | 43122.080 | 1.10.3 | 9 | 19–24 | 0.70.2 | 6 | 50–62 |
| =2 =1–0 | 42820.587 | 0.40.2 | 11 | 16–21 | 1.00.6 | 1 | — | ||
| 29SiO | =0 =1–0 | 42879.916 | non-det. | — | — | non-det. | — | — | |
| 3 mm | 28SiO | =1 =2–1 | 86243.442 | 0.70.3 | 8 | 28–33 | 0.70.5 | 6 | 50–58 |
| =2 =2–1 | 85640.456 | non-det. | — | — | 0.70.3 | 4 | — | ||
| 29SiO | =0 =2–1 | 85759.132 | non-det. | — | — | non-det. | — | — | |
2 Observations and data analysis
We have performed sub-milliarcsecond resolution observations of SiO masers transitions with the VLBA. We have observed the long period variable stars IRC +10011 on 2002 January 5 and Cyg on 2001 May 9 (Table 1). We have measured the 28SiO rotational lines =1–0 and =2–1 in the =1 and =2 vibrationally states and the =1–0 and =2–1 transitions of the 29SiO isotopic substitution in the ground vibrational state =0.
All available antennas were used at the time of the observations, the entire array (10 antennas) for the 7 mm (43 GHz) and 7 antennas for the 3 mm (86 GHz) observations. The distances between the VLBA antennas range between 236 km (LA-PT), and 8611 km (SC-MK) for the 7 mm and 6156 km (NL-MK) for the 3 mm observations, thus achieving maximum angular resolutions of about 0.17 and 0.12 mas respectively.
The data were correlated at the VLBA correlator in Socorro (New Mexico, USA). The observations for each of the sources consisted of 3 different lines setups, the 7 mm, the 3 mm-A and 3 mm-B, which comprised a total observing time of about 8 h per source. A summary of the observing and correlator setups is presented in Table 2. The - coverages are shown in Fig. 1.
The observations carried out are summarized in Table 3. All the 28SiO transitions observed were detected except the =2 =2–1 maser in IRC +10011 and, unfortunately, none of the 29SiO lines because their flux was below the detection limit (they were not detected in the auto-correlations either).
Using the mentioned setups, the four 7 mm masers were observed simultaneously and the 7 and 3 mm separated only by a few hours. This is important since one of the characteristics of SiO masers is their time variability. From monitoring programs of Mira and other types of regular variables, two types of variability have been reported: long-term variability on time scales of several months (see Alcolea et al. alcolea (1999) and references therein), and changes on shorter time scales, 10-20 days (Pijpers et al. pijpers (1994)). So far no significant variability has been observed on time scales of hours, and therefore our maps of the 7 and 3 mm masers can be directly compared.
The data reduction was performed using the Astronomical Image Processing System (AIPS) package. The calibrator used to calculate the bandpass and single-band delay corrections, which was later applied to the spectral line sources, was 3C 454.3 for both sources.
The amplitude calibration was done by comparing a calibrated total power spectrum of the line source, used as a template, with the autocorrelations measured at each antenna, except in the =1 =2–1 maser in IRC +10011 and in the =2 =2–1 transition in Cyg. In these cases, we used the system temperatures and antenna gains tables provided by the NRAO within the data files.
The determination of the phase calibration was done following the standard method for spectral line VLBI data. Residual phase errors were removed later in a self-calibration process. Finally, the integrated intensity maps were obtained independently for each of the SiO transitions detected, using the image deconvolution CLEAN algorithm.
Note that when the phase calibration is done by means of phase-referencing techniques, the absolute positions in the maps are lost and only relative positions to the reference channel are obtained. This adds a difficulty when comparing two maps since their relative position is unknown.
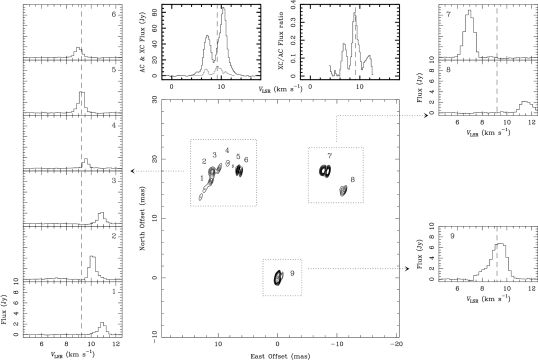
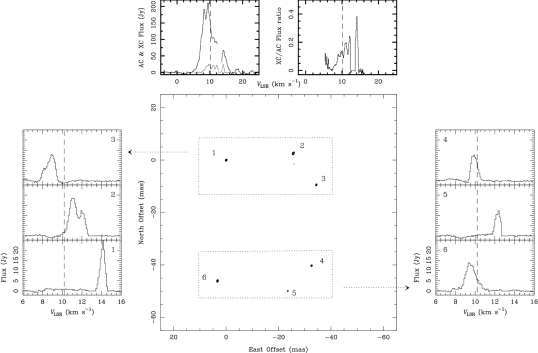
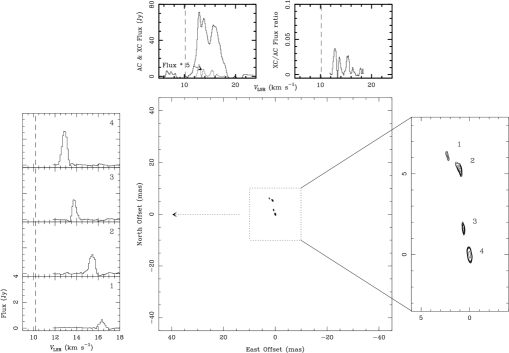
The results obtained are presented in Figs. 2–7, where for each of the mapped SiO transitions, we show: 1) The VLBA integrated intensity map (in Jy per clean beam). 2) The individual spectra of all the maser features with a signal-to-noise ratio larger than 5 and appearing on at least three consecutive spectral channels. The spectrum for each spot was calculated transforming the map units (Jy/beam) to flux units (Janskys) for the selected maser region. 3) The total power calibrated spectrum of the maser transition. 4) The total flux recovered in each frequency channel after the calibration and imaging. 5) The ratio of the total power to the recovered flux.
3 Results
In this section, we briefly describe the most relevant aspects of the observational results obtained for the 28SiO masers observed in the long-period variables IRC +10011 and Cyg.
We note that there is an additional difficulty when estimating the angular extents of the different masing regions since, in some cases, the distributions are not complete rings. For this reason, we give an approximate range of the angular sizes derived from the brightest components that appear in the maps.
3.1 IRC +10011
IRC +10011 (WX Psc) is an OH/IR star of spectral type M9, characterized by a very thick circumstellar envelope and higher mass loss rate than Mira-type variable stars (see Table 1). The SiO emission of IRC +10011 varies in time with a period of about 630 days (Herman & Habing herman2 (1985); Pardo et al. pardo (2004)); our observations were performed close to a maximum. All the 28SiO masers observed were detected except the =2 =2–1, probably due to the weak emission of this line in oxygen-rich variable stars (see Sect. 4.5).
3.1.1 The =1 =1–0 transition
The =1 =1–0 SiO results are displayed in Fig. 2. The intensity maps of the LCP and RCP observations were independently produced, although the same template autocorrelation spectra and phase reference channel (corresponding to a velocity of 9.16 km s-1) were used in both cases to calibrate the amplitude and the residual fringe-rates. No difference was found between the two circular polarizations and so the two maps were finally averaged.
The interferometric VLBA map shows nine maser spots distributed in three different regions with velocities ranging from 6 to 12 km s-1 and peak intensities up to 9 Jy (spot 7). The angular diameter of the emitting region is 19–24 mas, derived from the brightest features. Almost 40% of the flux has been recovered in the interferometric maps at velocities near the systemic, 9.2 km s-1.
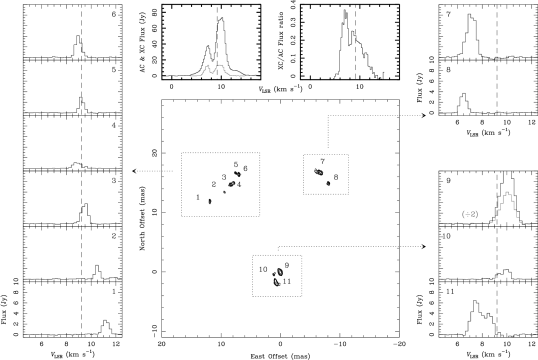
3.1.2 The =2 =1–0 transition
The =2 =1–0 results for IRC +10011 are presented in Fig. 3. The intensity map is composed of eleven maser clumps distributed into three different regions. The velocity range varies from 6 to 12 km s-1 and the intensities from 1 Jy (spot 4) to 12 Jy (spot 9, where the intensity has been divided by two in the plot to ease the comparison with the rest of the spectra). For this transition, the diameter of the emission is about 16–21 mas. At velocities around 7 km s-1, about 40% of the maser flux has been recovered.
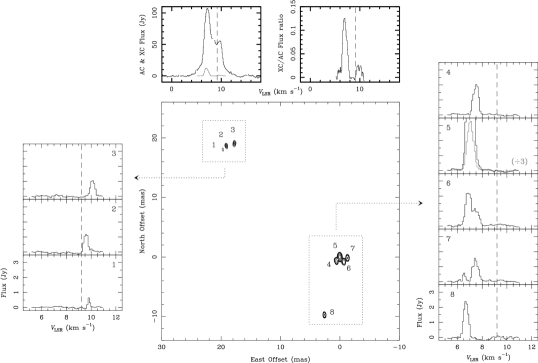
3.1.3 The =1 =2–1 transition
The =1 =2–1 SiO line is presented in Fig. 4. We found eight different maser spots, with velocities from 6 to 10.5 km s-1 and intensities up to 11 Jy (spot number 9). In this transition, about 13% of the emission has been recovered at velocities 7 km s-1. The maser components are distributed in two regions with an angular separation of about 28–33 mas.
3.2 Cyg
Cyg is a Mira variable star with a mass loss rate similar to that typically found in other regular variables, and a period of about 408 days. This object was also observed near an SiO maximum ( = 0.1–0.15, Alcolea et al. alcolea (1999)); however, we note that in this case the variability of the SiO maser emission is not as regular as in other Mira variables (Pardo et al. pardo (2004)). Cyg is an S7–9 spectral type star, thus characterized by a peculiar chemical composition. S-type variables have similar Carbon and Oxygen abundances, resulting in a lower production of O-bearing molecules other than CO. In particular, for Cyg, the C/O ratio is found to be 0.95 (Keenan & Boeshaar keenan (1980)), a value relatively low for an S-type star. Nevertheless, in this source the H2O abundance might be significantly lower compared to O-rich envelopes, since no H2O maser emission has ever been detected. This aspect is relevant when explaining the pumping of SiO masers, since, as we will see in Section 4.5, the overlap between infrared lines of SiO and H2O strongly affects the excitation of the former species.
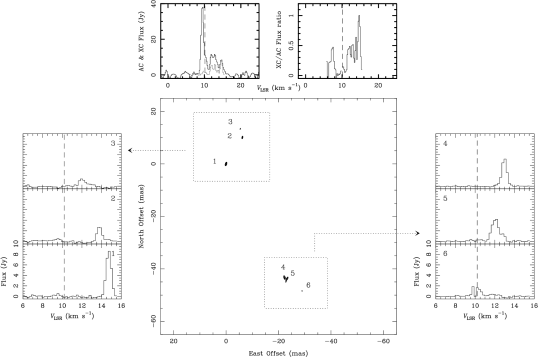
3.2.1 The =1 =1–0 transition
The =1 =1–0 SiO maser for Cyg is presented in Fig. 5. Both, LCP and RCP observational data were averaged, after the calibration to produce the final map, since no significant differences were found between the two polarizations. Six maser spots appear in the map, with velocities from 9.8 km s-1 to 14 km s-1, distributed in two regions separated about 50–62 mas. The brightest feature (spot 1) has an intensity of about 8 Jy. All the flux has been recovered at velocities near 15 km s-1, and an average of 50% for the other velocity channels.
3.2.2 The =2 =1–0 transition
The =2 =1–0 transition is shown in Fig. 6. Only one spot was found in the map, which is consistent with the simple line profile. Its velocity spread is 12–14 km s-1, and its intensity is up to 8 Jy. Almost 50% of the emission has been recovered.

3.2.3 The =1 =2–1 transition
The =1 =2–1 SiO maser is presented in Fig. 7. The VLBI map has six maser spots delineating a ring with a diameter of 50–58 mas, and with velocities from 10 to 15 km s-1. The brightest spot has a flux density of about 25 Jy. Only 20% of the emission was recovered in most velocity channels.
3.2.4 The =2 =2–1 transition
The first VLBA map of the =2 =2–1 28SiO transition is presented in Fig. 8. The image is composed of four spots with velocities ranging from 12 to 17 km s-1 and flux intensities up to 2.5 Jy. For this maser, more than 95% of the emission is lost in the interferometric map.
4 Comparison of the different SiO transitions
As noted previously, most of the properties of circumstellar SiO masers derived from VLBI studies have been obtained on M-type Mira variables and, in particular, from the observations of the 7 mm masers, mainly the =1 =1–0. However, one of the peculiarities of these stellar SiO masers is that they occur in a variety of lines, with different frequencies and excitation energies. Therefore, the comparison of the simultaneous observations harbors a crucial piece of information to understand the SiO maser phenomenon as well as to better constrain the theoretical models that try to explain the pumping of these masers. To date, most of the VLBI multi-transitional studies of SiO masers have focused on the comparison between =1 and =2 =1–0 lines (at 7 mm), while the comparison of SiO masers at different frequency bands remains almost unexplored.
In this section we compare the distribution of the observed 28SiO maser lines in IRC +10011 and Cyg. We discuss the differences found between our observational results and what is predicted by the theoretical models, which are found to fail mainly in reproducing the differences observed between the 7 and 3 mm masers. Finally, we explore the influence of the line overlaps between ro-vibrational transitions of H2O and 28SiO in the excitation, and localization in the envelope, of the SiO masers.
4.1 The =1 and =2 =1–0 masers
4.1.1 Previous results
The first comparison of VLBI observations of the =1 and =2 28SiO masers, using the KNIFE interferometer, was performed by Miyoshi et al. (miyoshi (1994)), concluding that these two lines were spatially coincident. More accurate VLBA observations have demonstrated that there is a separation between the =1 and =2 ring structures of several milli-arcsec, with the =2 maser line in most cases located inside the =1 ring (Desmurs et al. desmurs1 (1999), desmurs2 (2000); see also Yi et al. yi (2000)). Recently, Cotton et al. (cotton (2004)) have furthermore demonstrated that this relative location of the two 7 mm maser lines is independent of the optical phase of the star. We have found in our simultaneous observations a similar result for IRC +10011, but not for Cyg as we will see in detail in the forthcoming subsections.
4.1.2 IRC +10011
The =1 and =2 =1–0 SiO maps for IRC +10011 are shown in Figs. 2 and 3. Clearly, the spatial distribution of the two 7 mm SiO lines is quite similar, in both cases the maser spots being grouped in three different regions. However, the emission of the =2 line appears to be distributed in a region 10% smaller than the =1 one, 16–21 mas vs. 19–24 mas, thus arising from a slightly inner region.
As we have mentioned in Section 2, since the absolute position of the maps is lost in the calibration process, their relative alignment is arbitrary. In this case, although assuming that the coincidence of the centroids of the two maps seems a reasonable choice, there is an uncertainty in the centroid position of 2–3 mas. In Fig. 9 we present a possible alignment based on the fact that the spot 9 of the =1 map shows a velocity profile in between spots 9–11 of the =2 line. If this is the right alignment, one should conclude that there are no spatially coincident spots between the two 7 mm masers, in agreement with Desmurs et al. (desmurs2 (2000)). However, we must admit that other relative positionings are possible. Nevertheless, taking into account that it is very unlikely to have spatially coincident spots with different velocity profiles, we can only match 2–3 spots at most (out of 10 detected in both maps). Therefore, at least 70% of the spots found in one transition do not appear in the other.
4.1.3 Cyg
As noted in Section 3.2.2, only one feature was found in the =2 =1–0 line, and so the comparison with the =1 is not relevant for Cyg, since we can not make any reasonable assumption of the relative position between the two maps. From the velocity profiles, the spot detected in the =2 line could be spatially coincident with spots either 2 or 4 in the =1, or with none of them (see Figs. 5 and 6). Nevertheless, since we have detected 6 spots in the =1 =1–0 maser, we should conclude that at least 80% of the regions emitting in the =1 have no counterpart in the =2 transition. A similar conclusion can be reached just by comparing the total flux profiles.
4.2 The =1 and =2 masers: =1–0 vs. =2–1
4.2.1 Previous results
The only published comparison of quasi simultaneous VLBI observations of 7 and 3 mm SiO maser lines has been performed by Phillips et al. (phillips2 (2003)) in R Cas, which is an O-rich Mira-type variable. This source has a period of 430 days, and a mass loss rate of 1.1 yr-1. These authors observed the =1 =1–0 and =2–1 masers of 28SiO, the former line being stronger and more complex at that epoch. More than ten =1–0 spots delineate an incomplete circle. The =2–1 line map consisted only of three spots, being two components possibly spatially coincident in both transitions.
4.2.2 IRC +10011
The maps obtained for the =1 =1–0 and =2–1 in this source are displayed in Figs. 2 and 4. As it can be easily seen, the spatial distributions of both maser emissions are totally different. The separation between the two groups of spots in the 3 mm line is much larger than the diameter of the maser emission ring in the =1–0 line, 28–33 mas vs. 19–24 mas respectively. Assuming that the centroid of the emission is the same in both cases (see Fig. 10), we can conclude that the =2–1 originates from a shell located 50% further away than the =1–0, having no spots in common. This is not surprising since the line profiles are not very similar (contrary to what happens between the two 7 mm lines in this source). In fact, choosing a different alignment for the maps, it is impossible to obtain more than one coincident spot.

4.2.3 Cyg
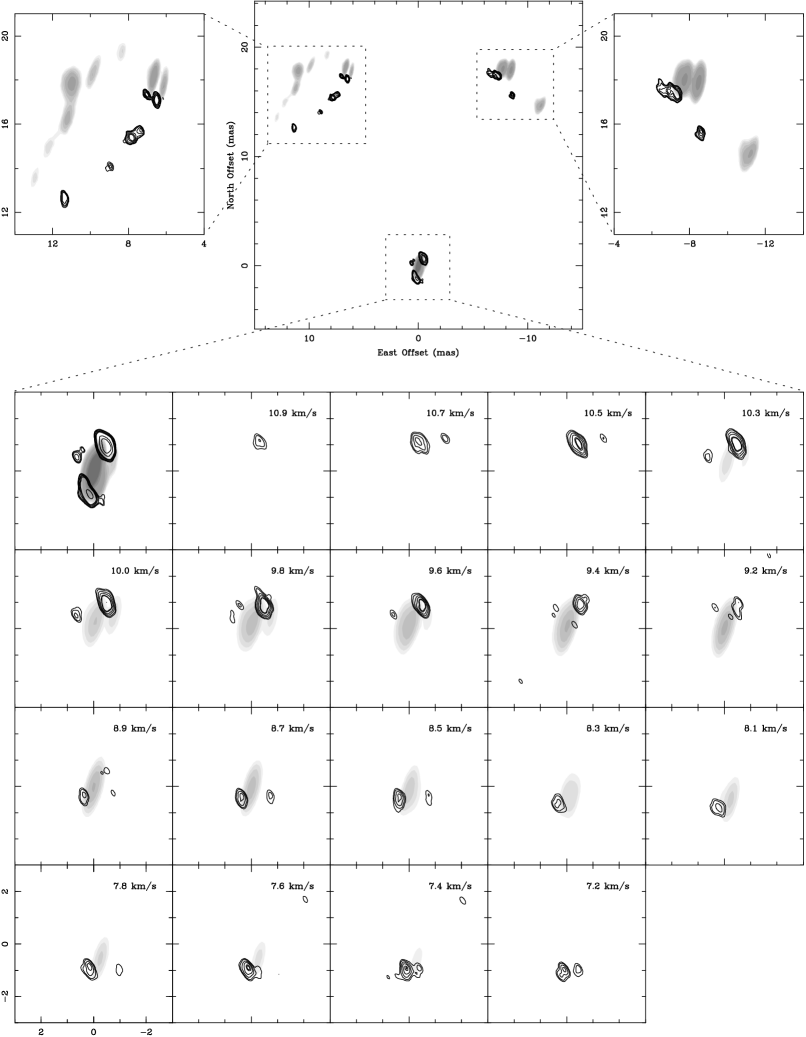
When comparing the maps for the two =1, =1–0 and =2–1, in Cyg (see Figs. 5 and 7), we found a result somewhat different than that for IRC +10011. Although the spots distribution is very different in the two transitions, the size of the emitting regions is comparable. This can be more easily appreciated in Fig. 11, in which we have again assumed that the centroid of the two emissions is the same.
The VLBA map of the =2 =1–0 maser is shown in Fig. 6. We also present the first VLBI map of the =2 =2–1 28SiO maser in an AGB star in Fig. 8. The =2 =2–1 maser emission is confined into an elongated region of 7 mas, displaying a clear velocity gradient of 3.5 km s-1 ( 0.5 km s-1 per mas). These elongated structures are typical in other SiO maser sources (see the case of TX Cam, Diamond & Kemball diamond2 (2003)). Due to this small spatial extent, it is very difficult to conclude a reasonable alignment for this map with respect to the =1 line maps. This is also the case of the other =2 transition, the =1–0 line, which consists of a single spot. Nevertheless, the comparison of the two emitting regions is not obvious since for the =1–0 there is only one maser component. However, its velocity distribution is quite similar to that of the spot number 4 of the =2–1, and so both emissions could arise from the same region of the circumstellar envelope. However, where this region is located in the envelope is very difficult to say, since the observed velocity range in the =2 lines, 12–16 km s-1, is shared by several spots of the =1 masers.
As we see, the available data to compare the 7 and 3 mm masers are very scarce: this comparison has only been done in three sources, the two presented here, IRC +10011 and Cyg, and R Cas by Phillips et al. (phillips2 (2003)). However, the results obtained can not be more disparate. For the two “normal” stars, i.e. O-rich, we have one case, IRC +10011, in which the =2–1 and =1–0 =1 masers arise from two totally different regions, with probably different physical conditions, whereas in R Cas Phillips et al. (phillips2 (2003)) claim that the masers originate from the same layer. For Cyg, which on the contrary is an S-type star, the situation is more similar to R Cas. Nevertheless, we should note here that, as in the =1 and =2 masers, from the few existing observations, it seems that it is difficult to find maser spots emitting in both =1 =1–0 and =2–1 lines.
4.3 Comparison with theoretical models
In an attempt to explain the existence and maintenance of SiO masers in the circumstellar envelopes of long period variable stars, several theoretical models have been proposed. Currently, two types of pumping mechanisms are considered, which are termed radiative (Kwan & Scoville kwan (1974); Deguchi & Iguchi deguchi (1976); Bujarrabal & Nguyen-Q-Rieu bujarrabal1 (1981); Bujarrabal 1994a , 1994b ; Rausch et al. rausch (1996)) or collisional (Elitzur elitzur (1980); Lockett & Elitzur lockett (1992); Doel et al. doel (1995); Humphreys et al. humphreys1 (1996), humphreys3 (2002)), depending on which is the primary mechanism responsible for this amplified emission. For radiative models, the energy of the maser pumping comes from the stellar radiation at 8 m, which corresponds to =1 ro-vibrational SiO transitions. In collisional models, the kinetic energy of the gas pumps the masers by means of collisions with the H2 molecules.
In all cases, the inversion of the levels in the maser transition is due to the same effect, the self-trapping of the photons in the =1 ro-vibrational transitions when these lines are opaque (see Kwan & Scoville kwan (1974)). The main de-excitation path for molecules of SiO in the vibrational excited estates (=1 and above) is the spontaneous decay via =1 transitions (=1–0, =2–1, etc.). The corresponding de-excitation rate is proportional to
where and are the Einstein’s A-coefficients for the spontaneous emission in the R- and P-branches, and and are the corresponding escape probabilities. When the opacity is large, the escape probability in the envelope is given by the inverse of the opacity of the corresponding transition, which itself is proportional to the value of the upper state. In these conditions, the higher the value the more difficult for an SiO molecule to de-excite via =1 ro-vibrational transitions. This results in a population inversion along the rotational ladder of the corresponding vibrationally excited state, and subsequently in a chain of maser transitions.
For this inversion mechanism to operate, the pumping rate must be independent of the quantum number. This is expected for collisional excitations, but also for radiative excitations if they are optically thin. The problem for the radiative models, of course, resides in producing at the same time =1 ro-vibrational transitions optically thin (excitation wise) and thick (de-excitation wise). This is solved assuming a large velocity gradient in the masing region or, more generally, a particular geometry in which the masers arise from a thin shell. Under these circumstances, the radial opacity in the =1 lines can be optically thin, while the overall average along all directions is optically thick. In spite of this difficulty, radiative models offer the advantage that the vibrational excitation is much more probable than the corresponding collisional excitation. Moreover, it can naturally explain the thin rings of spots shown in VLBI observations, because the amplification is tangential, and the tight correlation between the SiO maser intensity and the NIR stellar radiation (Bujarrabal et al. bujarrabal2 (1987); Pardo et al. pardo (2004)). On the other hand, collisional excitation operates under quite general conditions, provided that the temperatures exceed 1000 K.
Because of the nature of the inversion mechanism, the physical conditions for the generation of SiO masers within the same vibrational state (i.e. =1–0, =2–1, etc.) are very similar regardless of the model. They occur when the corresponding –1 lines become optically thick, in a similar way for the different levels. On the contrary, for masers in different vibrationally excited estates (such as =1 and =2, etc.), the conditions must be naturally different, since it is difficult to have similar opacities for the =1 ro-vibrational transitions of levels with very different excitation, simply because the population of the =1 levels at 1780 K will always be higher than that of the =2, for the expected temperature in the inner shells of the envelope (3400–1700 K). This is even more stringent for the radiative models, since to operate, the opacity of the ro-vibrational transitions must be 1, in order to be less than one in the radial direction but larger than one in average.
Because of these general results, simultaneous VLBI observations of several maser lines, both with similar and different excitation energies, in the same source offer the opportunity to better constrain the models, by comparing their predictions with the comparison of the maps obtained for the different lines.
As described in previous sections, we have found a different result for the two sources studied. In the case of Cyg, the =2–1 line is stronger than the =1–0, and the emitting regions have comparable sizes. For the =1 and =2 =1–0 lines, the =1 maser is also stronger than the =2. In IRC +10011, the differences found between the =1 and =2 =1–0 lines are smaller compared to those between the =1 =1–0 and =2–1 transitions. In fact, the =1–0 maser emissions are quite similar, although not identical, with the =1 being stronger and more extended. On the contrary, the =1 transitions differ a lot, since we have obtained different angular sizes for both distributions, with the =2–1 one being a 40% larger. These results for IRC+ 10011 are incompatible with the theoretical predictions.
4.4 The effects of line overlaps
One possible explanation for the different results found for IRC +10011 and Cyg, when comparing the 7 mm and 3 mm SiO maser emissions (see Sect. 4.1 and 4.2), may reside in their different chemical composition, because of the effects of H2O in the SiO excitation via the overlap of their ro-vibrational lines at 8 m.
It is well known that line overlap can strongly affect the pumping of maser lines because their population inversion is very sensitive to small changes in the population/de-population rates of the levels involved in the maser transitions. In particular, for SiO masers, it was already proposed by Olofsson et al. (olofsson (1981)) that the overlap between the =1, =0 – =2, =1 line of 28SiO and the =0, 127,5 – =1, 116,6 line of para-H2O is responsible for the anomalous weakness of the =2 =2–1 SiO maser in O-rich stars. These authors suggested this process in view of the close frequencies of these two ro-vibrational transitions, less than 1 km s-1, and of the relatively strong =2 =2–1 lines detected in S-type stars, for which lower H2O abundances (compared to O-rich variables) are expected. This phenomenon was studied in more detail by Bujarrabal et al. (bujarrabal6 (1996): BASCC hereafter), who found that introducing this line overlap in the model calculations, the observed properties of the =2 =2–1 maser of 28SiO in both O-rich and S-type stars could be explained.
The mechanism controlling the strength of the =2 =2–1 maser via line overlap is very simple. Provided that the population of the =2 states of H2O is dominated by collisions, the opacity and excitation of the =0, 127,5 – =1, 116,6 of para-H2O are larger than those for the =1, =0 – =2, =1 line of SiO. This results in an enhanced net population of the =2, =1 SiO level, leading to an overthrow of the inverted population and the quenching off the =2 =2–1 maser (see BASCC for more details). For S-type stars, however, since they are characterized by a [O]/[C] ratio 1, the little Oxygen left in the gas phase after the formation of CO, should result in a lower H2O abundance (no H2O masers have been detected in S-type stars so far). One must conclude that the properties of SiO masers in S-type stars should be easier to reproduce by the standard models than those of O-rich stars, for which the effects of overlaps could be more important.
This also seems to be the case in our VLBI observations. For our M-type target, IRC +10011, for which the effects of the line overlap can not be neglected (as demonstrated by the non detection of the =2 =2–1 maser), the properties of the maser spots distribution are in total disagreement with the predictions of standard models: similar properties for rotational transitions in the same vibrational state. For Cyg, in which the line overlap should not be as important as in M-type stars, (as demonstrated by the strength of its =2 =2–1 line), the properties of the maser spot distributions agree somewhat better with the expectations from the same standard models.
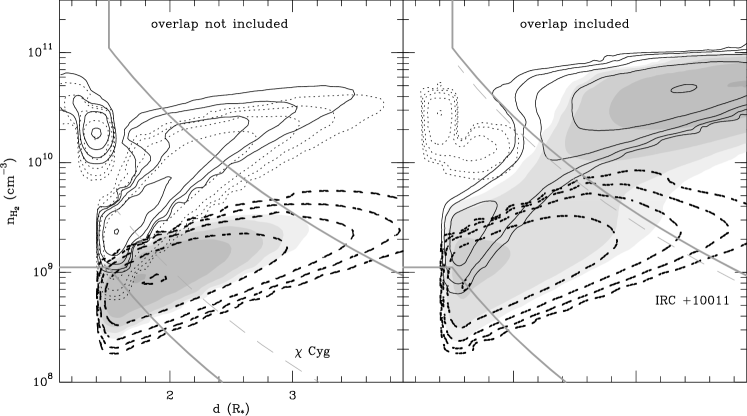
In order to verify the influence of this line overlap in the location of the masers in the envelopes of O-rich sources, and to test whether this effect could explain the results obtained for IRC +10011, we have performed new calculations using the model developed by BASCC for SiO masers, which includes the effects of the =0, 127,5 – =1, 116,6 line of para-H2O. We have studied the physical conditions under which the different SiO maser lines arise, for a simplified envelope model, taking and not taking into account the proposed line overlap. The characteristics of the numerical model, as well as the physical parameters of the envelope are the same used in BASCC, except for the ratio between the ro-vibrational and pure-rotational collisional coefficients of H2O, which has been assumed to be 0.02 here (a value in the range studied by BASCC). The results of our calculations are summarized in Fig. 12, where we plot the number of maser photons for the =1 and 2, =1–0 and 2–1 lines as a function of the distance to the star and gas density, introducing (right panel) and not introducing (left panel) the effects of the overlap.
As we can see, in the absence of overlap, the physical conditions required for lines in the same vibrational state are very similar for the 7 mm and 3 mm masers for both =1 and =2 transitions. In addition, the =2 lines require higher densities (and column densities) than the =1 masers, conditions that are very restrictive specially for envelopes with low mass loss rates ( 10-7 yr-1).
When the overlap is included several changes occur:
- a:
-
The =2 =2–1 maser is quenched, except for a very small area in the space of physical conditions, in which the effect of the overlap is in fact reversed because of the relatively low excitation temperature of the H2O line (see BASCC).
- b:
-
The =1 =2–1 line is barely affected by the overlap.
- c:
-
For conditions expected in the inner shells of the envelope, especially at low mass loss rates, the =2 =1–0 line requires lower densities (by a factor 2–3) to be masing.
- d:
-
The conditions for the =1 =1–0 to occur are now in between those for the =1 =2–1 and =2 =1–0. This line is less coupled with the =1 =2–1 and becomes more similar to the =2 =1–0 line, as it is observed in IRC +10011. This trend is more important for higher values of the ratio between the ro-vibrational and pure-rotational collisional coefficients of H2O: for values of this parameter of 0.03, the =1 and =2 =1–0 masing regimes become almost identical.
Although the modeling of the envelope in this preliminary study is very simple, the results are nevertheless very encouraging, since they predict more or less what we have observed in IRC +10011. However we believe that before investing more effort in this theoretical modeling more observational data on the relative distribution of the SiO maser lines, both in O-rich and S-type stars, are mandatory, as well as accurate estimations of the ro-vibrational collisional coefficients of H2O with H2.
5 Conclusions
We have performed high resolution observations of masers of the 28SiO molecule, in particular the rotational transitions =1 =1–0, =1 =2–1, =2 =1–0 and =2 =2–1 in the regular variables IRC +10011 and Cyg. The main goal of this work is to map each of these transitions so as to compare the spatial distribution of the different masers. Our results allow us to study in detail the differences between the observational results and the predictions of the theoretical pumping models, proving their validity in different types of sources.
We have presented in this paper the first VLBI maps for an S-type star, Cyg: in particular, the 28SiO rotational lines =1–0 and =2–1 in the =1 and =2 vibrational states. For the O-rich star, IRC +10011, we have mapped the 28SiO =1 =1–0 and =2–1, and the =2 =1–0 maser emissions.
In IRC +10011, all the 28SiO maser transitions were detected and mapped except the =2 =2–1 line. When comparing the two 7 mm maser emissions, we found that the =2 is located in an inner region of the envelope, its angular extent being 10% smaller than that of the =2. On the contrary, for the =1 =1–0 and =2–1 maser lines, the latter emission arises in a layer 50% farther away from the star.
For Cyg, the =1 =1–0 and =2–1 have comparable sizes, although their spatial distributions are different. On the other hand, the =2 lines, =1–0 and =2–1, seem to originate in a similar region probably more compact and with more restrictive characteristics in the envelope.
Comparing our observational results with the different theoretical pumping mechanisms we obtain the following:
-
-
Standard models, collisional or radiative, have serious problems in explaining what is observed in IRC +10011: the =1 and =2 distributions being more similar than those of the =1 =1–0 and =2–1 transitions. This observational result contradicts what is predicted by all the theoretical studies, where the distributions of the =1–0 and =2–1 emissions appear to be similar.
-
-
However, in Cyg, although the distributions of the =1 =1–0 and =2–1 transitions are different, as in IRC +10011, the sizes of the masing regions are comparable. For the =2 =1–0 and =2–1 lines, it is difficult to establish the differences between the two emitting regions since, in the first transition only one feature was found.
-
-
With respect to the =2–1 and =1–0 maser lines, a special effort must be made to study whether the observed relative spatial distribution of these emissions is similar to IRC +10011 or Cyg.
-
-
The fact that almost none of the spots are coincident in all the transitions reveals that there may be additional maser competition effects that are not theoretically understood. We note that, since a considerable percentage of the emission is lost, the lack of coincidence could refer only to the brightest features.
To explain the discrepancies between theory and observations, we have proposed that the line overlap between ro-vibrational H2O and SiO lines is a process that strongly affects the conditions under which the masers occur. This effect is stronger in O-rich variables, such as IRC +10011, since they present a higher abundance of H2O in the envelope than S-type variables, such as Cyg. The results are very promising: when the overlap is important, the =1 and =2 =1–0 lines are strongly coupled and a significant difference appears between the =1–0 and =2–1 maser lines, as is observed in IRC +10011.
We therefore conclude that a more extended study, from observational and theoretical points of view, will help to understand if the results for the SiO maser emissions obtained in IRC +10011 and Cyg are produced systematically in other LPVs and to constrain both the pumping mechanisms and the importance of the line overlaps.
Acknowledgements.
This work has been financially supported by the Spanish DGI (MCYT) under projects AYA2000-0927 and AYA2003-7584. We acknowledge with thanks the variable star observations from the AAVSO International Database contributed by observers worldwide and used in this research.References
- (1) Alcolea, J., Bujarrabal, V., & Gallego, J.D. 1989, A&A, 211, 187
- (2) Alcolea, J., Pardo, J.R., Bujarrabal, V., et al. 1999, A&A, 139, 461
- (3) Boboltz, D.A., Diamond, P.J., & Kemball, A.J. 1997, ApJ, 487, L147
- (4) Boboltz, D.A., & Marvel, K.B. 2000, ApJ, 545, L149
- (5) Bujarrabal, V., & Nguyen-Q-Rieu, M. 1981, A&A, 102, 65
- (6) Bujarrabal, V., Planesas, P., del Romero, A. 1987, A&A, 175, 164
- (7) Bujarrabal, V., Gómez-González, J., & Planesas, P. 1989, A&A, 219, 256
- (8) Bujarrabal, V. 1994a, A&A, 285, 953
- (9) Bujarrabal, V. 1994b, A&A, 285, 971
- (10) Bujarrabal, V., Alcolea, J., Sánchez Contreras, C., & Colomer, F. 1996, A&A, 314, 883
- (11) Cernicharo, J., Alcolea, J., Baudry, A., & González-Alfonso, E. 1997, A&A, 319, 607
- (12) Colomer, F., Graham, D.A., Krichbaum, T.P., et al. 1992, A&A, 254, L17
- (13) Cotton, W.D., Mennesson, B., Diamond, P.J., et al. 2004, A&A, 414, 275
- (14) Danchi, W.C., Bester, M., Degiacomi, C.G., Greenhill, L.J., & Townes C.H. 1994, AJ, 107, 1469
- (15) Deguchi, S., & Iguchi, T. 1976, PASJ, 28, 307
- (16) Desmurs, J.-F., Bujarrabal, V., Colomer, F., & Alcolea, J. 1999, New Astron. Rev., 43, 559
- (17) Desmurs, J.-F., Bujarrabal, V., Colomer, F., & Alcolea, J. 2000, A&A, 360, 189
- (18) Diamond, P.J., Kemball, A.J., Junor W., et al. 1994, ApJ, 430, L61
- (19) Diamond, P.J., & Kemball, A.J. 2003, ApJ, 599, 1372
- (20) Doel, R.C., Gray, M.D., Humphreys, E.M.L., Braithwaite, M.F., & Field, D. 1995, A&A, 302, 797
- (21) Doeleman, S.S., Lonsdale, C.J., & Greenhill, L.J. 1998, ApJ, 494, 400
- (22) Elitzur, M. 1980, ApJ, 240, 553
- (23) Greenhill, L.J., Colomer, F., Moran, J.M., et al. 1995, ApJ, 449, 365
- (24) Herman, J., Band, B., Habing, H.J., & Winnberg, A. 1985, A&A, 143, 122
- (25) Herman, J., & Habing, H.J., 1985, A&A, 54, 523
- (26) Hollis, J.M., Boboltz, D.A., Pedelty, J.A., White, S.M., & Forster, J.R. 2001, ApJ, 559, L37
- (27) Humphreys, E.M.L., Gray, M.D., Yates, J.A., et al. 1996, MNRAS, 282, 1359
- (28) Humphreys, E.M.L., Gray, M.D., Yates, J.A., et al. 2000, in Proc. 5th European VLBI Network Symp., eds. J.E. Conway, A.G. Polatidis, R.S. Booth and Y. Philström, p. 197
- (29) Humphreys, E.M.L., Gray, M.D., Yates, J.A., et al. 2002, A&A, 386, 256
- (30) Keenan, P.C., & Boeshaar, P. C. 1980, A&AS, 43, 379
- (31) Kwan, J., & Scoville, N. 1974, ApJ, 194, L97
- (32) Lockett, P., & Elitzur, M. 1992, ApJ, 399, 704
- (33) Loup, C., Forveille, T., Omont, A., & Paul, J.F. 1993, A&AS, 99, 291
- (34) Miyoshi, M., Matsumoto, K., Kameno, S., Takaba, H., & Iwata, T. 1994, Nature, 371, 395
- (35) Olofsson, H., Hjalmarson, A., & Rydbeck, O.E.H. 1981, A&A, 100, L30
- (36) Pardo, J.R., Alcolea, J., Bujarrabal, V., et al. 2004, A&A, 424, 145
- (37) Phillips, R.B., & Boboltz, D.A. 2000, AJ, 119, 3015
- (38) Phillips, R.B., Straughn, A.H., Doeleman, S.S., & Lonsdale, C.J. 2003, ApJ, 588, L105
- (39) Pijpers, F.P., Pardo, J.R., & Bujarrabal, V., 1994, A&A, 286, 501
- (40) Rausch, E., Kegel, W.H., Tsuji, T., & Piehler, G. 1996, A&A, 315, 533
- (41) Sánchez Contreras, C., Desmurs, J-F., Bujarrabal, V., Alcolea, J., & Colomer, F. 2002, A&A, 385, L1
- (42) Wittkowski, M., & Boboltz, D. A. 2003, in Proc. Future Directions in High Resolution Astronomy: The 10th Anniversary of the VLBA, ASP Conference Series, in press, eds. J.D. Romney & M.J. Reid
- (43) Yi, J., Booth, R., Conway, J., Diamond, P.J., & Winnberg, A. 2000, in Proc. 5th European VLBI Network Symp., eds. J.E. Conway, A.G. Polatidis, R.S. Booth and Y. Philström, p. 193