11email: Heinrich.Voelk@mpi-hd.mpg.de 22institutetext: Yu. G. Schafer Institute of Cosmophysical Research and Aeronomy,
31 Lenin Ave., 678980 Yakutsk, Russia
22email: berezhko@ikfia.ysn.ru 22email: ksenofon@ikfia.ysn.ru
Magnetic Field Amplification in Tycho and other Shell-type Supernova Remnants
It is shown that amplification of the magnetic field in supernova remnants (SNRs) occurs in all six objects where morphological measurements are presently available in the hard X-ray continuum at several keV. For the three archetypical objects (SN~1006, Cas~A and Tycho's SNR) to which nonlinear time-dependent acceleration theory has been successfully applied up to now, the global theoretical and the local observational field strengths agree very well, suggesting in addition that all young SNRs exhibit the amplification effect as a result of very efficient acceleration of nuclear cosmic rays (CRs) at the outer shock. Since this appears to be empirically the case, we may reverse the argument and consider field amplification as a measure of nuclear CR acceleration and it has indeed been argued that acceleration in the amplified fields allows the CR spectrum from SNRs to reach the knee in the spectrum or, in special objects, even beyond. The above results are furthermore used to investigate the time evolution of field amplification in young SNRs. Although the uncertainties in the data do not allow precise conclusions regarding this point, they rather clearly show that the ratio of the magnetic field energy density and the kinetic energy density of gas flow into the shock is of the order of a few percent if the shock speed is high enough km/s, and this ratio remains nearly constant during the SNR evolution. The escape of the highest energy nuclear particles from their sources becomes progressively important with age, reducing also the cutoff in the -decay gamma-ray emission spectrum with time after the end of the sweep-up phase. Simultaneously the leptonic gamma-ray channels will gain in relative importance with increasing age of the sources.
Key Words.:
cosmic rays, shock acceleration, nonthermal emission, supernova remnants; individual: Tycho’s supernova remnant1 Introduction
Recent observations with the Chandra and XMM-Newton X-ray space telescopes have confirmed earlier detections of nonthermal continuum emission in hard X-rays from young shell-type supernova remnants (SNRs). With Chandra it became even possible to resolve spatial scales down to the arcsec extension of individual dynamical structures like shocks. Results of this type have been published for Tycho's SNR (G120.1$+$1.4) (Hwang et al. Hwang (2002); Bamba et al. 2003b ), RCW~86 (G315.4$-$2.3) (Rho et al. rho02 (2002); Bamba et al. 2003b ), Cas A (G111.7$-$2.1) (Vink & Laming vl03 (2003); Bamba et al. 2003b ), SN 1006 (G327.6$+$14.6) (Long et al. long (2003); Bamba et al. 2003a ; 2003b ; bam04 (2004)), and Kepler's SNR (G4.5$+$6.8) (Bamba et al. 2003b ); (see also Bamba ba04 (2004)). Small-scale filamentary structures in SNR RX~J1713.7$-$3946 (G347.3$-$0.5) have been reported by Uchiyama et al. (uch03 (2003)) and Lazendic et al. (laze (2004)).
These results can be seen from three different viewpoints: First of all, assuming the filamentary structures to represent synchrotron emission near shocks, their width can be considered as the synchrotron coBoling length to derive the effective downstream magnetic field strength . Secondly, we can compare this with the value for the interior magnetic field strength that makes a complete dynamical model of the SNR consistent with the spatially integrated synchrotron spectrum, from the radio range to hard X-rays. The third viewpoint is from the plasma physics of field amplification in an ionized gas with a very strong nuclear cosmic ray (CR) gradient.
Let us first turn to the observed X-ray morphology. In their work on Cas A, Vink & Laming (vl03 (2003)) have interpreted some of the filamentary hard X-ray structures as the result of strong synchrotron losses of the emitting multi-TeV electrons in amplified magnetic fields downstream of the outer accelerating SNR shock. Such an interpretation has been independently given by Berezhko et al. (bkv02 (2002)) from a consistent description of the observed SN 1006 dynamics and of the properties of its overall nonthermal emission, and by Berezhko et al. (2003a ) for the Chandra observations of SN 1006, leading to an effective downstream field strength of 120 G for the latter object. Subsequently Berezhko & Völk (2004a ) revised the Vink & Laming result for Cas A by consistently taking account of all relevant dynamical and geometrical (projection) factors. It was shown that for the highest energy electrons, usually responsible for the X-ray emission (like in the case of SN 1006 and Cas A), synchrotron losses become important already during the acceleration process. Together with the projection effect they imply a significantly shorter electron cooling time behind the shock, and thus an effective downstream magnetic field strength in Cas A that is stronger by a factor of five than estimated by Vink & Laming (vl03 (2003)). It reaches about 0.5 mG in the immediate downstream region of the outer shock.
Such observational results gain their qualitative significance through the fact that for SN 1006 (Berezhko et al. bkv02 (2002)) and Cas A (Berezhko et al. 2003b ) these effective magnetic fields and morphologies turned out to be exactly the same as predicted theoretically from nonlinear acceleration theory. The theory uses gas dynamics and nonlinear acceleration theory to calculate a kinetic model of young, evolving SNRs which includes the energetic electron component together with the nuclear CR component. Since this theory does not explicitly contain equations for the evolution of the electromagnetic fields or for the injection of low-energy particles into the acceleration process, these processes are parametrized by an effective magnetic field strength and an injection strength for the nuclear particles. The theory then works as follows: the comparison of the model with the observed spectral features of the spatially integrated synchrotron emission from the remnant yields a selfconsistent value for (see also Reynolds & Ellison re92 (1992)) as well as for the total CR pressure . The amplitude of the observed synchrotron emission limits in addition the pressure of the energetic electrons to 1 percent or less of the total CR pressure in the remnant.
It is important to note that the magnetic field derived from the fit of the calculated overall synchrotron flux to the observed flux and the field that results from the observed X-ray brightness profile correspond to basically different parts of the SNR. The field belongs to the thin region just behind the shock whereas , which mainly comes from the radio data, characterizes the average effective field within a much wider region, occupied by the GeV-electrons. Generally speaking, and can therefore also be basically different. The equality is expected if during the SNR evolution the random amplified field is generated near the shock front at the level (Berezhko et al. 2003a ; Berezhko & Völk 2004b ). Therefore the equality of the experimental values and confirms that the field is indeed amplified (generated) to the above level.
It should perhaps be noted here that there is a good semi-quantitative understanding of the injection rate of nuclear particles into the diffusive shock acceleration process in terms of the escape of suprathermal downstream particles. However, due to the incompletely known relaxation state of the downstream ions, the escape rate is theoretically known only up to factors of order unity (Völk et al. vbk03 (2003)), and therefore it is necessary to fix its value empirically in a quantitative model for the SNR as a whole. Overall, with the three parameters , , and electron-to-proton ratio determined empirically, it is possible to describe the overall observed electron synchrotron spectrum from first principles.
The large total CR pressure and the negligible contribution to it from electrons is a compelling argument for the existence and dominance of the nuclear CR component in SNRs which makes up almost the entire pressure . The implied magnetic field strength must be the same as that determined independently from the observed X-ray filaments. This is a direct empirical test for acceleration theory. Even though such a detailed agreement has been demonstrated only in two cases up to now, it is hard to believe that this is a mere coincidence.
Besides morphology and acceleration theory the third aspect of field amplification concerns plasma instability theory. In shocks with strong nuclear CR production the downstream CR pressure is of the order of the ram pressure of the upstream gas flow in the shock frame (Drury & Völk druV (1981); Axford et al. alm (1982)). Then the unstable streaming of the shock accelerated nuclear particles (Bell bell78 (1978); Blandford & Ostriker blano (1978)) leads to an excessive resonant excitation of Alfvén waves whose energy density exceeds that of the mean magnetic field by far (McKenzie & Völk mcv82 (1982)), making an increased and maximally disordered magnetic field plausible (Völk voelk84 (1984)). Much more recently, analytical studies and numerical simulations of this instability were performed by Lucek & Bell (lucb00 (2000)) and Bell & Lucek (bluc01 (2001)) which indicated strong field amplification for , while the spatial diffusion for energetic particles in this disordered field reached the limiting level of Bohm diffusion. This implies that the scattering mean free path approaches the gyro radius in the amplified field. Finally, Bell (bell04 (2004)) extended an early investigation by Achterberg (ach83 (1983)) of the nonresonant right-hand polarized low frequency MHD mode, propagating parallel to the average magnetic field in the presence of a nuclear CR current. In the case he found strong linear growth with a growth rate in excess of the oscillation frequency, i.e. a purely growing mode. This growth is even more rapid than that of the resonant Alfvén waves, usually considered until now. Nonlinear quasi-MHD simulations on the basis of this instability showed strong field amplification for the energetic particle streaming that one has to expect in the strong accelerating shocks of young shell-type SNRs.
We assume the observed filamentary X-ray structures to be manifestations of such theoretical plasma processes and shall therefore consider them as an integral aspect of diffusive shock acceleration in violent events such as supernova explosions.
The aim of our paper is to discuss the objects where field amplification possibly occurs. Therefore we shall consider all those shell-type SNRs where filamentary shock structures in hard X-rays have been published up to now. These SNRs are typically quite young, with ages not much in excess of a sweep-up time for a uniform circumstellar medium. The explanation for this selection effect is as follows: the cutoff frequency of synchrotron spectrum produced by the shock accelerated electrons is proportional to and diminishes after sweep-up as a result of the slowing down of the shock, reducing the X-ray emission at a fixed observation energy energy, like 4 keV, sharply with time (Berezhko & Völk 2004b ). This is independent of the fact that the total CR energy, the normalized CR pressure , and the hadronic gamma-ray luminosity remain quite high for much longer times in the Sedov phase (e.g. Berezhko & Völk bv97 (1997)). Older SNRs are therefore not expected to exhibit significant nonthermal hard X-ray emission.
To search for field amplification in young SNRs only does therefore not imply a methodological restriction. On the contrary, if we knew that all young SNRs showed field amplification we would know that all SNRs have a strong nuclear energetic particle population, as a result of the strong theoretical connection between field amplification and the dominant contribution of nuclear CRs to the overall nonthermal pressure .
Besides Cas A and SN 1006 the available Chandra observations concern Tycho's and Kepler's SNRs, RCW~86, and RX~J1713.7-3946, as mentioned above. Tycho's SNR plays a special role, because there exists a detailed theoretical model for the particle spectra and the synchrotron morphology (Völk et al. vbkr02 (2002)). We shall use the projection model for the brightness morphology developed by Berezhko & Völk (2004a ) wherever possible to fit the data by adjusting the strength of the effective magnetic field . We find that all the investigated sources have amplified fields to a varying degree, and therefore we propose that all these sources are efficient nuclear CR accelerators. This is a necessary condition for the Galactic SNRs to constitute the source population of the Galactic CRs, at least up to the so-called knee of the energy spectrum. Regarding Tycho's SNR we shall find that it constitutes the third case where spectral and morphological synchrotron characteristics independently give the same effective field strength.
2 Effective magnetic fields from X-ray data
As shown by Berezhko & Völk (2004a ), the width of the observable brightness profile is always appreciably wider than the downstream width in radius of the three-dimensional emissivity , simply for geometric reasons:
| (1) |
In this approximate relation, valid for , and are the shock radius and the distance between the center of the remnant and the line of sight, respectively. At the same time is the distance through which the very energetic electrons stream away from the shock during a synchrotron loss time , where is the electron mass, cm is the classical electron radius, denotes the speed of light, and is the effective magnetic field in the downstream region. For given frequency the momentum of the radiating electron is approximately given as .
In the limit of a strongly fluctuating magnetic field around the shock on all scales, we also assume that the diffusion coefficient is given by the Bohm limit, , where and are the particle gyroradius and velocity, respectively. Therefore is determined by and which can be conveniently turned into an equation for in terms of and (Berezhko & Völk 2004a ):
| (2) |
with
| (3) |
where is the proton charge. These are the main relations which we are going to use in order to determine the amplified field. The Chandra observations yield in terms of the angular distance which can be converted to for known source distance . Given the -profiles for a given X-ray energy we shall then fit the data to the model curve Eq.(1) to determine , and thus . In some of the published observations, mentioned in the Introduction, only the exponential widths of the profiles are quoted. In those cases we shall approximately equate with this width.
2.1 Tycho's SNR
In the case of Tycho's SNR the circumstellar gas density is unexpectedly inhomogeneous for a type Ia SN. This results in significant azimuthal deviations from spherical symmetry both in shape and expansion velocity of the SNR shock (e.g. Reynoso et al. rvdg99 (1999)), even though to first approximation the remnant can be considered as spherical. There are also indications that the local radio spectral index , derived from the ratio of the emissions at cm and , is nonuniform (Katz-Stone et al. Katz00 (2000)) and in several locations quite low, near . The well-defined spatially integrated radio spectrum on the other hand is rather steep () if fitted by a power law, and indicates curvature (Reynolds & Ellison re92 (1992)). It is therefore perhaps not surprising that also the radial brightness profiles across the shock are not identical in different regions of the shock circumference. Two such profiles were presented by Hwang et al. (Hwang (2002)).
There are additional reasons for different widths of such profiles apart from inhomogeneities of the circumstellar density. Being an example of a type Ia SN, the low-mass progenitor star should not have had a significant mass loss in the form of a wind with a Parker spiral-type circumstellar field. To the extent that the density of the environment is uniform, also the ambient magnetic field should be uniform, ideally resulting in a dipolar topology of the distribution of accelerated nuclear particles (Völk vo97 (1997); Völk et al. vbk03 (2003)). This should also lead to a corresponding distribution of field amplification in azimuth and thus to different spatial scales of the radial synchrotron profiles. Even though such a simple geometry is not realized in Tycho's SNR, the underlying physical processes should nevertheless lead to azimuthal variations of the radial synchrotron emissivity scales in a quasi-statistical way.
As indicated in the Introduction a global value of the effective interior magnetic field – and thus the sharpness of the radial profile at the shock – can be independently determined from a comparison of the volume-integrated theoretical synchrotron spectrum with the one observed. In fact, the nonlinearity of the diffusive acceleration process for CR nucleons leads to a spectral steepening and even to a curvature of the energy spectrum of accelerated electrons for rigidities corresponding to sub/trans-relativistic protons. This well-known feature (e.g. Ellison & Eichler elei (1984); Drury drury83 (1983); Völk voelk84 (1984); Blandford & Eichler blanei (1987); Reynolds & Ellison re92 (1992); Berezhko et al. byk96 (1996)) implies a steeper and curved synchrotron spectrum in the radio range compared to the test particle limit, if the radiating electrons are indeed in the above low rigidity range. An observed integrated spectrum with this feature then implies a minimum magnetic field strength. But this is only the most obvious nonlinear feature. In fact, the entire frequency range of the synchrotron spectrum must be consistent with this magnetic field strength, especially also in the hard X-ray region. This fixes both the amount of shock modification, i.e. the proton injection rate in the theory, and the global effective magnetic field strength (Berezhko et al. bkv02 (2002)). It is remarkable that with these three parameters it is possible to describe the measurements of the entire synchrotron spectrum, which in the case of Cas A include also the mm and mid-infrared range.
As a consequence we have two experimentally independent methods to determine the effective magnetic field, a local one and a global one. Several independent radial profiles even yield several independent local values as a function of azimuth. We shall in the following investigate the consistency of these values for Tycho's SNR.
The radial width of the three-dimensional emissivity distribution is smaller by a factor of about 7 than the radial brightness scale of the optically thin emission. It is simple to verify that for the considered X-ray energies, which lie in the cutoff region of the integrated synchrotron brightness, the case of strong losses (Völk et al. vmf81 (1981)) is relevant, where the emissivity width is given by the limiting case of Eqs.(2, 3) (Berezhko & Völk 2004a )
| (4) |
i.e. by the postshock diffusion length in a synchrotron loss time. In the Bohm diffusion limit for the accelerating particles in Tycho's SNR (which at the present epoch is in the transition between the free expansion phase and the Sedov phase), is then given by
| (5) |
In other words, the radial emissivity profile is parametrized by alone in this limit.
We shall start with the Chandra data that were given in Fig. 4 of Hwang et al. (Hwang (2002)) in the form of radial profiles of the 4-6 keV continuum brightness for two azimuthal sectors in the northwest (NW) and the southwest (SW). This energy range excludes most of the emission lines. The profiles show a pronounced outer rim, presumably at the location of the remnant’s forward shock.
In the lowest approximation the narrower rim in the NW has an exponential width of about 3.5 arcsec, whereas the SW rim extends over at least 4.7 arcsec. This corresponds to about 1.6 and 2.1 percent of projected radius. Adopting a distance of kpc and using , this implies cm and cm for the NW and SW profile, respectively. Using the full Eqs. (2) and (3) with km/s, and a shock compression ratio , from Völk et al. (vbkr02 (2002)), and taking keV, we obtain G and G, for the two respective sectors. The shock sectors are obviously independent except possibly the innermost regions near the center which play no role in the present argument. Nevertheless one can conclude that the magnetic field values within these regions are roughly the same within the errors.
Bamba (ba04 (2004)) has given an exponential width pc for a profile in the NW, in the 2 - 10 keV band. Using keV and we obtain from Eqs. (2) and (3) G.
We have also fitted both the widest and most narrow template distributions, cf. Eqs. (1–3), to the Hwang et al. profiles. To do this we assumed a Gaussian distribution of the statistical errors in the measurement of the brightness distribution , i.e. the errors to be given by the square root of the discrete values given in the paper by Hwang et al. (Hwang (2002)), together with a positional accuracy of the ACIS array of Chandra of 0.5 arcsec. The results for the two radial profiles are given in Fig. 1. This implies G for the SW profile, and G for the profile in the NW. Note that the values and for the cases represented in Fig. 1a and 1b respectively show that the data are fitted by the formula (1) quite well. Again one can see that within the uncertainties the field values in these two region are the same.

For the global determination of the effective downstream field we compare the theoretical synchrotron spectrum with the observed spatially integrated spectrum (see Fig. 2). To explore the possible bandwidth of -values we approximate the data with a slightly softer radio spectrum than adopted by Völk et al. (vbkr02 (2002)). In the framework of the strongly nonlinear system of equations, the required stronger shock modification by the nuclear component is achieved by a somewhat increased proton injection rate. The theoretically implied increase of the magnetic field from 240 to 360 G then requires a reduction of the amplitude of the electron momentum distribution since the radio electrons are not subject to synchrotron cooling at the present epoch. This leads to a decreased electron/proton ratio in the energy range where radiative cooling is unimportant. Most importantly however, the cooling region of the synchrotron emission spectrum Hz will be lowered in amplitude by this decreasing electron/proton ratio.
Taking into account, that the electron distribution function is roughly a power law we can approximately write
| (6) |
for , where is the spatially averaged electron distribution in the remnant interior. The low frequency part of the spectrum Hz) is produced by electrons which do not suffer synchrotron losses. Therefore and , where is proton injection rate, is the electron-to-proton ratio, and . To have an equally good fit for the radio data the electron-to-proton ratio should be reduced for a higher downstream field value .
At higher frequencies Hz the synchrotron emission is produced by electrons which suffer significant synchrotron losses. For Hz , which corresponds to the so-called weak loss case (Berezhko & Völk 2004a ). Since we have , where . Since the power law index is close to 4, , independently of . The reduction of the electron- to-proton ratio for higher field leads to a decrease of the overall synchrotron flux (see Fig. 2).

The reduction of electron production, discussed above, leads to a proportional reduction of the synchrotron emission in the cooling range as shown by the dashed curve in Fig. 2 and implies an underestimate of the X-ray synchrotron emission compared to the slight overestimate in Völk et al. (vbkr02 (2002), see Figs. 3 and 5). The spectral fit in that earlier paper had on purpose not been fine-tuned, because the aim had been to demonstrate field amplification in principle. The optimum magnetic field strength then lies between the two cases, roughly at 300 G. This leads to an optimum value G from acceleration theory.
The two extremes of the globally determined magnetic field from Fig. 2 are then compared to the local Chandra data in Fig. 3 by plotting the full numerical solutions for the SNR morphology, as it results from the combination of gas dynamics and time-dependent kinetic theory, together with the data from Fig. 1. The agreement of global morphology and local profiles is reasonable even though the differences between the two profiles show that the deviations from spherical symmetry are significant. Such a comparison is of course incomplete since only two radial profiles could be used. Further Chandra data are needed to evaluate in detail the degree of agreement between theory and experiment.

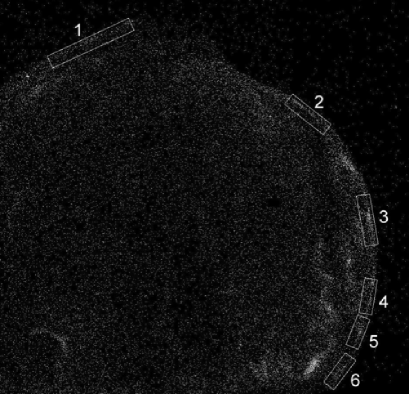
Finally, we have investigated Chandra X-ray images in the north and northwest, obtained for X-ray energies keV with the ACIS spectroscopic array from the Chandra archive, using the morphology template. This corresponds to 6 profiles through the remnant’s outer boundary as indicated in the unsmoothed broadband Chandra ACIS image in Fig. 4, showing a partial image of the SNR. In addition we show the co-added data from the 6 profiles. The corresponding data are fitted to the template. The individual results for vary between 150G and 373G, with typical erros of (- 34 % + 70 %). Since the number of events per bin is partly small, of the order of a few in the outer flanks of the individual distributions, we have also coadded the profiles to obtain a sum profile. It is shown in Fig. 5. Even though the individual low-statistics profiles lead to a sizable scatter for , the average profile determines a mean value of G with a very high fitting quality which agrees rather well with the optimized field value from acceleration theory.
Note, that the actual shock position relative to the observed brightness profile is not known. Therefore it is used in the fitting procedure as a free parameter. As a result of the best fit the shock position corresponds to and 0.6 arcsec for the cases presented in Fig. 1a and 1b respectively, and arcsec for the case, presented in Fig. 5.
The overall situation is then as follows: the simple approximation that determines an exponential width and then uses Eqs.(2) and (3) to determine , yields -values that agree well with each other and with the global spectral determination. The same is true for the fit of the profiles from the archive to the template given by Eq.(1). Therefore we can also conclude that the coincidence of the postshock and the global field values confirm that the field amplification during the SNR evolution scales like .

2.1.1 Gamma-ray prediction
For completeness we shall also give the resulting prediction for the total integral gamma-ray energy flux from Tycho's SNR for the above extreme values of , equal to G and G, respectively, at the same gas density (Fig. 6). Compared to the earlier prediction (Völk et al. vbkr02 (2002)), the hadronic -decay flux changes very little, as expected, whereas the Inverse Compton flux changes by a factor of about 7 between G and G in effective magnetic field strength, given the observed synchrotron flux. Thus a detection of Tycho's SNR in TeV gamma rays close to the predicted hadronic flux would again indicate a hadronic CR source - as the entire discussion in terms of acceleration theory implies in any case. However, the hadronic gamma-ray emission is quite sensitive to the ambient gas density which may not have been fixed sufficiently well yet from radio observations (e.g. Reynoso et al. rmg97 (1997)). We note however that the nominal value for the mean ambient hydrogen density cm-3, chosen in Fig. 6, is on the low rather than on the high side.

2.2 RCW~86
This SNR, more generically designated as G315.4-2.3, is a shell-type SNR of large angular size arcmin, with a nonthermal radio spectrum, at an apparent kinematic distance of kpc found from optical observations (Rosado et al. ros96 (1996)). The distance might in fact be smaller, and might be as low as kpc (see e.g. Dickel et al. dick (2001); Borkowski et al. bor01 (2001), for more recent reviews). The designation RCW~86 is an optical one and refers to a bright complex of optical emission filaments in the southwest part of the more or less circular and complete shell. This southwest part also exhibits the brightest radio and X-ray emission. G315.4-2.3 has often been compared to Tycho's SNR. However, it lacks the sharp outer rims that delineate much of Tycho's SNR silhouette (cf. Dickel et al. dick (2001)), in particular also in hard X-rays (Fig. 4).
The X-ray observations above 2 keV are well described by a dominant synchrotron continuum and a strong iron line. Using Chandra, Rho et al. (rho02 (2002)) in particular investigated spatial profiles of the hard ( keV) X-ray emission in the RCW~86 region proper, one of which we consider appropriate to represent a strong shock since it has all the expected properties: a sharp rise in hard X-rays – accompanied by a much smoother rise in the 1.4 GHz radio emission – followed by a somewhat slower decline towards the same level of background. For this region in the west of RCW~86 the 1.4 MHz emission profile has a more than ten times larger decay scale than the X-ray profile and may well be strongly influenced by adiabatic expansion effects, masking the comparatively weak radiative losses at those electron energies. We shall concentrate on this single profile which in any case yields the largest value of the effective field available for this source. The data for this profile appear to also have been used by Bamba et al. (2003b ) and Bamba (ba04 (2004)) in their analysis. Their exponential angular width leads to pc for the sharpest profile, that is very close to our estimate pc from the Rho et al. (rho02 (2002)) profile. However, even this profile is in the interior of RCW~86, not at the rim. It is possible that this part of the shock surface has a curvature due to an inhomogenuity of surrounding medium which is quite different from that of an ideal spherical surface. We therefore have to consider the likelihood of nonspherical geometry and thus of incomplete de-projection with a ratio , as in the case of RX~J1713.7-3946 below. Using nevertheless Eq.(2) for the time being, we obtain G for our estimate from the Rho et al. data and G for the Bamba et al. width. The shock has been assumed to move with a velocity of km/sec into a low-density medium with hydrogen density cm-3 at a kinematic distance of kpc, cf. Borkowski et al. (bor01 (2001)).
If we apply the model fit cf. Eq.(1) to the top profile of Fig. 8 of Rho et al. (rho02 (2002)) we obtain G with a /dof = 0.35, using 25 dof and assuming spherical geometry as our preferred value for full de-projection (see Fig. 7).

If we were to assume a distance of kpc to RCW~86 instead, the linear scales would decrease by a factor of about 3, increasing the effective field by a factor of about 2 to G. Whereas a value of G corresponds to a comparatively modest field amplification of about a factor of 5, we must therefore count on a very strong amplification in the case that the source is nearby. This would be no surprise, assuming that for the close distance the source might be as young as 2000 yr, instead of yr for the large distance (Borkowski et al. bor01 (2001)), resulting in a high shock velocity and correspondingly expected .
In reality however we must count on somewhat larger scales of the emissivity for the observed brightness scale . A ratio or even would reduce the above field amplification by a factor 0.69 or even 0.43, respectively. These appear realistic correction factors, given the fact that the shock transition lies in the outer part of the shell.
2.3 Kepler's SNR
Kepler's SNR is 400 yr old and has an angular radius of arcsec at a distance kpc (Reynoso & Goss rg99 (1999)). This implies a linear radius pc, somewhat smaller than Tycho's SNR. Like the optical and the radio continuum emission the X-ray brightness distribution from Kepler's SNR is rather asymmetric with stronger emission in the north and northwest (e.g. DeLaney et al. deL (2002); Cassam-Chena et al. 2004a ). The most obvious nonthermal hard X-ray continuum emission in the 4 - 6 keV range, as observed with XMM-Newton, is found in a southeastern region, rather at the opposite side of the remnant (Cassam-Chena et al. 2004a ), where also thin filaments have been observed with Chandra. The spectra of these filaments have been found to be hard without line-structures by Bamba et al. (2003b ) and by Bamba (ba04 (2004)), from Chandra archival data, with the conclusion that the filaments are the result of synchrotron emission. One profile has again the characteristics of a shock transition, for which they show a scale length of about pc in the 4.0-10.0 keV band.
Applying our de-projection model to this source despite its asymmetry, we obtain pc. Cassam-Chena et al. (2004a ) identify this southeastern part of the SNR as a very low density medium with cm-3 and a shock velocity km/s. Using this velocity in Eq.(3) for , and assuming an overall shock compression ratio of , we obtain from Eq.(2) the substantial field G, with an estimated error of less than 20%. Thus we conclude that there is substantial field amplification in Kepler's SNR.
2.4 SNR RX~J1713.7-3946
This very large degree diameter shell-type SNR in the Galactic plane was discovered in the ROSAT all-sky survey (Pfeffermann & Aschenbach pfe96 (1996)). The hard X-ray emission detected with ASCA turned out to be purely nonthermal and did not reveal any thermal emission (Koyama et al. koya97 (1997); Slane et al. sla99 (1999)). Recently a weak thermal component may have been detected in the interior of the remnant using large field-of-view X-ray instruments, including the RXTE Proportional Counter Array (PCA) (Pannuti et al. pann03 (2003)). The CANGAROO experiment reported a detection in TeV -rays at a level of 70% of the Crab Nebula (Muraishi et al. mur00 (2000); Enomoto et al. enomoto (2002)).
The H.E.S.S. experiment has confirmed (Aharonian et al. aha04 (2004)) the CANGAROO detection. The gamma-ray and X-ray images have similar shapes. There appears to be no doubt about the reality of this source in TeV gamma-rays.
The SNR is complex. New CO-observations by Fukui et al. (fukui (2003)) suggest the source to be rather close, at a distance of about kpc. A short distance of kpc has recently also been inferred by Cassam-Chena (2004b ) from an a detailed investigation of the X-ray absorbing material in the remnant together with the CO-observations.
Hard X-ray ( keV) observations with Chandra by Uchiyama et al. (uch03 (2003)) and Lazendic et al. (laze (2004)) revealed filaments in the remnant interior. They appear embedded in a diffuse plateau emission (Cassam-Chena 2004b ). According to Uchiyama et al. the most prominent and largest filament has a very small width of about 20 arcsec. For a distance of kpc this translates into a spatial scale of pc. At a different portion of this filament Lazendic et al. (laze (2004)) inferred a width of about 40 arcsec, i.e. twice as large. We note however that the width drived from the observed profiles depends appreciably on the assumed background level. For a lower background level than that assumed by Uchiyama et al. (uch03 (2003)) and Lazendic et al. (laze (2004)) the experimental width may be considerably higher, with a corresponding magnetic field value that is considerably lower than estimated below.
It is likely but not certain that the filament measured corresponds to a shock. A tangential discontinuity due to an internal structure of the circumstellar medium before the explosion or a discontinuity separating shocked ejecta from the shocked circumstellar medium cannot be excluded. To this physical possibility one must add the probability of shear-type three-dimensional convective flows, distinct from spherical expansion. In particular, the projection of such a structure along the line of sight might be far different in scale from that for a spherical structure with a radius comparable to the dimension of the overall object. It is indeed quite possible that the Chandra profile cuts have not crossed the outer shock, and therefore do not necessarily delineate the main field amplification region caused by the accelerated particles.
Nevertheless, we can attempt some estimates for different possible shock situations regarding the observed filament: (i) a shock transition of scale pc, assuming a compression ratio and a speed of km/s, and a low upstream density cm-3 (Cassam-Chena 2004b ) for an X-ray energy keV gives a maximum G; it reduces to G without any de-projection, , and to G for ; (ii) for a shock in a denser medium cm-3, with velocity km/s, the maximum G; it reduces to G for , and to G for . For the twice thicker Lazendic et al. filament the foregoing field values would reduce by a factor of about 0.6. This range of field strengths might provide an idea what to expect from interior structures inside this SNR. New high-resolution measurements appear necessary for the global picture.
2.5 Cas A
Extending Bamba et al. (2003b ), Bamba (ba04 (2004)) gives two Chandra profiles through the southeastern rim at X-ray energies keV whose average width is pc and which we convert to pc. Using the hydrodynamic solution of Berezhko et al. (2003b ) for the remnant dynamics, with a shock compression ratio and a shock speed km/s, we obtain G, taking keV. If we were to take km/s we would obtain G.
Vink & Laming (vl03 (2003)) have analyzed a profile with pc through the northeastern rim at keV, and assumed a shock velocity of km/s. For km/s and using this scale , we calculate G (Berezhko & Völk 2004a ).
These values from the two different profiles agree quite well with each other. They differ by less than 15 % from the spectrally determined value G from Berezhko et al. (2003b ).
2.6 SN 1006
For SN 1006 Bamba et al. (2003a , bam04 (2004)) for keV give exponential widths for the sharpest rim profile arcsec, which for the distance kpc translates into pc. Using a shock velocity km/s and a shock compression ratio , Eq.(2) yields a downstream field value G.
According to Bamba et al. (2003a , bam04 (2004)) and Bamba (ba04 (2004)) there is an even sharper profile with pc, which is however not a rim profile. With this leads to G.
These numbers can be compared to the average field value 120 G predicted from the overall synchrotron spectrum by Berezhko et al. (bkv02 (2002)), and depending very weakly on the ambient gas density. In fact, reconsidering the spectral determination of , we can achieve a preferred field value of 160 G (Ksenofontov et al. kse04 (2004)).
Taking into account the data uncertainty, which is about 25%, we can conclude that the above numbers derived from the Bamba et al. (2003a , bam04 (2004)) data are consistent with the values derived from the synchrotron spectrum. Together they confirm the overall field amplification picture for SN 1006. On the other hand, there may also be a physical reason for the differences in the values of across the shock surface. This might occur if in the polar caps independent magnetic flux tubes exist, between which the field strength and probably also the generating CR pressure can fluctuate considerably.
3 Discussion
All four newly calculated sources show amplified fields. In addition Tycho's SNR furnishes a third case where the field strength determined from small-scale synchrotron features agrees with that predicted by comparing the global synchrotron spectrum with nonlinear acceleration theory.
Although the field amplifications may be relatively small for RCW~86 and RX~J1713.7-3946 and are difficult to pin down, all six young Galactic SNRs with known filamentary scales exhibit field amplification. There appears to be no exception to this “rule” up to now.
As an important prerequisite the characteristic nonlinear emission features require a dominant nuclear component of accelerated particles. At the moment this conclusion is in part still a theoretical one: although the -ray flux at 1 TeV from Cas A, detected by the HEGRA experiment (Aharonian et al. 2001a ), agrees with the theoretically calculated hadronic flux there is as yet no confirmation by another experiment. SN 1006, reported by the CANGAROO experiment (Tanimori et al. tan98 (1998), tan01 (2001)) could not be detected by the H.E.S.S. experiment as a TeV source until now (Masterson et al. mas03 (2003); Rowell et al. row04 (2004)). An inverse Compton -ray emission scenario in a low magnetic field of order G (e.g. Pohl poh96 (1996), Mastichiadis & de Jager mas96 (1996); Tanimori et al. tan98 (1998), tan01 (2001)) is clearly excluded by the H.E.S.S. upper limits. The H.E.S.S. upper limit is almost one order of magnitude lower than the published CANGAROO flux. Given the range of ambient densities it suggests a low density ISM with cm-3 (Ksenofontov et al. kse04 (2004)) instead of the high value cm-3, which happened to fit the CANGAROO data (Berezhko et al. bkv02 (2002)). Finally, the predicted hadronic gamma-ray flux for Tycho's SNR (Völk et al. vbkr02 (2002)) is still below the upper limit measured by HEGRA (Aharonian et al. 2001b ). Only RX~J1713.7-3946 has been detected by two independent gamma-ray experiments.
In all cases the gamma-ray emission depends strongly on ”external” astronomical parameters, like the ambient gas density, and therefore requires extensive multi-wavelength investigations with significant inherent uncertainties.
Regarding the magnetic field strengths derived we can attempt to learn something from these results by empirically correlating the magnetic field pressure with the ram pressure of the upstream gas in the shock frame of reference. Assuming that reaches some fraction of the CR pressure at the shock, and assuming very efficient acceleration so that , with , we expect a constant ratio as a function of shock velocity for an individual object. This appears to us to be the physically most natural result, given the overall dynamics in the shock (see also the discussion in Völk et al. vbkr02 (2002)). Berezhko & Völk (2004b ) have used this assumption to calculate the proton and electron spectra for a generic SNR with field amplification. The result is that the proton component reaches the so-called knee in the Galactic CR spectrum with a maximum momentum c.
In numbers the ratio of magnetic and kinetic energy densities is given by:
| (7) |
where may itself implicitly depend on if it is determined from Eqs.(2) and (3).
On the other hand, Bell (bell04 (2004)) has argued for a proportionality from his quasi-MHD simulations of the nonresonant right-hand polarized low frequency MHD mode. This implies a linear increase of with . Bell has suggested that acceleration even considerably beyond the knee may be possible in this way in very young SNRs expanding into dense circumstellar material. This extends earlier arguments put forward by Bell & Lucek (bluc01 (2001)) who estimated the maximum achievable energy . However, the results of Berezhko & Völk (2004b ) indicate that the energy content of the fastest part of the supernova ejecta, which produces CRs with energies above the knee energy eV, is so small that the resultant CR spectrum produced in SNRs is very steep . Therefore these highest energy CRs play no signigifant role in the formation of the Galactic CR spectrum above the knee. The reason is the shortness of the time period during the initial SNR phase over which a very high energy flux density into the shock is maintained.
Obviously we can not follow an individual source as it evolves in time. The only possibility is to make the strong assumption that different objects at different epochs of their expansion history behave like a single source at such points in its evolution. I.e. we can substitute an ensemble average for a time average. Given that we consider here even different types of SN explosions (Type Ia for SN~1006, Tycho, and possibly Kepler, probably type II for RX~J1713.7-3946 and RCW~86, and probably type Ib for Cas A), conclusions must be drawn with this fact in mind.
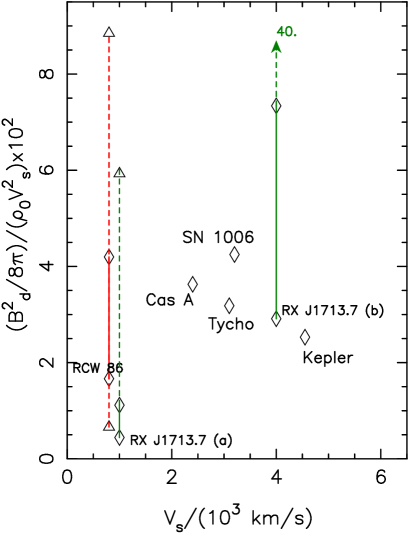
Fig. 8 shows a plot of vs. for the six sources discussed in the previous section. For Tycho's SNR, SN~1006, and Cas A the available globally determined field values were used. For the sources with rim profiles (Tycho's SNR, SN~1006, Kepler's SNR, and Cas A) we have assumed the full de-projection , and cm-3 and cm-3 for SN~1006 and Cas~A, respectively.
For RCW~86 we have assumed a range of uncertainty (the four points in Fig. 8 correspond to , 2, 4 and 7, respectively), and for RX~J1713.7-3946 we have taken the even more pessimistic range (the three points in Fig. 8 correspond to , 2 and 7). These values correspond to the discussion of these two sources in the previous section.
For RX~J1713.7-3946 we have in addition plotted the two alternatives corresponding to km/s and cm-3 on the one hand, and km/s and cm-3 on the other.
The present uncertainties in the data, which are not more accurate than 25% and cover only a rather limited range of the shock speed , do not allow a distinction between a constant ratio and one with a linear growth of with . However, the data are highly likely to exclude a decrease of with increasing . Obviously this means that with growing age, that is decreasing shock velocity, the field amplification in SNRs decreases about linearly with the shock velocity. Fig. 8 indicates that in all young SNRs with large enough shock speed km/s the effective (amplified) magnetic field energy density is near , the value for Kepler's SNR probably having the largest uncertainty. It is important to note that in all four of the best defined cases (SN~1006, Cas~A, Tycho's SNR and Kepler's SNR), which are characterized by rather close values of the shock speed, the normalized magnetic field pressures, extracted from the data, are also close to each other. The large uncertainties in the determined magnetic field values for the cases of RCW~86 and RX~J1713.7-3946 are due to much more poorly known values of their relevant parameters, such as age, distance, shock speed and ISM gas density.
We thus tentatively conclude that field amplification is confined to young remnants. This also implies that the escape of the highest energy nuclear particles, accelerated at an earlier epoch with high effective field, becomes progressively important as the remnant age increases. This implies a lower and lower cutoff of the resulting gamma-ray spectrum from a SNR with age. As a result, the highest energy nuclear particles are to be found in SNRs that have just reached the Sedov phase. Older remnants are increasingly unable to confine them.
The amplified magnetic field also leads to a depression of the Inverse Compton and nonthermal Bremsstrahlung gamma-ray emission relative to the hadronic emission for young remnants, given the synchrotron emission. Nevertheless the hadronic gamma-ray emission depends strongly on , essentially (Völk voel03 (2003)). Thus a strong source of nuclear CRs can still be a gamma-ray source with a comparable or even preponderant IC emission. Ultimately even SN 1006 might turn out as an example for that case, since its must be quite small .
4 Conclusions
From the fact that magnetic field amplification occurs in all the young SNRs for which relevant data exist, and given the strong theoretical connection between magnetic field amplification and efficient acceleration of nuclear CRs, we tentatively conclude that the Galactic SNRs are the source population of the Galactic CRs.
Quantitatively, with Cas~A, SN~1006, and now Tycho's SNR from this paper, there exist three examples where nonlinear acceleration theory and X-ray observations of filamentary structures give the same morphology and the same magnetic field amplification effect: the effective interior magnetic field energy density is near . The estimates made for the cases of Kepler's SNR, RCW~86 and RX~J1713.7-3946 confirm such a conclusion although less definitely so due to their less well-defined parameter values.
The data suggest that field amplification and thus the acceleration of nuclear particles to the highest energies that correspond to the knee in the observed CR spectrum (Berezhko & Völk 2004b ), or even possibly beyond (Bell & Lucek bluc01 (2001); Bell bell04 (2004)), is a transitory effect in CR sources, limited to the early evolutionary phase of SNRs. This agrees with theoretical expectations. From acceleration theory the later phases of SNR evolution, which are characterized by decreasing shock speeds, should then maintain the lower energy particle population produced early on, in a balance between adiabatic expansion and continuing acceleration.
The highest-energy gamma-rays emitted from the CR sources should be observable only during the early phases of evolution, roughly at the end of the SNR sweep-up phase, before the highest energy particles have already left the source.
Acknowledgements.
We thank A. R. Bell and G. Pühlhofer for critical discussions. This work has been supported in part by the Russian Foundation for Basic Research (grant 03-02-16524). EGB acknowledges the hospitality of the Max-Planck-Institut für Kernphysik, where this work was carried out.References
- (1) Achterberg, A. 1983, A&A, 119, 274
- (2) Aharonian, F. A., Akhperjanian, A., Barrio, J., et al. 2001, A&A, 370, 112
- (3) Aharonian, F. A., Akhperjanian, A., Barrio, J., et al. 2001, A&A, 373, 292
- (4) Aharonian, F. A., Akhperjanian, A., Aye, K.-M., et al. 2004, Nature, 432, 75
- (5) Axford, W. I., Leer, E., & McKenie, J. F. 1982, A&A, 111, 317
- (6) Bamba, A. 2004, ISAS RN 777; ISAS Yoshinodai, Sagamihara, Kanagawa 229-8510 (preprint)
- (7) Bamba, A., Yamazaki, R., Ueno, M., & Koyama, K. 2003a, ApJ, 589, 827
- (8) Bamba, A., Yamazaki, R., Ueno, M., et al. 2003b, in: Proc. 28th ICRC (Tsukuba), Eds.: T.Kajita, Y. Asaoka, A. Kawachi, Y. Matsubara, M. Sasaki, Universal Academy Press Inc. Tokyo, Japan, vol. 4, 2413
- (9) Bamba, A., Yamazaki, R., Ueno, M., Koyama, K. 2004, Adv. Space Res., 33, 376
- (10) Bell, A. R. 1978, MNRAS, 182, 147
- (11) Bell, A. R. 2004, MNRAS, 353, 550
- (12) Bell, A. R. & Lucek, S. G. 2001, MNRAS, 327, 433
- (13) Berezhko, E. G., Elshin V. K. & Ksenofontov, L. T. 1996, JETP, 82, 1
- (14) Berezhko, E. G., Ksenofontov, L. T., & Völk, H. J. 2002, A&A, 395, 943
- (15) Berezhko, E. G., Ksenofontov, L. T., & Völk, H. J. 2003a, A&A, 412
- (16) Berezhko, E. G., Pühlhofer, G., & Völk, H. J. 2003b, A&A, 400, 971
- (17) Berezhko, E. G. & Völk, H. J. 1997, Astropart. Phys., 7, 183
- (18) Berezhko, E. G. & Völk, H. J. 2004a, A&A, 419, L27
- (19) Berezhko, E. G. & Völk, H. J. 2004b, A&A, 427, 525
- (20) Blandford, R. D., & Ostriker, J. P. 1978, ApJ, 221, L29
- (21) Blandford, R. D. & Eichler, D. 1987, Phys. Rep., 154, 1
- (22) Borkowski, K. J., Rho, J., Reynolds, S. P., & Dyer, K. K. 2001, ApJ, 550, 334
- (23) Buckley, J. H., Akerlof, C. W., Carter-Lewis, D. A., et al. 1998, A&A, 329, 639
- (24) Cassam-Chena, G., Decourchelle, A., Ballet, J., et al. 2004a, A&A, 414, 545
- (25) Cassam-Chena, G., Decourchelle, A., Ballet, J., et al. 2004b, 427, 199
- (26) DeLaney, T., Koralesky, B., & Rudnick, L. 2002, ApJ, 580, 914
- (27) Dickel, J. R., Strom, R. G., & Milne, D. K. 2001, ApJ, 546, 447
- (28) Drury, L. O’C. 1983, Rep. Prog. Phys., 46, 973
- (29) Drury, L. O’C. & Völk, H. J. 1981, ApJ, 248, 344
- (30) Ellison , D. C. & Eichler, D. 1984, ApJ, 286, 691
- (31) Enomoto, R., Tanimori, T., Naito, T., et al. 2002, Nature, 416, 823
- (32) Fukui, Y., Moriguchi , Y., Tamura, K. et al. 2003, PASJ, 55, L61
- (33) Hwang, U., Decourchelle, A., Holt, S. S., & Petre, R. 2002, ApJ, 581, 1101
- (34) Katz-Stone, D. M., Kassim, N. E., Lazio, T. J. W., & O’Donnell, R. 2000, ApJ, 529, 453
- (35) Koyama, K., Kinugasa, K., Matsuzaki, K. et al. 1997, PASJ, 49, L7
- (36) Ksenofontov, L. T., Berezhko, E. G., & Völk, H. J. 2004, in: Proc. Int. Symp. on High Energy Gamma-Ray Astronomy, Heidelberg (eds. F. A. Aharonian & H. J. Völk), to be published by AIP, Melville, New York
- (37) Lazendic, J. S., Slane, P. O., Gaensler, B. M., et al. 2004, ApJ, 602, 271
- (38) Long, K. S., Reynolds, S. P., Raymond, J. C., et al. 2003, ApJ, 586, 1162
- (39) Lucek, S. G. & Bell, A. R. 2000, MNRAS, 314, 65
- (40) Masterson, C. (H.E.S.S. Collaboration) 2003, in: Proc. 28th ICRC (Tsukuba), Eds.: T.Kajita, Y. Asaoka, A. Kawachi, Y. Matsubara, M. Sasaki, Universal Academy Press Inc. Tokyo, Japan, vol. 4, 2323
- (41) Mastichiadis, A. & de Jager, O. C. 1996, A&A, 311, L5
- (42) McKenzie, J. F. & Völk, H. J. 1982, A&A, 116, 191
- (43) Muraishi, H., Tanimori, T., & Yanagita, S. 2000, A&A, 354, L57
- (44) Pannuti, T. G., Allen, G. E., Houck, J. C., & Sturner, S. J. 2003, ApJ, 593, 377
- (45) Pfeffermann, E. & Aschenbach, B. 1996, in: Röntgenstrahlung from the Universe. (Eds. H.U. Zimmermann, J. Trümper & H. Yorke (MPE Rep. 263, Garching), 267
- (46) Pohl, M. 1996, A&A, 307, L57
- (47) Prahl, J. & Prosch, C. 1997, in: Proc. 25th ICRC (Durban), v.3, p. 217
- (48) Reynolds, S. P. & Ellison, D. C. 1992, ApJ 399, L75
- (49) Reynoso, E. M., Moffett, D. A., Goss, W. M. et al. 1997, ApJ, 491, 816
- (50) Reynoso, E. M. & Goss, W. M. 1999, ApJ, 118, 926
- (51) Reynoso, E. M., Velazquez, P. F., Dubner, G. M., Goss, W. M. 1999, AJ 117, 1827
- (52) Rho, J., Dyer, K. K., Borkowski, K. J., & Reynolds, S. P. 2002, ApJ, 581, 1116
- (53) Rosado, M., Ambrocio-Cruz, P., LeCoarer, E., & Marceli, M. 1996, A&A, 315, 243
- (54) Rowell, G. (H.E.S.S. Collaboration) 2004, in: Proc. of Int. Symp. on High Energy Gamma-Ray Astronomy, Heidelberg (eds. F. A. Aharonian & H. J. Völk), to be published by AIP, Melville, New York
- (55) Sinitsina, V. G., Alaverdian, A. Y., Arsov, T. P., et al. 2003, in: Proc. 28th ICRC (Tsukuba), Eds.: T. Kajita, Y. Asaoka, A. Kawachi, Y. Matsubara, M. Sasaki, Universal Academy Press Inc. Tokyo, Japan, vol.4, 2369
- (56) Slane, P., Gaensler, B. M., Dame, T. et al. 1999, ApJ, 357, SL99
- (57) Tanimori, T., Hayami, Y., Kamei, S. et al. 1998, ApJ, 497, L25
- (58) Tanimori, T., Naito, T., Yoshida, T. et al. 2001, in: Proc. 27th ICRC (Hamburg), vol. 6, 2465
- (59) Uchiyama, Y., Aharonian, F. A., & Takahashi, T. 2003, A&A, 400, 567
- (60) Vink, J. & Laming, J. M. 2003, ApJ, 548, 758
- (61) Völk, H. J., 1984, In ”High Energy Astrophysics”, 19th Recontre de Moriond (ed. Tran Than Van). Editions Frontieres, Gif sur Yvette, p.281
- (62) Völk, H. J. 1997, in: ”Towards a Major Atmospheric Cherenkov Detector – V”, ed. O.C. de Jager (WESPRINT, Potchefstroom), p. 87
- (63) Völk, H.J. 2003, in: Proc. 28th ICRC (Tsukuba); Eds.: T.Kajita, Y. Asaoka, A Kawachi, Y. Matsubara, M. Sasaki, Universal Academy Press Inc. Tokyo, Japan (Invited papers), vol. 8, 29; astro-ph/0312585.
- (64) Völk, H. J., Morfill, G. E. & Forman, M.A. 1981, ApJ, 249, 161
- (65) Völk, H. J., Berezhko, E. G., Ksenofontov, L. T., & Rowell, G. P. 2002, A&A, 396, 649
- (66) Völk, H. J., Berezhko, E. G. & Ksenofontov, L. T. 2003, A&A, 409, 563