Near-Infrared Photometry and Spectroscopy of L and T Dwarfs: The Effects of Clouds, Gravity, and Effective Temperature
Abstract
We present new photometry on the MKO system for a large sample of L and T dwarfs identified from SDSS and 2MASS and classified according to the scheme of [*]geb02. We have compiled a sample of 105 L and T dwarfs that are uniformly classified and measured on a single photometric system. The scattered spectral indices and colors of L dwarfs are likely caused by variations in the altitudes, distributions, and thicknesses of condensate clouds. Scatter in the – colors of late T dwarfs probably reflects the sensitivity of the -band flux to pressure induced H2 opacity, which itself is sensitive to surface gravity. The luminosities of late-T dwarfs are 1.5–2.5 times fainter than predicted under conditions of chemical equilibrium. We have computed and for 42 L and T dwarfs whose trigonometric parallaxes have been measured. We find that K for types L7–T4, which supports recent models that attribute the changing -band luminosities and spectral features across the L–T transition to rapid changes in the condensate clouds over a narrow range of . We compute –750 K for 2MASS 0415-0935 (T9), which supplants Gl 570D as the coolest known brown dwarf.
keywords:
infrared: stars – stars: fundamental parameters – stars: late-type – stars: low-mass, brown dwarfs1 Photometric Data
We have compiled complete or partial 1–5 m photometry for 105 spectroscopically-confirmed L and T dwarfs using United Kingdom Infrared Telescope (UKIRT) imaging cameras and UKIRT and Mauna Kea Observatory (MKO) filters. Diagrams of color versus near-infrared spectral type ([\astronciteGeballe et al.2002]) are shown in Figure 1 for various combinations of bandpasses.
The through colors of L dwarfs are scattered because their 1–m “photospheres” coincide with clouds of Fe and silicate condensates with varying optical depths ([\astronciteAckerman & Marley2001], [\astronciteMarley et al.2002], [\astronciteTsuji2002]). Thus, near-IR colors are not good indicators of L subtype. On the other hand, – is a good indicator of T subtype presumably because, for K, the condensate clouds have settled below the near-infrared photosphere. Conversely, – is broadly scattered among T dwarfs because the flux is affected by pressure-induced H2 absorption, which is very sensitive to surface gravity ([\astronciteBurgasser et al.2002], and references therein). The – colors of T dwarfs are also scattered, possibly because of variable process(es) responsible for removing condensates at the L–T transition, or because the flux is affected by the gravity- and metallicity-sensitive wings of the Na-D and K resonance lines.
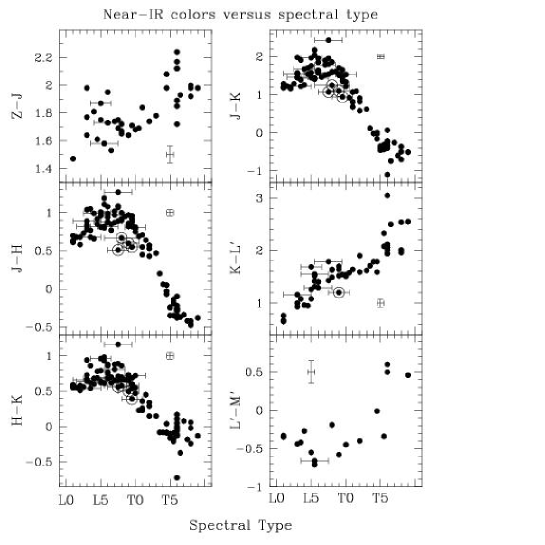
The – and – colors of L6–T4 dwarfs are nearly constant. The constancy of – over this range of types is explained by balanced CH4 absorption in the and bands and the redistribution of continuum flux as the condensate clouds settle. On the other hand, – is largely unaffected by the settling clouds. Its constancy for types L6–T4 reflects the constancy of throughout the L–T transition. (See §3.)
2 Spectroscopic Data
We have obtained spectra of 23 new L dwarfs and 14 new T0–T7 dwarfs identified from the Sloan Digital Sky Survey (SDSS) photometric database using UKIRT’s CGS4 and UIST spectrographs. We have also obtained new spectra of 11 L and T dwarfs previously identified from the Two-Micron All Sky Survey (2MASS), including the coolest known T dwarf, 2MASS J0415–0935. We have classified these dwarfs according to the scheme of [*]geb02. Our augmented sample shows that some spectral indices of this scheme are not internally consistent for L dwarfs because of their apparent sensitivity to cloud optical depth. Some adjustment of these indices is warranted.
Figure 2 shows the and spectra of representative T6, T7, T8, and T9 dwarfs. These spectra show a steady increase in the depths of the H2O and CH4 bands with increasing spectral type. The relatively small spectral differences between the dwarfs designated T8 and T9 may be more indicative of a half-subtype increment, rather than a whole-subtype increment. Regardless, this sequence suggests that there is room for one more subtype, which would have essentially zero flux at 1.45, 1.7, and 2.25 m.

The effects of varying cloud optical depth and gravity are manifested not only in the broadband colors of L and T dwarfs (§1), but in the equivalent widths of narrower atomic and molecular absorption lines. Figure 3 compares the spectra of three unusually blue late-L dwarfs (marked with circles in Figure 1) with those of more typical L dwarfs. The enhanced strengths of the FeH and K I features in the former group mimic those of earlier L dwarfs, which suggests that either the condensate clouds of these late-L dwarfs are unusually thin, or these dwarfs have low metallicity.


Figure 4 shows spectra of several T6 and T8 dwarfs that exhibit progressively stronger absorption by K I at 1.243 and 1.254 m. Recent investigations of spectroscopic gravity indicators in T dwarfs indicate that this doublet strengthens with decreasing gravity ([\astronciteMartín & Zapaterio Osorio2003]). This trend is supported by the increasing – colors of these dwarfs (see Figure 7), which reflect progressively less pressure-induced H2 absorption of -band flux as gravity decreases ([\astronciteBurgasser et al.2002]).
3 Bolometric Corrections and
We used our spectra, our photometry, and recently published parallaxes ([\astronciteDahn et al.2002], [\astronciteTinney, Burgasser, & Kirkpatrick2003], [\astronciteVrba et al.2004]) to compute and for late-M, L, and T dwarfs. In doing so, we assumed a Rayleigh-Jeans flux distribution longward of appropriately corrected for CH4 and CO absorption between 3 and m. We used available photometry to confirm the accuracy of these assumptions. To compute , we adopted the ranges of brown-dwarf radii predicted by the evolutionary models of [*]bur97, [*]bar98, and [*]cha00 for ages 0.1–10 Gyr. (Narrower ranges were used for those dwarfs whose ages have been spectroscopically constrained.) Nominal values of for each dwarf were computed assuming a mean age of 3 Gyr for the solar neighborhood ([\astronciteDahn et al.2002]).

Figure 5 shows the behavior of and as a function of spectral type. rises from M5 to L5 due to Wien shift and enhanced luminosity as clouds settle below the photosphere. It declines after L5 because of increasing CH4 absorption at m. The scatter among late-T dwarfs shows the sensitivity of H2 absorption to gravity variations. declines steeply and monotonically for types M6–L7 and T4–T9, but is nearly constant ( K) over the L–T transition. This constancy indicates that the condensate clouds settle, thin, or disintegrate over a small range of . Thus, the presently defined L and T spectral classes are not proxies for a uniformly decreasing scale. We compute –750 K for the T9 dwarf 2MASS 0415-0935, which supplants Gl 570D as the coolest known brown dwarf.
4 Comparison with Precipitating Cloud Models
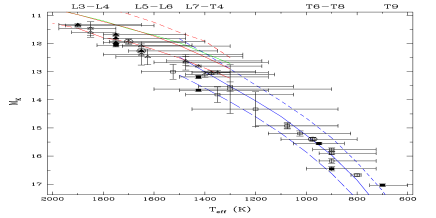
We compare our absolute photometry with the magnitudes and colors of L and T dwarfs predicted by the precipitating cloud models of [*]ack01 and [*]mar02. The models are parametrized by , which describes the sedimentation efficiency relative to the upward transport of condensates by convection. Figure 6 shows as functions of spectral type and – color. A polynomial fit to the data in the left panel emphasizes the brightening luminosity between types T0 and T4. This “early-T” hump ([\astronciteTinney, Burgasser, & Kirkpatrick2003]) is probably caused by the thinning, settling, and/or break-up of the cloud deck, which allows flux to emerge from deeper layers of the atmosphere.
Overplotted in the right panel of Figure 6 are model sequences for , 5, and (no clouds) and different gravities (log ). The models match the L dwarf data well, but do not turn fast enough to match the T dwarf data, which are better matched by the cloudless models. The dotted lines connect the K points (triangles) on each model sequence. These lines bound the L–T transition, which suggests that holes in the cloud deck develop rapidly over a narrow range of . This notion is supported by the nearly constant K measured bolometrically for types L7–T4 (Figure 5).

Figure 7 is a – versus – diagram for T dwarfs overlayed with model sequences for various combinations of and gravity. Because the radii of brown dwarfs older than 200 Myr vary by % ([\astronciteMarley et al.1996]; [\astronciteBurrows et al.2001]), gravity is tightly correlated with mass. Thus the solid curves in Figure 7 are effectively evolutionary tracks of brown dwarfs with masses of (left to right) 75, 35, 15, and . Consequently, the T5.5 dwarf SDSS J1110+0116 may be a 10– brown dwarf. As stated in §1, the fluxes of T dwarfs are highly sensitive to gravity-dependent, pressure-induced H2 absorption. Thus, – is a good indicator of mass, such that bluer – reflects higher mass for a given T subtype.

5 Effects of Nonequilibrium Chemistry
The model atmospheres of [*]mar02 assume all species are in thermochemical equilibrium. However, the -band spectrum of the archetypal T dwarf Gl 229B shows absorption at m by overabundant CO dredged upward from hotter regions by convective mixing ([\astronciteNoll, Geballe, & Marley1997]; [\astronciteOppenheimer et al.1998]). The same phenomenon should occur in other late-T dwarfs.
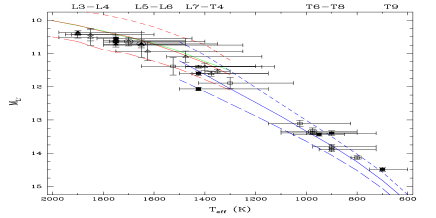
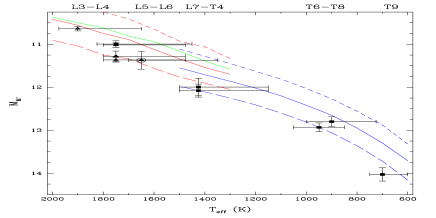
Figure 8 compares the cloudy and cloud-free models of [*]mar02 with our measurements of , , and versus for L and T dwarfs. The log –5.5 cloudy models match , , and well for L and early-T dwarfs. The log –5.0 cloud-free models generally match and for late-T dwarfs, but they overestimate the luminosities of these dwarfs by factors of 1.5 to 2.5. We attribute these flux deficits to nonequilibrium abundances of CO, as shown by the vertical-mixing models of [*]sau03. These overpredicted fluxes affect the expected sensitivities of m searches for even cooler, “infra-T” dwarfs, as are planned with the Spitzer Space Telescope.
References
- [\astronciteAckerman & Marley2001] Ackerman, A. S., & Marley, M. S. 2001, ApJ, 556, 872
- [\astronciteBaraffe et al.1998] Baraffe, I., et al. 1998, A&A, 337, 403
- [\astronciteBurgasser et al.2002] Burgasser, A. J., et al. 2002, ApJ, 564, 421
- [\astronciteBurrows et al.1997] Burrows, A., Marley, M., et al. 1997, ApJ, 491, 856
- [\astronciteBurrows et al.2001] Burrows, A., et al. 2001, Rev. Mod. Phys., 73, 719
- [\astronciteChabrier et al.2000] Chabrier, G., et al. 2000, ApJ, 542, 464
- [\astronciteDahn et al.2002] Dahn, C. C., et al. 2002, AJ, 124, 1170
- [\astronciteGeballe et al.2002] Geballe, T. R., et al. 2002, ApJ, 564, 466
- [\astronciteGolimowski et al.2004] Golimowski, D. A., et al. 2004, AJ, 127, 3516
- [\astronciteKnapp et al.2004] Knapp, G. R., et al. 2004, AJ, 127, 3553
- [\astronciteMarley et al.1996] Marley, M. S., et al. 1996, Science, 272, 1919
- [\astronciteMarley et al.2002] Marley, M. S., et al. 2002, ApJ, 568, 335
- [\astronciteMartín & Zapaterio Osorio2003] Martín, E. L., & Zapaterio Osorio, M. R. 2003, ApJ, 593, L113
- [\astronciteNoll, Geballe, & Marley1997] Noll, K. S., Geballe, T. R., & Marley, M. S. 1997, ApJ, 489, L87
- [\astronciteOppenheimer et al.1998] Oppenheimer, B. R., et al. 1998, ApJ, 502, 932
- [\astronciteSaumon et al.2003] Saumon, D., et al. 2003, in IAU Symp. 211, Brown Dwarfs, ed. E. Martín (San Francisco: ASP), 345
- [\astronciteTinney, Burgasser, & Kirkpatrick2003] Tinney, C., Burgasser, A., & Kirkpatrick, J. 2003, AJ, 126, 975
- [\astronciteTsuji2002] Tsuji, T. 2002, ApJ, 575, 264
- [\astronciteVrba et al.2004] Vrba, F. J., et al. 2004, AJ, 127, 2948