The ultraviolet and optical spectra of luminous B-type stars in the Small Magellanic Cloud
Abstract
We present ultraviolet spectra from the Space Telescope Imaging Spectrograph (STIS) of 12 early B-type stars in the Small Magellanic Cloud (SMC), comprising 9 supergiants and 3 giants. A morphological comparison with Galactic analogues is made using archival data from the International Ultraviolet Explorer (IUE). In general, the intensity of the P Cygni emission in the UV resonance lines is greater, and seen to later spectral types, in the Galactic spectra than in their metal-deficient SMC counterparts; we attribute these effects as most likely arising from weaker stellar winds in the SMC targets, as predicted by radiatively driven wind theory.
We also include unpublished STIS observations of two late O-type stars in the SMC. In combination with the B-type observations, and published O-type data, we now have an extensive ultraviolet spectral library of metal-deficient stars, of use in the study of unresolved starbursts and high redshift, star-forming galaxies. In this context, we present empirical measurements for the B-type spectra of the new ‘1978 index’ suggested by Rix et al. as a probe of metallicity in such systems.
1 Introduction
Ultraviolet (UV) spectra are useful in the study of relatively nearby blue galaxies undergoing intense star formation (so-called starburst galaxies), and in high redshift star-forming galaxies in which the stellar UV features are shifted into the optical. Studies of the composite spectra from such unresolved, star-forming systems generally rely on spectral libraries to investigate the stellar populations therein, with the libraries compiled from UV observations of individual early-type stars (e.g. Leitherer et al. 2001).
Distant star-forming systems are often less chemically evolved than the Milky Way (e.g. Pettini et al. 2002). With a metallicity of roughly one-fifth solar (e.g. Venn, 1999), the Small Magellanic Cloud (SMC) offers an excellent opportunity for compilation of UV spectral libraries more appropriate to the accurate interpretation of metal-poor unresolved systems than if Galactic templates were used. Libraries of high-quality UV data also enable detailed comparisons with the synthetic spectra calculated from stellar atmosphere codes, with a view to including theoretical spectra into population synthesis models.
Walborn et al (2000; hereafter Paper 1) presented a high-resolution UV spectral atlas of O-type stars in the SMC using data obtained with the Hubble Space Telescope (HST) Space Telescope Imaging Spectrograph (STIS) from Guest Observer program GO7437. The incorporation of these spectra into the population synthesis code starburst99, and an assessment of their impact on the resultant integrated spectra has been presented by Leitherer et al. (2001). However, as De Mello et al. (2000) demonstrated, the contribution from B-type stars in integrated UV spectra can be important in young stellar populations. With this in mind we obtained new STIS spectroscopy of 12 B-type stars in the SMC, with the sample selected to cover a range of effective temperatures and luminosities. These data have already been used to constrain the age of the stellar population observed in a ‘super-star cluster’ in the starburst galaxy NGC 1705 (Vzquez et al. 2004), illustrating their usefulness in the study of unresolved populations.
The new B-type STIS spectra have a much greater wavelength coverage than those in Paper 1 (1150-2350 cf. 1150-1750), achieved by observing each target using the echelle gratings at two central wavelengths (see Section 2). Our motivation behind this strategy was to obtain high resolution observations of the iron ‘forest’ of absorption lines from Fe2+, which lies in the 1850-2100 region. Since these observations, Rix et al. (2004) have published a theoretical study in which synthetic UV spectra from the WM-Basic code (Pauldrach et al. 2001) are included in starburst99. They advocate an equivalent-width index centered at 1978 Å as a useful metallicity indicator, and the new STIS data presented here offer an opportunity to begin to calibrate this index empirically.
Aside from their use as spectral templates, UV observations of individual early-type stars in the SMC enable detailed studies of stellar evolution and radiatively driven winds in a metal-poor environment. For instance, some of the O-type spectra presented in Paper 1 were used in detailed model atmosphere analyses by Bouret et al. (2003) and Hillier et al. (2003). Similarly, four of the B-type STIS spectra discussed here were used by Evans et al. (2004a) to determine stellar wind terminal velocities (), that were then used in the analysis of the optical spectra by Trundle et al. (2004).
Here we primarily concern ourselves with a discussion of the morphological phenomena seen in the UV spectra of our SMC targets, and compare them with Galactic analogues observed with the International Ultraviolet Explorer (IUE) telescope. We also discuss the correlation between the new UV data and high-resolution optical data of our targets, in particular including observations of the H Balmer line.
2 Observations
2.1 UV spectroscopy
For our General Observer program (GO9116) we observed 12 B-type stars in the SMC using the STIS; observational parameters of our targets are given in Table The ultraviolet and optical spectra of luminous B-type stars in the Small Magellanic Cloud. Each star was observed at two central wavelengths in echelle mode; with the far-UV MAMA (Multi-Anode Microchannel Array) detector and the E140M grating (centered at 1425 Å), and with the near-UV MAMA and E230M grating (centered at 1978 Å). The echelle observations were made through the entrance aperture and the effective spectral resolving powers of the E140M and E230M gratings are and 30,000 respectively. The exposure times were set from consideration of low-resolution spectra and are given in Table The ultraviolet and optical spectra of luminous B-type stars in the Small Magellanic Cloud.
The primary calstis processing steps are described in Paper 1, with the difference here that the two-dimensional inter-order background correction performed manually in those reductions has now been incorporated into the standard pipeline as sc2dcorr. As described by Evans et al. (2004a), after pipeline reduction the individual echelle orders were extracted and merged to form a continuous spectrum. Prior to merger (typically) 25 pixels at both ends of each order are clipped; the spectral overlap between orders is generally large enough to accommodate this and the final result has a more consistent signal-to-noise ratio than that obtained otherwise. Blueward of 1650 Å there is a significant decrease in the signal-to-noise ratio of the E230M data. therefore this region is removed. The E140M and E230M spectra are then merged to form a final spectrum covering 1150-2350 Å. For display purposes (and for consistency with Paper 1) the spectra are binned to 0.25 Å per data point. The signal-to-noise ratio (on the basis of photon statistics) is typically in the range of 20-30 per binned data point.
In Table The ultraviolet and optical spectra of luminous B-type stars in the Small Magellanic Cloud we also give H I column densities, (H I), toward our targets, found assuming that Lyman- has a pure damping profile (e.g. Shull & Van Steenberg 1985). To avoid possible contamination by the N V 1239, 1243 doublet, we consider only the blueward wing when deriving the tabulated values. The column densities are consistent with those for other stars in the SMC, e.g. Tumlinson et al. (2002).
There are archival spectra from the Far Ultravoiolet Spectroscopic Explorer (FUSE) of the type Ia stars, however many suffer from large column densities of H2 and, in the context of the present discussion, reveal little further information such that they are not considered here (A. Fullerton, private communication, 2004).
2.1.1 Additional UV observations of O-type stars
Observations for the GO7437 program were incomplete when Paper 1 was written. We now briefly discuss additional STIS observations with the E140M grating of AzV 423 (Azzopardi & Vigneau 1975, 1982) and NGC 346 MPG 487 (Massey et al. 1989). The optical spectrum of AzV 423 was classified as O9.5 II(n) by Walborn et al. (2002), in their discussion of its spectrum from ; the data for this star have not been published previously. NGC 346 MPG 487 was classified as O8 V by Evans (2001) and Bouret et al. (2003), with the latter presenting a model atmosphere analysis in which parts of the STIS spectrum were shown (their Figure 9) These two stars were not incorporated in starburst99 with the main O-type sample (Leitherer et al., 2001) and offer additional early-type template spectra for population synthesis work.
The two STIS spectra are shown in Figure 1. The spectrum of NGC 346 MPG 487 is primarily photospheric in origin and complements the data in Paper 1 well, providing better sampling of the main sequence. The new spectrum of AzV 423 is more interesting, particularly in comparison to that of AzV 327 from Paper 1 (also shown in Figure 1; the Si IV and C IV profiles are more strongly in emission in AzV 423, although the C IV absorption is weaker. In contrast, the N V doublet displays relatively strong emission in AzV 327, compared to none in AzV 423. We also have unpublished, red optical data for these two stars from the University College London echelle spectrograph (UCLES) at the 3.9-m Anglo-Australian Telescope (AAT); the H Balmer profiles of both stars are in absorption and are practically identical. Comparisons of the blue optical data (see Paper 1 and Walborn et al. 2002) are complicated somewhat by the slightly broader lines in AzV 423, but it appears that C III is stronger, and N III weaker, in AzV 423. We suggest that the differences in the UV spectra may arise from different amounts of mixing of CNO-processed material into the atmosphere and winds of the two stars. Note that the spectrum of AzV 327 in Figure 1 appears to be noisier than that of AzV 423; the exposure times were identical and the cosmetic difference arises from the (apparently) faster rotation of AzV 423. Considering their similar magnitudes (suggesting similar physical luminosities) future quantitative analysis of these stars would be of interest.
2.2 Optical data
In addition to the UV data we also consider high-resolution optical spectra of our targets. Blue and red region optical spectra of the eight targets from the AzV catalogue were obtained with the UV-Visual Echelle Spectrograph (UVES) at the ESO Very Large Telescope (VLT) in November 2001. The effective resolving power of the UVES set-up was and the signal-to-noise ratio of the data was in excess of 100. Full observational details are given by Trundle et al. (2004). For AzV 22 and 362, the H spectra are those from the New Technology Telescope (NTT) using the ESO Multi Mode Instrument (EMMI). These are preferred over the VLT data following the discussion of nebular contamination by Trundle et al.
Blue region spectra for the four targets in NGC 330 were obtained using the CASPEC spectrograph at the ESO 3.6-m telescope in August 1994 and September 1996. The resolution of the spectra is comparable to the UVES data and the signal-to-noise ratio ranges from 40 to 90; further details are given by Lennon et al. (2003).
3 Morphological comparison with Galactic spectra
3.1 Luminosity class Ia stars
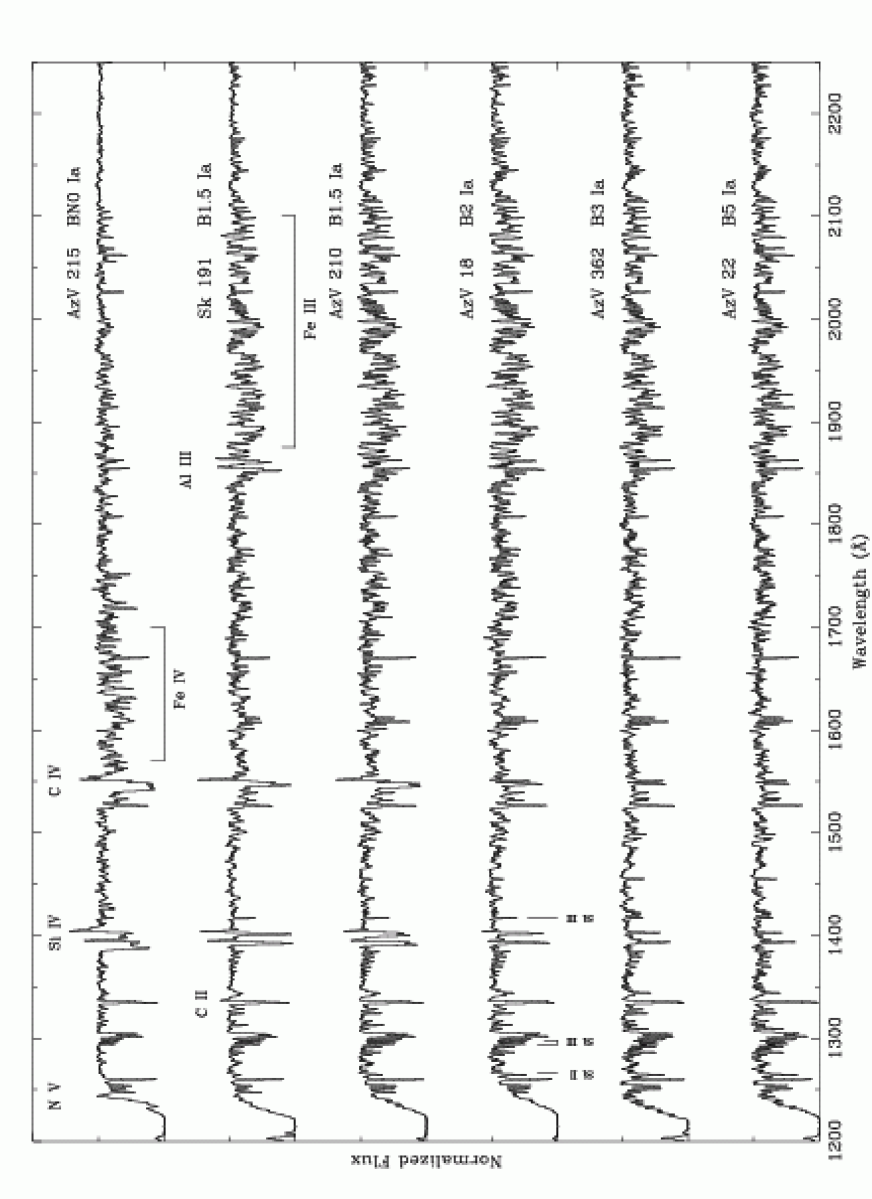
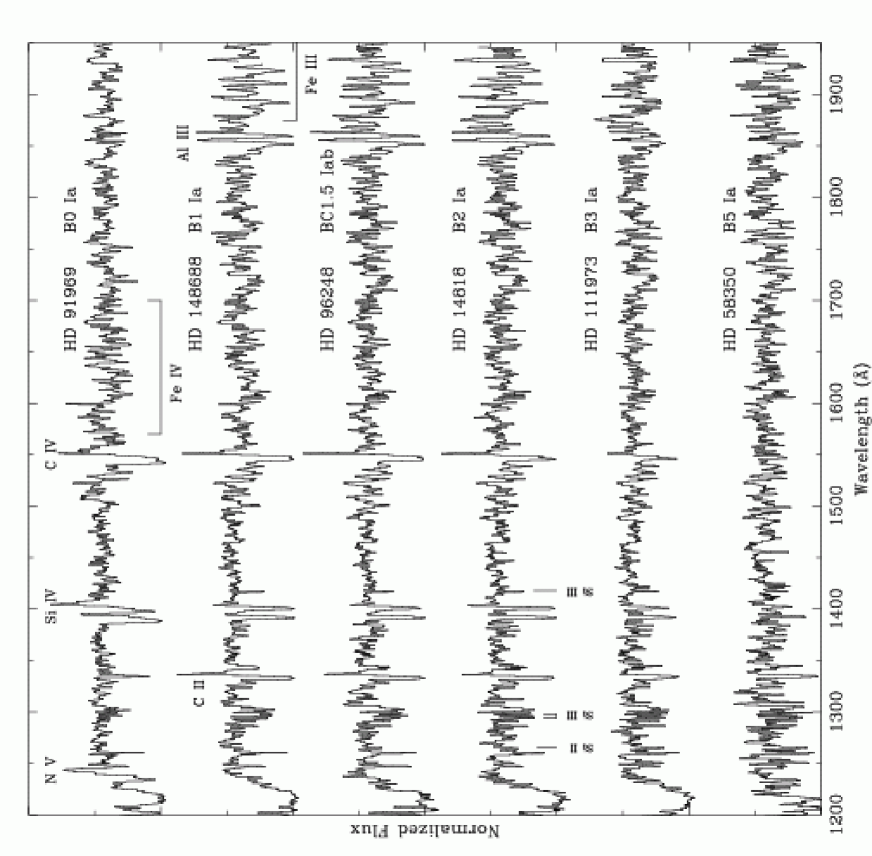
The STIS spectra of our class Ia SMC targets (with the exception of AzV 104, see Section 4) are shown in Figure 2. Galactic analogues to these six stars from the Walborn et al. (1995a) atlas are shown in Figure 3. For display purposes the spectra have been smoothed using a 5-pixel ‘boxcar’ median filter. There are extant high-resolution, long-wavelength camera observations (i.e., redward of 1950 Å) in the archive for the majority of the stars here, however the spectra are typically of low quality and are not included in our discussions. When compiling Galactic analogues we have deliberately omitted HD 152236 ( Sco, B1.5 Ia), because of its peculiar nature, and identification as a candidate luminous blue variable (e.g., Sterken et al. 1997). Instead we include HD 148688 (B1 Ia) and HD 96248 (BC1.5 Iab) as the most suitable stars for comparison with Sk 191 and AzV 210 (both B1.5 Ia). As noted by Evans et al. (2004a; Fig. 2 therein), the morphology of the Si IV doublet in AzV 215 is peculiar; there is a relatively flat ‘shelf’ in the profiles, resembling those seen in Ori (HD 38771, B0.5 Ia, Walborn et al. 1995a), the origins of which are currently unclear.
As one progresses from B0 to B5, there are a number of clear trends. In the SMC data the P Cygni profiles of the Si IV and C IV lines weaken at later types (see Figure 2); there is evidence of a weak stellar wind in the Si IV lines of AzV 18 (B2 Ia), with only photospheric features seen in AzV 362 (B3 Ia). The Faint Object Spectrograph (FOS) observations of AzV 488 (B0.5 Ia) presented by Walborn et al. (1995b) fit neatly into this sequence. The SMC data contrast with the Galactic data (see Figure 3), in which obvious wind signatures are seen through to at least B3 Ia (HD 111973).
Furthermore, at a given spectral type, the P Cygni emission in the SMC targets is generally weaker than in the Galactic data. This is a well documented phenomenon in early-type spectra (e.g., Hutchings, 1982; Bruhweiler et al. 1982) and is most striking in the current comparisons for C II 1334, 1336 and Al III 1855, 1863. In contrast, the Si IV 1394, 1403 lines in HD 96248 and 148688 are interesting in that, although they display weak emission, the intensity is less than in the SMC spectra. In the case of HD 96248 this could be potentially explained as arising from its lower luminosity, with the significant C II and C IV emission due to an enhanced carbon abundance (the star is classified as BC-type). However, the Al III features in HD 96248 are comparable to those seen in HD 148688, suggesting that abundance anomalies are not solely responsible.
It is apparent from Figures 2 and 3 that the lower metallicity of the SMC is manifested by significantly weaker Fe III absorption in the ‘forest’ redward of the Al III doublet, although the extent of the data in this region is relatively limited. Figure 2 also neatly illustrates the change of the dominant ionization stage of iron in early B-type stars. In AzV 215 the multitude of Fe IV lines in the 1550-1700 region are clearly visible, with relatively weak Fe III lines; this situation is reversed in Sk 191 and AzV 210. These features are also present in the Galactic data, although it is less obvious given the greater metallicity and reduced wavelength coverage. Walborn & Nichols-Bohlin (1987) noted that there appeared to be a distinct difference in the stellar wind features between B0.5 Ia and B0.7 Ia spectra. This correlates with the change in iron ionization seen here, suggested by Vink et al. (2001) as a physical explanation for the so-called ‘bi-stability’ of stellar winds.
3.2 Lower luminosity stars
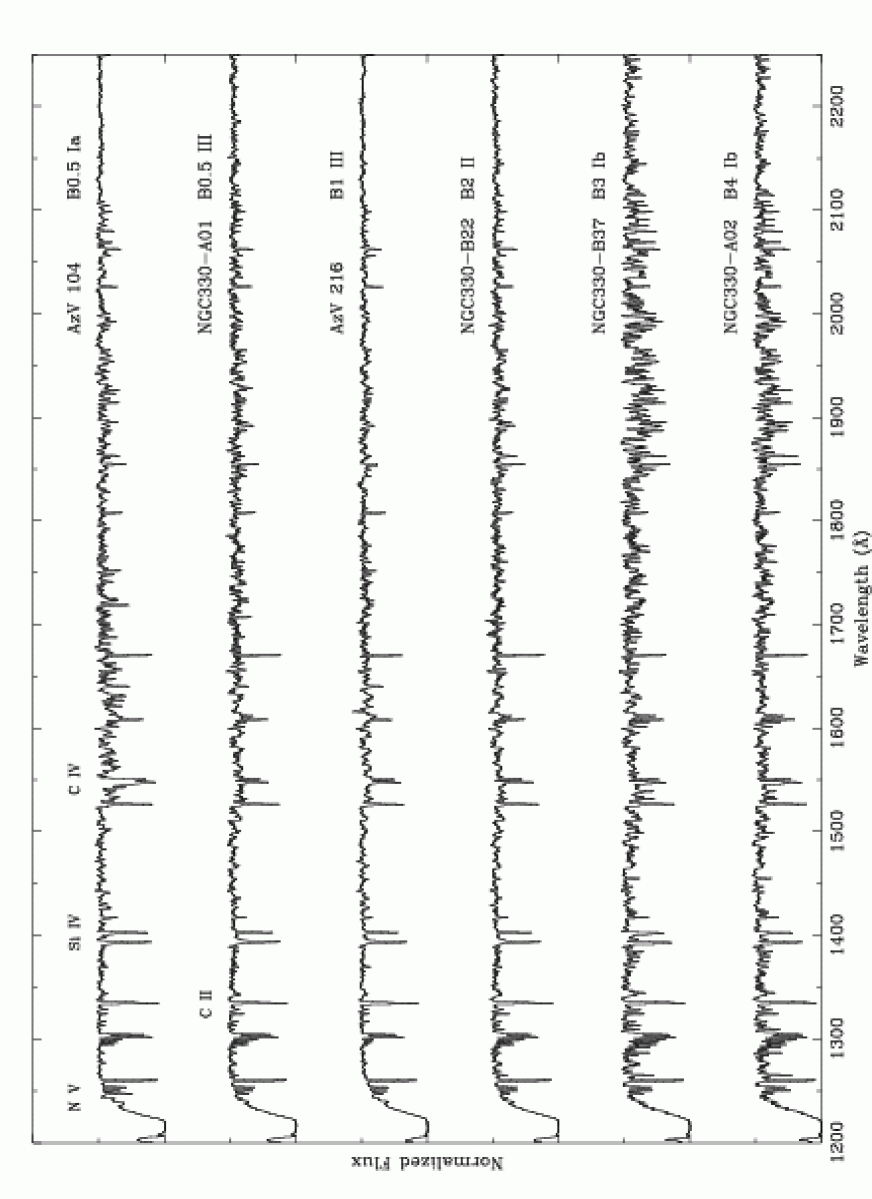
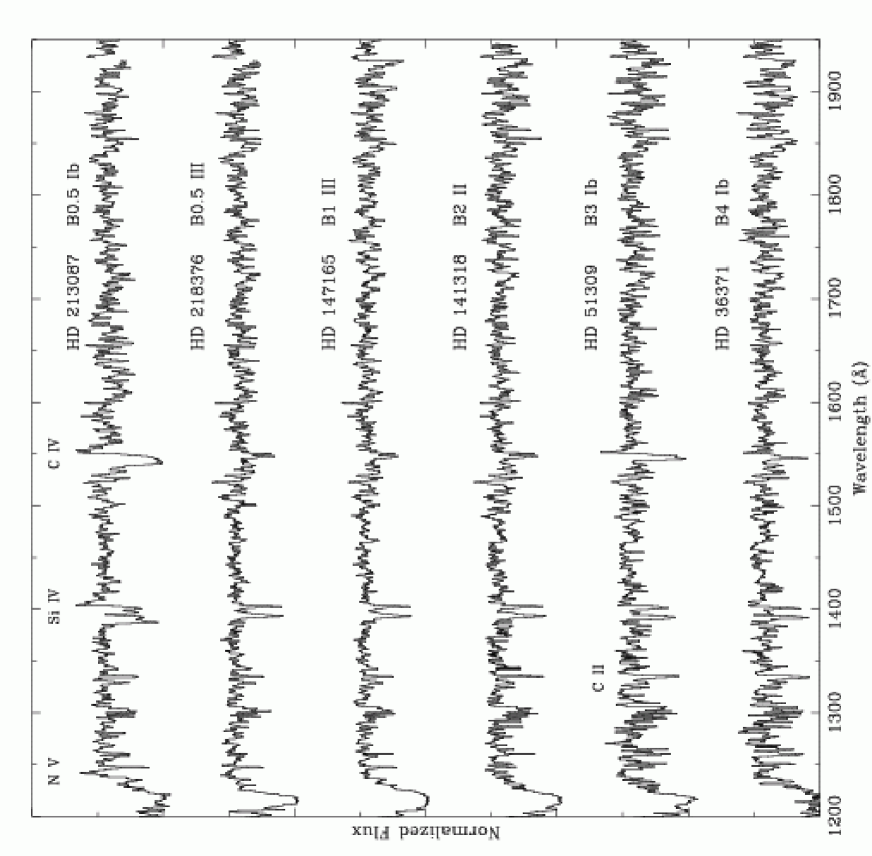
We now move to the less luminous targets, shown in Figure 4. In Figure 5 we again show Galactic analogues drawn from the atlas of Walborn et al. (1995a).
Classified as B0.5 Ia by Lennon (1997), AzV 104 appears to be exceptional in that its physical properties do not appear to correlate well with its blue-region optical morphology. A critical re-examination of the optical spectra of this star is presented in Section 4. For now we compare our STIS spectrum with that of HD 213087 (B0.5 Ib). In their analysis of terminal velocities, Evans et al. (2004a) were unable to apply the ‘Sobolev with exact integration’ (SEI) method to the UV resonance lines of AzV 104, although from inspection of the Si IV and C IV profiles it appears that there is some wind present, albeit particularly weak. In contrast, the wind in HD 213087 appears more significant (ignoring for the moment any potential luminousity effects arising from mis-matching classifications).
The remainder of the lower luminosity STIS spectra are largely photospheric in origin, with no evidence of stellar winds in their resonance lines. Similarly, in the Galactic spectra, HD 218376 (B0.5 III), HD 147165 (B1 III), and HD 141381 (B2 II) also contain only photospheric features. However, in the two class Ib Galactic spectra, i.e., HD 51309 and 36371, weak P Cygni profiles are seen in the C IV doublet. As in the class Ia stars, evidence of stellar winds is seen to later spectral types for class Ib in the Galaxy than in the SMC. Again, the dominant stage of iron is revealed by the spectra, the 1550-1700 Fe IV lines are clearly visible in AzV 104, with the 1850-2000 Fe III lines strongly in absorption in NGC330-B37 and NGC330-A02.
4 Morphological comparisons of the ultraviolet and optical data
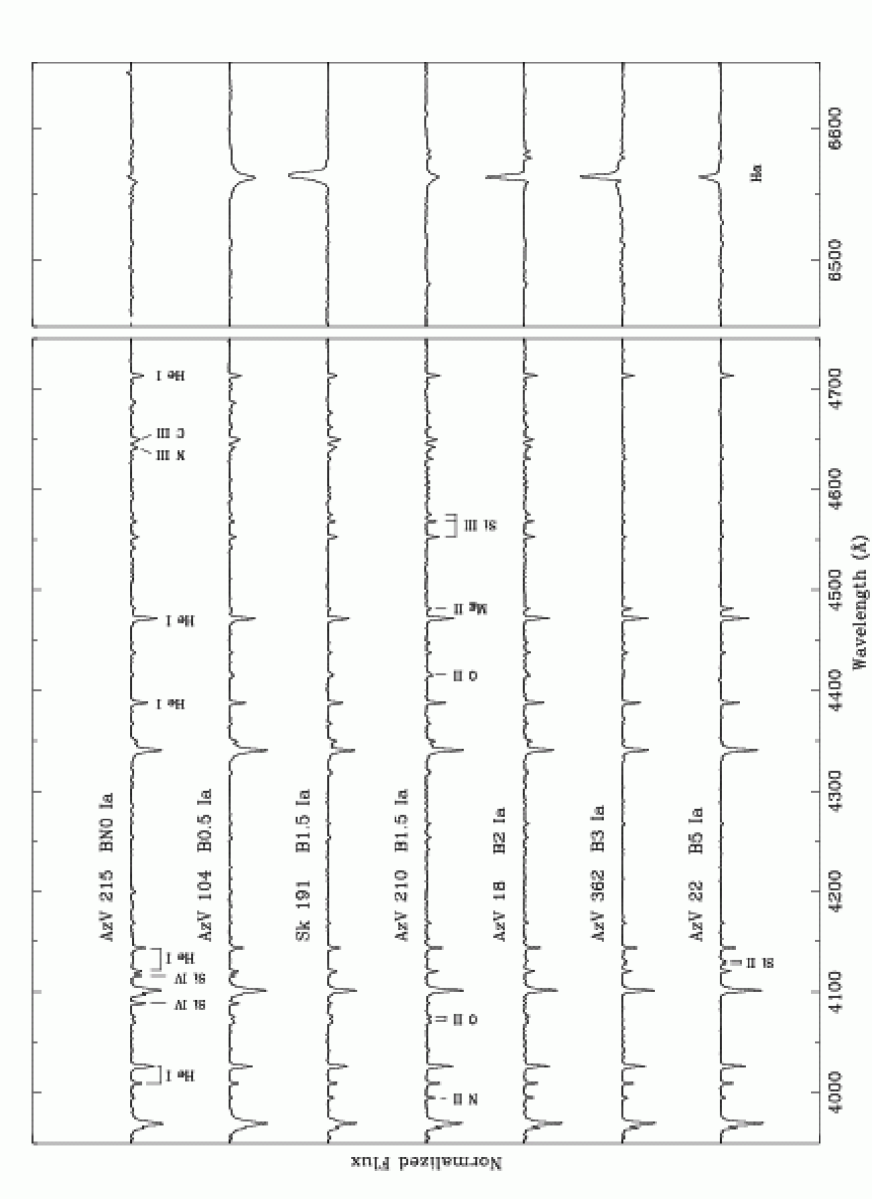
In Figure 6 we show optical spectra for the seven class Ia stars. The data have been smoothed and rebinned to an effective resolution of 1.5 Å (cf. Walborn & Fitzpatrick, 1990) and have also been corrected for the measured recession velocities.
Given their excellent signal-to-noise ratio, the blue-region optical data offer a wonderfully clear illustration of the trends in early B-type spectra. The principal temperature diagnostic in these stars is the ionization balance of Si IV, Si III, and Si II. The optical lines marked in Figure 6 are well complemented by several UV photospheric lines (e.g., Si II 1265, and Si III 1294, 1299, 1417, as marked in Figure 2) that were suggested by Massa (1989) and Prinja (1990) as potential UV temperature diagnostics. Indeed, from simple inspection of the Si II 1265 line alone in AzV 210, one would be tempted to suggest a cooler temperature than Sk 191, even though the spectral types are identical. These morphological arguments are confirmed by the model atmosphere analysis of Trundle et al. (2004) which found a temperature of 20,500 K for AzV 210, some 2,000 K lower than that found for Sk 191.
Similarly, the optical spectra neatly illustrate the increase and then decrease in the intensity of the main O II features (4072-76, 4345-49, 4415-17) as one moves from B0B1.5B3. The H Balmer profiles of the stars are also shown in Figure 6, with a wide range of morphologies displayed, i.e., pure absorption (albeit very slightly ‘filled-in’ by wind effects, AzV 104), ‘filled-in’ absorption (AzV 210), weak P-Cygni (AzV 215) and broad emission (Sk 191).
From comparisons with the UV spectra in Figure 2 (and AzV 104 in Figure 4), the optical data highlight the strong correlation of the UV and H profiles for the earliest B-type spectra, i.e., AzV 215, AzV 104, AzV 210 and Sk 191. In contrast, the significant H emission in AzV 18 (B2 Ia), AzV 362 (B3 Ia), and AzV 22 (B5 Ia) appear initially to contradict the UV spectra; the H emission suggests some degree of stellar wind, yet the UV spectra display little or no evidence. This is attributable to the range of temperatures covered by our sample, e.g., the dominant ionization stage of silicon changes from Si3+ Si2+ Si1+ as one progresses from B0 to B5. Thus, even in the presence of a stellar wind, P Cygni emission is not expected in the Si IV doublet at the latest types, although weak photospheric features are still seen.
4.1 AzV 104
Particularly striking in Figures 5 and 6 are the spectra of AzV 104 (B0.5 Ia), in which the H absorption tallies with the lack of obvious wind signatures in the UV; in this case it would appear that the luminosity has not been predicted correctly by morphological considerations. The optical classification employed here is that from Lennon (1997), in which luminosity class was assigned using the H equivalent width calibrations of Azzopardi (1987). From photometric and intrinsic colour arguments, Trundle et al. (2004) gave 5.82, more in keeping with that expected from a B0.5 Ib star (e.g., Humphreys & McElroy, 1984) than one classified as B0.5 Ia.
The overestimated luminosity is not obviously a metallicity effect. The principle advantage of using H as a luminosity diagnostic is that it is expected to be relatively unaffected by changes in metallicity. In contrast, if Galactic criteria involving metal-line intensities are applied directly to B-type SMC spectra, the luminosity class is often underpredicted (e.g. Walborn 1983). We do not suggest that the luminosity class be revised on the basis of this discussion (such a change would against the philosophy of the ‘MK process’), but merely comment that in this case the H calibrations appear to incorrectly predict the intrinsic luminosity.
5 Discussion
5.1 Weaker winds at low metallicity?
A long-standing challenge of observational studies of massive stars has been to test conclusively the theoretical prediction that mass-loss scales with metallicity such as (Kudritzki et al. 1987; Vink et al. 2001).
Recent results from Evans et al. (2004b) and Trundle et al. (2004) have highlighted that the predictions from the mass-loss ‘recipe’ of Vink et al. (2001) do not tally with the observationally derived rates in the Magellanic Clouds. However, contemporary results from Crowther et al. (2004) suggest similar differences between observational and theoretical mass-loss rates for Galactic B-type supergiants, i.e., there appears to be tentative evidence for observational confirmation of some metallicity dependence, with the absolute values differing to those of the Vink et al. (2001) purely as a consequence of the theoretical methods employed.
The comparison of the Galactic and SMC spectra in Section 3 offers some insight in this context. In general, from the more intense P Cygni emission at a given spectral type, a stronger stellar wind can be inferred in the Galactic stars than in our SMC targets. At first, such behaviour in the Clouds was attributed solely to the lower abundances (e.g., Bruhweiler et al. 1982), with wind effects thought to play a less significant role. However, in a star such as AzV 215, the resonance lines are strongly saturated and the line is only weakly dependent on abundance changes, even over the large range of SMC to solar metallicity; the stellar wind dominates the formation of the resulting profile.
Stronger winds in the Galactic targets can also be inferred from the presence of P Cygni features at later spectral types than those seen in the SMC spectra. This point is made most strongly by the saturated C IV doublet in HD 51309 (B3 Ib, see Figure 5) compared to the weak photospheric absorption seen in NGC330-B37 (also B3 Ib); such a difference cannot be explained by abundance effects alone.
It is unlikely that different temperatures can account for these effects; the results found by Trundle et al. (2004) for their SMC targets are comparable to those found for Galactic B-type supergiants by Crowther et al. (2004). Similarly, though a relatively wide range of physical luminosity is possible for stars classified as type Ia, the Galactic and SMC samples do not appear to be particularly mismatched. For instance, Kudritzki et al. (1999) give the luminosity of HD 14818 (B2 Ia) as log(L/L⊙) = 5.47, cf. 5.44 for AzV 18 (also B2 Ia, Trundle et al. 2004).
Interestingly, Evans et al. (2004a) found no evidence for a significant scaling in the wind terminal velocities in early B-type UV spectra; four of their targets were drawn from the STIS data presented here (namely AzV 18, AzV 210, AzV 215, and Sk 191). So, in comparison to Galactic stars, the early B-type SMC supergiants appear to have weaker winds, but with comparable terminal velocities, in agreement with the predictions of radiatively driven wind theory.
5.2 Ultraviolet Iron Indices and their application to unresolved systems
The STIS data have a further application in the context of population synthesis models. Rix et al. (2004) have proposed an equivalent-width index centered at 1978 Å as a useful probe of metallicity in high redshift, star-forming galaxies. This index is effectively the summed photospheric absorption between 1935 and 2020 Å (which largely arises from Fe III lines, e.g., Swings et al. 1976) and, in the case of constant star formation, was found to be more sensitive than the indices suggested by Leitherer et al. (2001) centered at 1370 Å and 1425 Å.
The data presented here provide an opportunity to begin to investigate this index empirically. Following correction for the stellar radial velocities given in Table The ultraviolet and optical spectra of luminous B-type stars in the Small Magellanic Cloud, each of the STIS spectra was treated in the same manner as the models used by Rix et al., i.e., they were degraded to an effective resolution of 2.5 Å (to ensure compatibility with contemporary observations of high redshift systems) and then rectified using the same continuum windows. We include the equivalent widths of the 1978 index in Table The ultraviolet and optical spectra of luminous B-type stars in the Small Magellanic Cloud. The measurement uncertainties largely arise from the difficulty in accurate placement of the continuum and are typically 10 when Wλ(1978) 5 Å, increasing to 15-20 when Wλ(1978) 5 Å. The measurements for the class Ia stars provide a further illustration of the temperature sequence in early B-type spectra. The equivalent width is greatest at B2, and is seen to increase significantly between B0.5 and B1.5, the region in which the ‘bi-stability jump’ in the behaviour of stellar winds is found.
As one might expect, there is some degeneracy between the index for the early-B, class Ia objects and later-type, less luminous stars (i.e., AzV 215 and AzV 104 cf. NGC330-B22); similar conclusions were reported by Swings et al. (1976) from their low-resolution spectra, obtained using the European TD1 satellite. In a brief episode of star formation this degeneracy (effectively the age/metallicity degeneracy) can be quite limiting but, coupled with other information from the spectrum such as the appearance of the resonance lines, the dominant stellar population can be better constrained. For example, the dominant population in an integrated spectrum displaying significant P Cygni emission in the resonance lines, with a large 1978 equivalent width, is likely to be much less evolved than one in which there is no evidence of wind features, coupled with a smaller 1978 index. Similar morphological arguments were used by Vzquez et al. (2004), in combination with theoretical evolutionary isochrones to constrain the age of the super-star cluster NGC 1705-1.
5.3 The combined SMC sample
In Table The ultraviolet and optical spectra of luminous B-type stars in the Small Magellanic Cloud we compile the full list of stars observed with for our O- and B-type programs (i.e., GO7437 and GO9116) and in Figure 7 we present an H-R diagram for the sample. The evolutionary tracks (dotted lines) are from Charbonnel et al. (1993), with = 0.004 and standard mass-loss rates; for clarity the 120, 85, 60 and 40 M⊙ models are truncated at the onset of helium burning. Our intent here is merely to guide the reader to the approximate mass range of our targets so for simplicity we prefer these over newer evolutionary tracks (e.g. those of Maeder & Meynet, 2001), in part to remove the need to assume initial rotational velocities for each star.
Where available, temperatures and luminosities have been taken from published model atmosphere analyses, as indicated in Table The ultraviolet and optical spectra of luminous B-type stars in the Small Magellanic Cloud. For the remaining stars, temperatures have been interpolated between recent results from line-blanketed model atmospheres (Martins et al. 2002, Crowther et al. 2002, and Herrero et al. 2002), with luminosities calculated from the photometry in Paper 1 and, in the case of AzV 423, Azzopardi & Vigneau (1975). Intrinsic colours were taken from Fitzgerald (1970) and, for simplicity, the bolometric corrections were calculated using the relation given by Vacca et al. (1996; their Eqn. 6). Although their study employed atmospheres that did not consider the effects of line blanketing, the lower temperatures derived for O-type stars from its inclusion will yield sensibly smaller bolometric corrections using their relation, sufficiently accurate for our ‘cosmetic’ H-R diagram.
6 Summary
We have compared our STIS observations of early B-type stars in the SMC with Galactic spectra from the archive. The two main morphological features of note are the generally weaker P Cygni emission profiles in the SMC spectra at given spectral type, and the presence of P Cygni profiles in the Galactic spectra to later types than those seen in the SMC. The UV and optical spectra of our most luminous SMC targets were compared, neatly illustrating the correlation between diagnostic features in both regions.
We have also begun attempts to calibrate empirically the new 1978 index suggested by Rix et al. (2004). Given the relative dearth of high-resolution observations in this region, these data will also enable valuable tests of WM-Basic (Pauldrach et al. 2001) or cmfgen (Hillier & Miller 1998), necessary if model spectra are to be routinely used in population synthesis models.
As demonstrated by Figure 7, the full SMC OB-type sample now covers a significant part of the upper H-R diagram, providing an unprecedented library of high-resolution, metal-poor spectra. One issue that we have not addressed at the current time is the wealth of interstellar information in the combined OB-type sample; these data provide a wide variety of sight-lines to the SMC and will form the basis of a future study.
7 Acknowledgements
CJE (under grant PPA/G/S/2001/00131), DJL, and SAR acknowledge financial support from the UK Particle Physics and Astronomy Research Council (pparc). NRW acknowledges support through grant GO-9116.09 from the STScI. Based in part on observations with the NASA/ESA Hubble Space Telescope obtained at the Space Telescope Science Institute (STScI), which is operated by the Association of Universities for Research in Astronomy, Inc., under NASA contract NAS 5-26555; and on INES data from the satellite. We thank Paul Crowther for providing his results in advance of publication, Linda Smith for the red AAT observations, Alex Fullerton for the extracted spectra, and the referee for their helpful comments.
References
- (1) Azzopardi M. & Vigneau J., 1975, A&AS, 22, 285
- (2) Azzopardi M. & Vigneau J., 1982, A&AS, 50, 291
- (3) Azzopardi M., 1987, A&AS, 69, 421
- (4) Balona L. & Crampton D., 1974, MNRAS, 166, 203
- (5) Bruhweiler F. C., Parsons S. B., Wray J. D., 1982, ApJ, 256, L49
- (6) Bouret J.-C., Lanz T., Hillier D. J. et al., 2003, ApJ, 595, 1182
- (7) Charbonnel C., Meynet G., Maeder, A. et al., 1993, A&AS, 101, 415
- (8) Crowther P. A., Hillier D. J., Evans C. J. et al., 2002, ApJ, 579, 774
- (9) Crowther P. A., Walborn N. R., Lennon D. J., 2004, in prep.
- (10) De Mello D. F., Leitherer C., Heckman T. M., 2000, ApJ, 530, 251
- (11) Evans C. J., 2001, PhD thesis, Univ. of London
- (12) Evans C. J., Lennon D. J., Trundle C. et al., 2004a, ApJ, 607, 451
- (13) Evans C. J., Crowther P. A., Fullerton A. W., Hillier D. J., 2004b, ApJ, 610, 1021
- (14) Fitzgerald M. P., 1970, A&A, 4, 234
- (15) Fitzpatrick E. L., Garmany C. D., 1990, ApJ, 363, 119
- (16) Garmany C. D., Conti P. S., Massey P., 1987, AJ, 93, 1070
- (17) Herrero A., Puls J., Najarro F., 2002, A&A, 396, 949
- (18) Hillier D. J., Miller D. L., 1998, ApJ, 496, 407
- (19) Hillier D. J., Lanz T., Heap S. R. et al., 2003, ApJ, 588. 1039
- (20) Humphreys R. M., McElroy D. B., 1984, ApJ, 284, 565
- (21) Hutchings J. B., 1982, ApJ, 255, 70
- (22) Kudritzki R.-P., Pauldrach A. W. A., Puls J., 1987, A&A, 173, 293
- (23) Kudritzki R.-P., Puls J., Lennon D. J. et al., 1999, A&A, 350, 970
- (24) Lamers H. J. G. L. M., Snow T. P., Lindholm D. M., 1995, ApJ, 455, 269
- (25) Leitherer C., Leo J. R. S., Heckman T. M. et al., 2001, ApJ, 550, 724
- (26) Leitherer C., Schaerer D., Goldader J. et al., 1999, ApJS, 123, 3
- (27) Lennon D. J., 1997, A&A, 317, 871
- (28) Lennon D. J., Dufton P. L., Crowley C., 2003, A&A, 398, 455
- (29) Maeder A. & Meynet G., 2001, A&A, 373, 555
- (30) Martins F., Schaerer D., Hillier D. J., 2002, A&A, 382, 999
- (31) Massa D., 1989, A&A, 224, 131
- (32) Massey P., Parker J. W., Garmany G. D., 1989, AJ, 98, 1305
- (33) Massey P., 2002, ApJS, 141, 81
- (34) Massey P., Bresolin F., Kudritzki R.-P. et al. 2004, ApJ, 608, 1001
- (35) Pauldrach A. W. A., Hoffmann T. L., Lennon M., 2001, A&A, 375, 161
- (36) Pettini M., Ellison S. L., Bergeron J., Petitjean P., 2002, A&A, 391, 21
- (37) Prinja R. K., 1990, MNRAS, 246, 392
- (38) Rix S., Pettini M. et al., 2004, ApJ, in press
- (39) Robertson J. W., 1974, A&AS, 15, 261
- (40) Sanduleak N., 1968, AJ, 73, 246
- (41) Schaln C., 1975, A&A, 42, 251
- (42) Shull J. M., Van Steenberg M. E., 1985, ApJ, 294, 599
- (43) Sterken C., de Groot M., van Genderen A. M., 1997, A&AS, 326, 640
- (44) Swings J. P., Klutz M., Vreux J. M., Peytremann E., 1976, A&AS, 25, 193
- (45) Trundle C., Lennon D. J., Puls J., Dufton P. L., 2004, A&A, 417, 217
- (46) Tumlinson J., Shull J. M., Rachford B. L. et al., 2002, ApJ, 566, 857
- (47) Vacca W. D., Garmany C. D., Shull M. J., 1996, ApJ, 460, 914
- (48) Vzquez G. A., Leitherer C., Heckman T. M. et al., 2004, ApJ, 600, 162
- (49) Venn K., 1999, ApJ, 518, 405
- (50) Vink, J. S., de Koter, A., Lamers, H. J. G. L. M., 2001, A&A, 369, 574
- (51) Walborn N. R., 1983, ApJ, 265, 716
- (52) Walborn N. R., Nichols-Bohlin J., 1987, PASP, 99, 40
- (53) Walborn N. R., Fitzpatrick, E. L., 1990, PASP, 102, 379
- (54) Walborn N. R., Parker J. W., Nichols J., 1995, International Ultraviolet Explorer Atlas of B-type Spectra from 1200 to 1900Å, (NASA RP1363; Washington; NASA)
- (55) Walborn N. R., Lennon D. J., Haser S. M. et al., 1995b, PASP, 107, 104
- (56) Walborn N. R., Lennon D. J., Heap S. R. et al., 2000, PASP, 112, 1243 (Paper 1)
- (57) Walborn N. R., Fullerton A. W., Crowther P. A. et al., 2002, ApJS, 141, 443
| Star | Alias | Sp. Type | Ref. | Ref. | Exp. [min] | log (H I) | Optical | Wλ(1978) | ||||||
|---|---|---|---|---|---|---|---|---|---|---|---|---|---|---|
| [kK] | [] | E140M | E230M | [cm-2] | Telescope | [Å] | ||||||||
| AzV 215 | Sk 76 | BN0 Ia | 2 | 12.69 | 0.09 | 4 | 6.6 | 27.0 | 159 | 106 | 37.5 | 21.8 | VLT | 5.7 |
| AzV 104 | – | B0.5 Ia | 2 | 13.17 | 0.16 | 4 | 5.8 | 27.5 | 163 | 106 | 37.5 | 21.4 | VLT | 5.0 |
| NGC330-A01 | – | B0.5 III | 3 | 14.70 | 0.18 | 3 | 4.5 | 24.0 | 151 | 237 | 145 | 21.5 | ESO 3.6-m | 4.2 |
| AzV 216 | – | B1 III | 5 | 14.22 | 0.13 | 4 | 5.1 | 26.0 | 203 | 183 | 108 | 21.6 | VLT | 3.1 |
| Sk 191 | – | B1.5 Ia | 2 | 11.86 | 0.04 | 1 | 7.4 | 22.5 | 130 | 54 | 37.5 | 21.4 | VLT | 15.1 |
| AzV 210 | Sk 73 | B1.5 Ia | 2 | 12.60 | 0.02 | 4 | 6.7 | 20.5 | 173 | 124 | 60.5 | 21.6 | VLT | 16.3 |
| AzV 18 | Sk 13 | B2 Ia | 2 | 12.46 | 0.03 | 1 | 7.0 | 19.0 | 138 | 216 | 75 | 21.8 | VLT | 18.5 |
| NGC330-B22 | – | B2 II | 3 | 14.29 | 0.13 | 3 | 4.9 | 20.0 | 157 | 308 | 243 | 21.5 | ESO 3.6-m | 4.7 |
| AzV 362 | Sk 114 | B3 Ia | 2 | 11.36 | 0.03 | 1 | 7.8 | 14.0 | 208 | 54 | 37.5 | 21.3 | VLT/NTT | 14.2 |
| NGC330-B37 | – | B3 Ib | 3 | 13.19 | 0.07 | 3 | 6.0 | 18.0 | 156 | 183 | 108 | 21.4: | ESO 3.6-m | 13.9 |
| NGC330-A02 | – | B4 Ib | 3 | 12.90 | 0.05 | 3 | 6.3 | 16.0 | 151 | 237 | 145 | 21.5 | ESO 3.6-m | 9.8 |
| AzV 22 | Sk 15 | B5 Ia | 2 | 12.25 | 0.10 | 1 | 6.6 | 14.5 | 139 | 162 | 75 | 21.5 | VLT/NTT | 11.3 |
Note. — Stellar identifications are those of Azzopardi & Vigneau (AzV; 1975, 1982), Robertson (NGC330; 1974) and Sanduleak (Sk; 1968). Absolute magnitudes () are calculated using intrinsic colours from Fitzpatrick & Garmany (1990) and Fitzgerald (1970), adopting a distance modulus of 18.9 (Harries et al., 2003) and taking the ratio of total to selective extinction (e.g. Schaln, 1975). Effective temperatures and radial velocities are from Lennon et al. (2003) and Trundle et al. (2004).
References. — (1) Garmany et al. (1987); (2) Lennon (1997); (3) Lennon et al. (2003) – although in the case of NGC330-A01 the luminosity class has been revised from III/V to III following comparisons of the H equivalent width with the calibrations of Balona & Crampton (1974); (4) Massey (2002); (5) Trundle et al. (2004)
| Star | Spectral Type | (kK) | log(L/L⊙) | Ref. |
|---|---|---|---|---|
| NGC 346 MPG 355 | ON2 III(f∗) | 52.5 | 6.04 | 1 |
| NGC 346 MPG 324 | O4 V((f)) | 41.5 | 5.52 | 1 |
| NGC 346 MPG 368 | O4-5 V((f)) | 40.0 | 5.41 | 1 |
| AzV 80 | O4-6n(f)p | 40.5 | 5.9 | – |
| AzV 75 | O5 III(f) | 40.0 | 6.2 | 5 |
| NGC 346 MPG 113 | OC6 Vz | 40.0 | 5.15 | 1 |
| AzV 220 | O6.5 f?p | 37.3 | 5.2 | – |
| AzV 15 | O6.5 II(f) | 35.0 | 5.7 | – |
| AzV 95 | O7 III((f)) | 34.7 | 5.3 | – |
| AzV 83 | O7 Iaf | 32.8 | 5.54 | 2 |
| AzV 69 | OC7.5 III((f)) | 33.9 | 5.61 | 2 |
| AzV 47 | O8 III((f)) | 32.6 | 5.5 | – |
| NGC 346 MPG 487 | O8 V | 35.0 | 5.15 | 1 |
| AzV 327 | O9.5 II-Ibw | 28.4 | 5.4 | – |
| AzV 423 | O9.5 II(n) | 28.4 | 5.4 | – |
| NGC 346 MPG 12 | O9.5-B0 V (N str) | 31.0 | 4.93 | 1 |
| AzV 170 | O9.7 III | 30.0 | 5.1 | – |
| AzV 215 | BN0 Ia | 27.0 | 5.63 | 4 |
| AzV 104 | B0.5 Ia | 27.5 | 5.31 | 4 |
| NGC330-A01 | B0.5 III/V | 24.0 | 4.67 | 3 |
| AzV 216 | B1 III | 26.0 | 5.00 | 4 |
| Sk 191 | B1.5 Ia | 22.5 | 5.77 | 4 |
| AzV 210 | B1.5 Ia | 20.5 | 5.41 | 4 |
| AzV 18 | B2 Ia | 19.0 | 5.44 | 4 |
| NGC330-B22 | B2 II | 20.0 | 4.65 | 3 |
| AzV 362 | B3 Ia | 14.0 | 5.50 | 4 |
| NGC330-B37 | B3 Ib | 18.0 | 4.98 | 3 |
| NGC330-A02 | B4 Ib | 16.0 | 4.98 | 3 |
| AzV 22 | B5 Ia | 14.5 | 5.04 | 4 |
References. — (1) Bouret et al. (2003); (2) Hillier et al. (2003); (3) Lennon et al. (2003); (4) Trundle et al. (2004); (5) Massey et al. (2004)
Note. — Italicized values denote values interpolated from published results, see text for details